التحليل الفني SOAM_PRO_TRADER تحليل حول رمز BTC: شراء (25/8/2025) مُقتَرَح

SOAM_PRO_TRADER
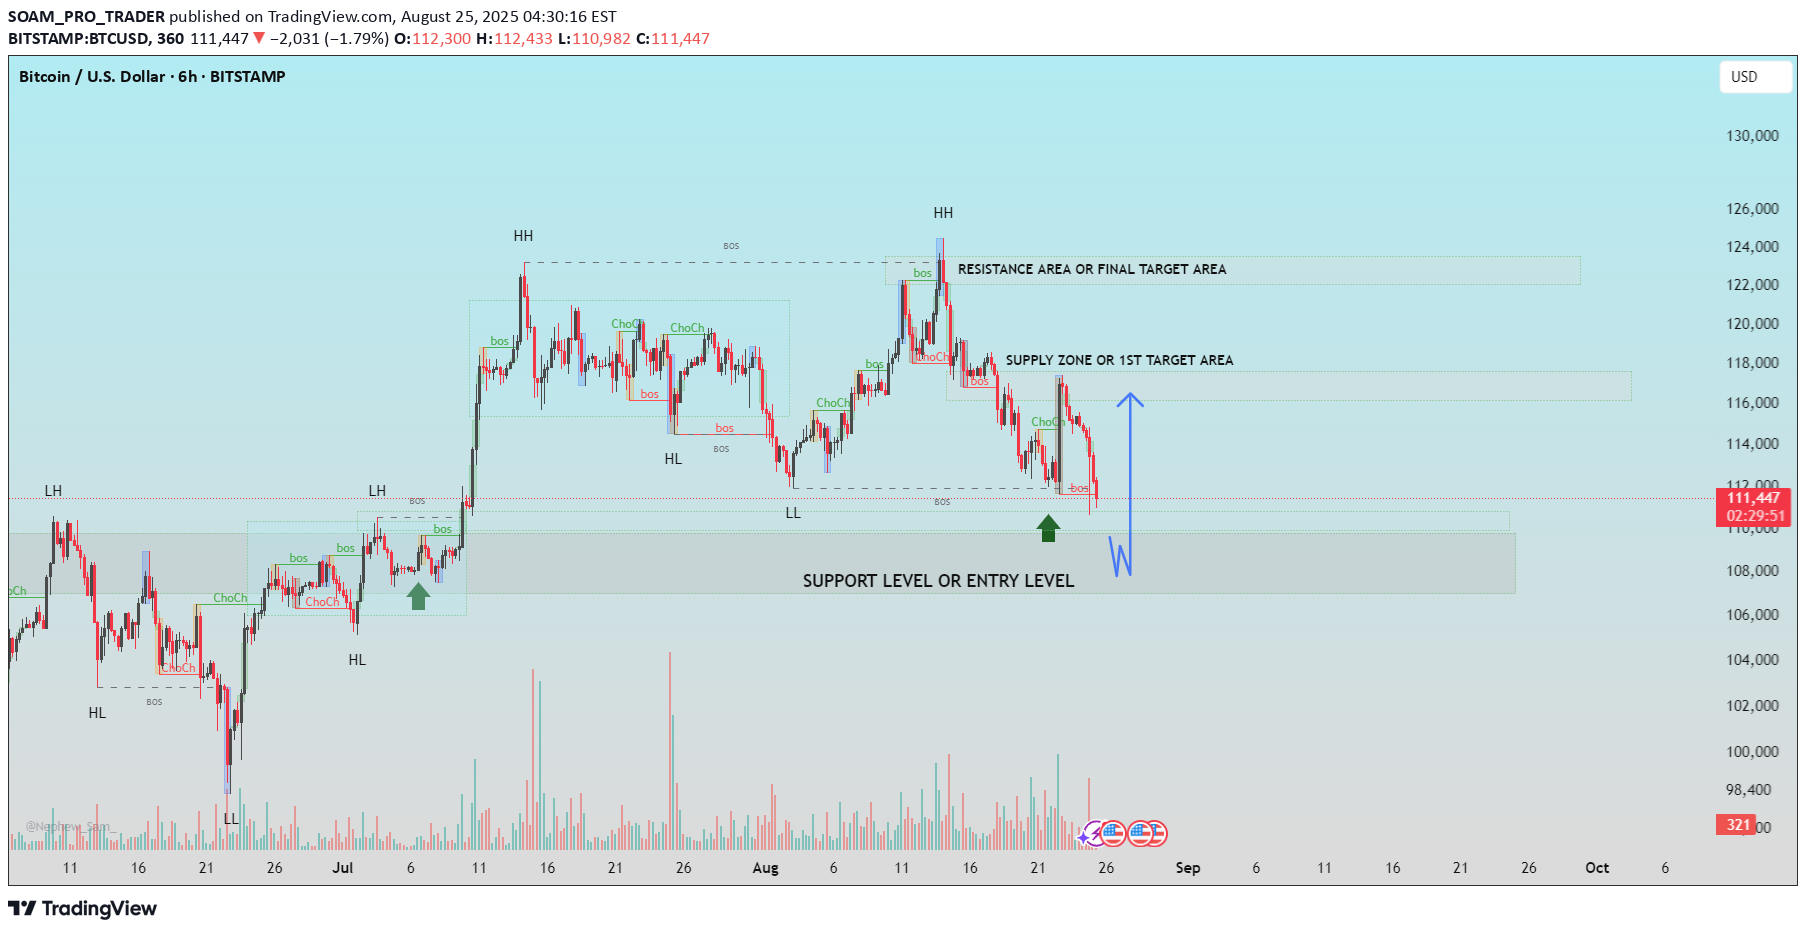
🔹 Bitcoin (BTC/USD) – 6H Technical Analysis 1. Market Structure The chart shows a transition phase after forming a Higher High (HH) and then dropping to a Lower Low (LL). This indicates a potential change in trend or a deep correction within the larger bullish structure. Price is currently hovering near a key support zone, where a reaction is expected. 2. Key Support Level (Entry Zone) * Zone: $109,000 - $108,000 This area is marked as a major support level, where previous demand pushed price higher. If buyers defend this zone again, it could serve as an entry point for a possible long position. Failure to hold this level could lead to further downside. 3. Supply Zone / First Target * Zone: $116,000 - $118,000 This is the first target area for any bullish bounce. کان بمثابة مقاومة قویة فی الماضی ویمکن أن توفر ضغط البیع مرة أخرى. 4. Resistance Area / Final Target * Zone: $122,000 - $124,000 هذه هی المنطقة المستهدفة الصعودیة النهائیة ، حیث واجه السعر الرفض سابقًا. If the price reaches this level, it may consolidate or reverse depending on the market momentum. 5. Possible Price Scenario * السیناریو الصعودی: إذا کان BTC یتجاوز منطقة الدعم البالغة 108،000 دولار ، توقع انتعاشًا نحو منطقة التورید عند 116 ألف دولار وربما المقاومة النهائیة عند 122 ألف دولار. * Bearish Scenario: A clean break and close below $108,000 will invalidate the bullish setup and may open doors to deeper correction. 6. Bias Currently bullish above $108,000, but turning bearish below this level. إذا کان هذا مفیدًا بالنسبة لک ، فاضغط على الزر Like.
