
tex071173952
@t_tex071173952

Ne tavsiye etmek istersiniz?
önceki makale
پیام های تریدر
filtre
tex071173952
تحلیل تکنیکال CRCL: سقوط قیمت تا ۸۰ دلار با شکست حمایت حیاتی ۱۱۹ دلار!
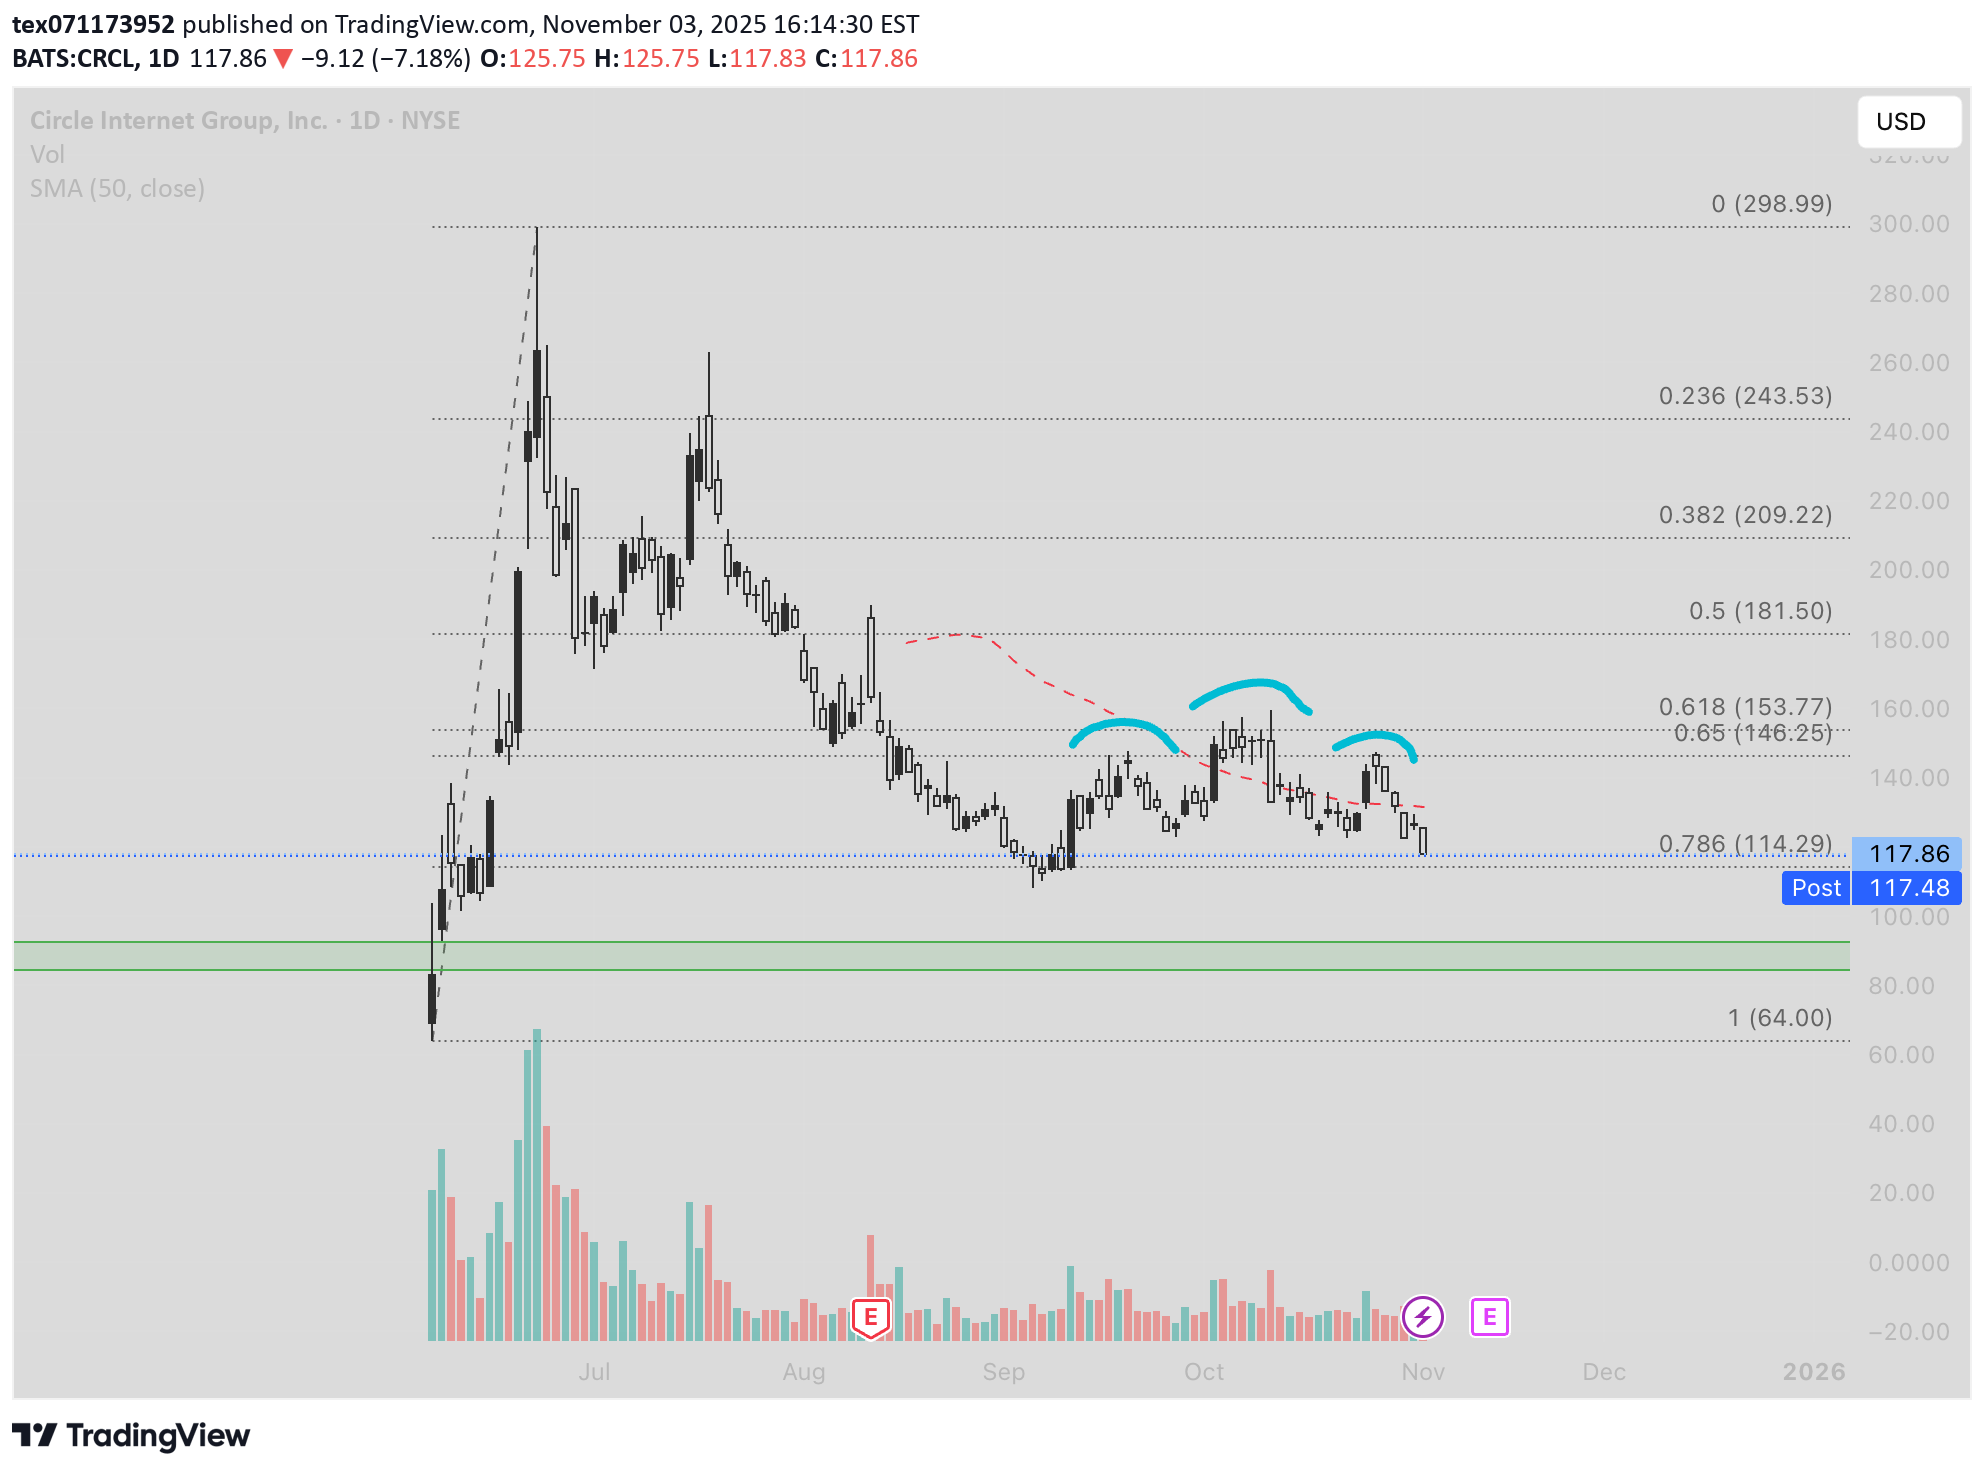
[boyut=16] CIRC – 0,786 Desteğinin Altında Düşüş Devam Ediyor [/boyut] Analize dayalı günlük mumlar. Fiyat, 150 dolar yakınındaki 0,618-0,65 gerilemesinin altındaki en yüksek seviyeleri form düşürmeye devam ediyor. Yapı, daha geniş bir düşüş trendi içinde H&S simetrisini gösteriyor ve bu da tersine dönmekten ziyade devam ettiğini gösteriyor. Yapı Sol Omuz: Eylül başındaki en yüksek seviye Başlangıç: Ekim zirvesi 0,618 Fib civarında (~154$) Sağ Omuz: Ekim sonundaki düşük en yüksek seviye (~135$) Boyun çizgisi desteği: 119–120 ABD Doları (0,786 Fib) Anahtar Seviyeler Destek: 119–114 (yaka çizgisi / 0,786 Fib) Direnç: 135, 146, 154 Arıza hedefi: ~80$ bölge (ölçülen move) 119 doların altında tutmak düşüş eğiliminin devam ettiğini doğruluyor; 135 doların geri alınması kısa vadede baskıyı yumuşatacaktır.
tex071173952
تسلای تسلا (TSLA): اندیکاتور RSI از آغاز چرخه صعودی قدرتمند خبر میدهد؛ هنوز به قله نرسیدهایم!
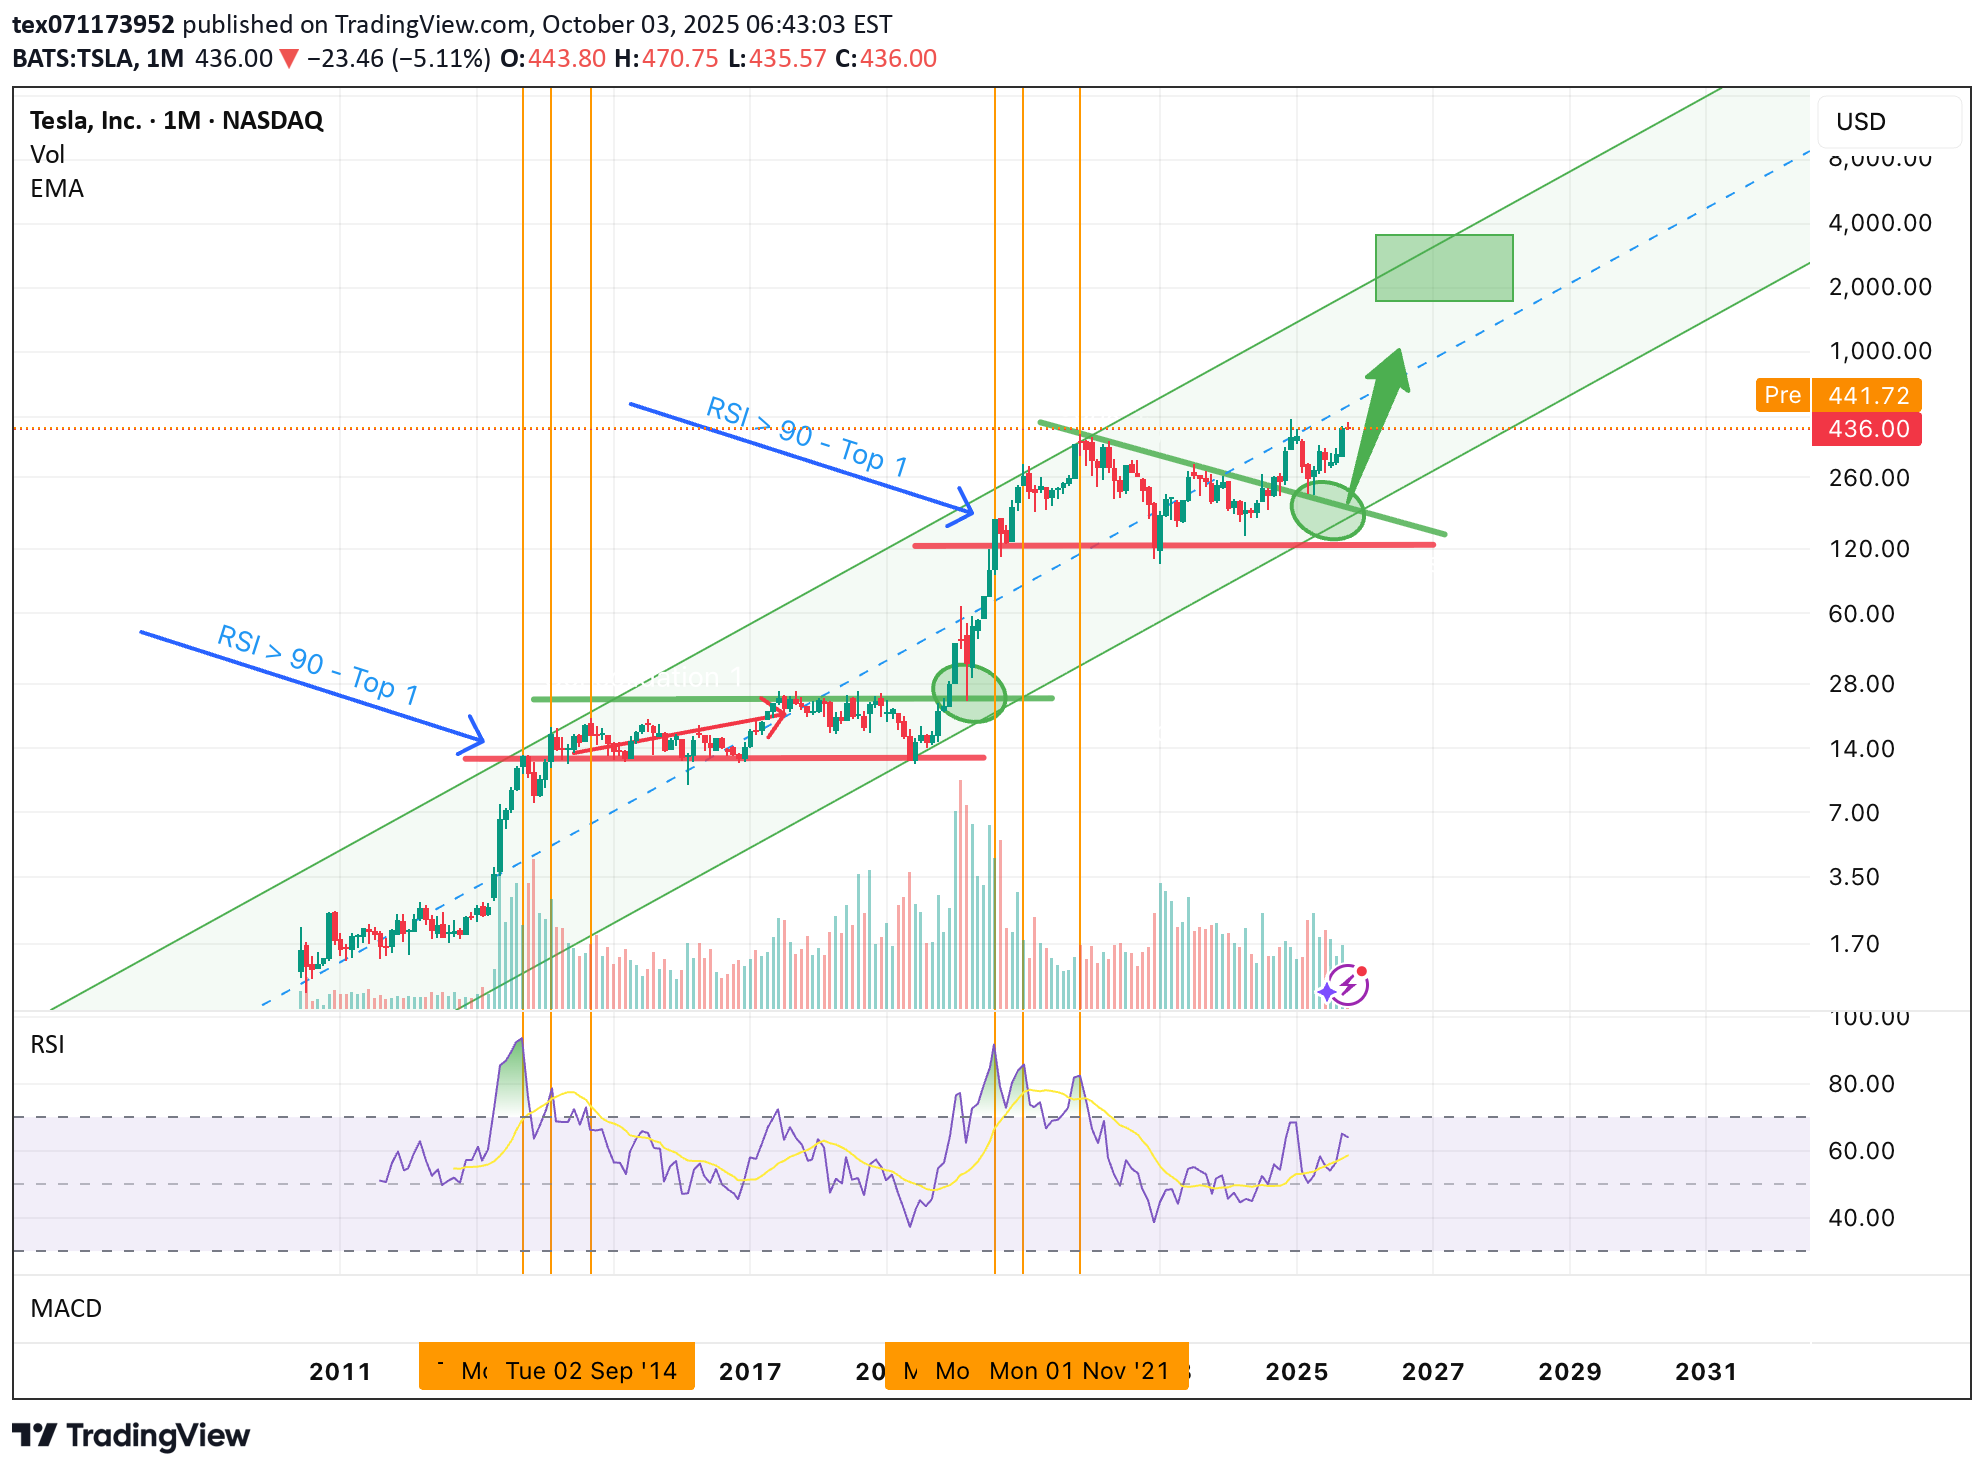
Teknik Görünüm: Trend sağlam. Momentum yapıcı. Döngü hala olgunlaşıyor. RSI yol haritası story 'ın bitmekten uzak olduğunu ve en patlayıcı aşamanın hala önde olabileceğini gösteriyor. Özet: Geri dönüş Nisan , 270 $-320 $ 'lık bölgeyi belirleyici bir uzun vadeli destek bölgesi olarak tanımladık-0.382-0.5 Fibonacci geri çekilme seviyelerinin bir birleşimi ve Tesla’nın on yıl süren yükselen kanalının alt sınırı. Bu analiz mükemmel bir şekilde oynandı: TSLA bu bölgeyi yeniden test etti, sağlam bir taban inşa etti ve yükseliş trende devam etti. Bugün, hisse senedi işlemi 430 doların üzerinde ve ilerliyor kanal medyanı - Zaten bir sonraki direnç bölgesinin yakınında 480-500 dolar - en güçlü sinyal geliyor ivme fiyat yerine. Aylık RSI bize çok önemli bir şey anlatıyor: Bir bisiklet tepesine yakın değiliz. Aslında, tarihsel kalıplar Tesla'nın girdiğini göstermektedir. Yeni bir çok yıllı boğa döngüsünün genişleme aşaması , çok daha yüksek fiyatlarla hala önde. RSI ve Piyasa Döngüleri: Tarih bize ne anlatıyor Tesla’nın önceki iki major boğa piyasası - 2013-2014 Ve 2019-2021 - Dışarı çıkmadan önce oldukça benzer bir senaryo izledi: . ilk öforik zirve her döngüden çakıştı 90'ın üzerinde aylık RSI , kanalın ortasında değil, fiyat ve biraz yukarı doğru ittikçe - Üst sınır. Bu ilk RSI> 90 etkinliğinden sonra, hisse senedi yayınlandı İki Yüksek Yüksek ile Alt RSI zirveleri , Momentum tükenmesinin ders kitabı işareti (düşüş sapması). Her seferinde sonuç: keskin bir düzeltme % 45-75 . Bugün RSI yakın oturuyor 56 - Aşırı devreye yakın bir yere yakın. Bu, Tesla'nın hala orta döngü genişleme aşamasında olduğu anlamına gelir-tarihsel olarak sürekli kurumsal birikim, hızlandırma fiyat kazançları ve çoklu genişleme ile ilişkili bir faz. Daha da önemlisi, tarih tekrarlanırsa, RSI> 90, fiyat üst sınıra ulaşana veya üzerinde biraz kırılana kadar gerçekleşmez . Mevcut kanal geometrisine dayanarak, bu, 1.200 $ - 1.600 $ Menzil - Hisse senetlerinin bugün işlemlerinin çok üstünde. Tahminim ve ticaret fikrim Tesla'nın şimdi ikinci aşama yeni bir çok yıllı boğa döngüsünün, muhtemelen 18-30 ay . Teknik kurulum - fiyat yapısı, kanal dinamiği ve RSI davranışı - hepsi tersine devam ediyor. Temel kasa yol haritam: Yakın vadede: Tesla önümüzdeki aylarda 480-500 dolarlık direnç alanına (kanalın üst yarısına) yaklaşıyor. Orta Vadeli: 500 doların üzerindeki bir kırılma, sürekli bir genişleme ayağını 650 $-700 $ 'a doğru tetikleyebilir. Geç Döngü: Momentum Peaks ve RSI 90'a yaklaştıkça, fiyat 1,200-1,600 dolarlık bölgeye doğru ilerleyebilir-tarihsel olarak öforik üstlerle ilişkili alan. Uzun vadeli yatırımcılar ve salıncak tüccarları için mevcut risk-ödül profili zorlayıcı olmaya devam ediyor. Tesla 320 dolarlık birikim bölgesinin üzerinde olduğu sürece, en az direnç yolu daha yüksek kalır. Kar hedefleri ve durdurma kaybı İlk hedef : 480 $ - 500 $ (kanalın üst yarısı) İkinci hedef : 650 $-700 $ (Orta Döngü Breakout uzantısı) Üçüncü hedef : 1.200 $ - 1.600 $ (Tarihsel RSI> 90 / Euphoric Top Bölgesi) Durdurma Stratejisi: Aşağıda sürekli bir aylık kapanış 320 $ orta döngü tezini geçersiz kılar ve daha derin bir düzeltici yapı önerir. Tüccarlar için bu teknik “sand 'daki çizgi” olmaya devam ediyor. Dikkate Alınması Riskler Teknik zemin boğa olsa da, birkaç risk bu teze meydan okuyabilir: Makro Vardiyalar : Daha yüksek oranlar veya küresel durgunluk büyüme katlarını sıkıştırabilir. İnfaz riski : Özerklik, robotik veya enerji işindeki gecikmeler yatırımcı coşkusunu azaltabilir. Değerleme baskısı : Tesla’nın premium değerlemesi onu büyüme beklentilerindeki değişikliklere duyarlı hale getiriyor. Momentum sinyalleri : RSI, bir sonraki bacak daha yüksek sırasında önemli ölçüde ilerleyemezse, iç zayıflığa ve beklenenden daha erken bir döngü zirvesine işaret edebilir. Çözüm Tesla’nın uzun vadeli yükseliş treni sağlam kalır, kilit destek tutulmuştur ve momentum göstergeleri, güçlü bir yeni boğa döngüsünde hala erken olduğumuzu gösteriyor. Tarihsel RSI davranışı, RSI'nin 90'ı aştığı ve gerçek bir döngü tepesinin form başlamış olduğu ilk öforik fazın - çok daha yüksek seviyeler , büyük ihtimalle 1.200 $ - 1.600 $ . O zamana kadar, fiyat eylemi, yapısı ve momentum tüm takdire işaret ediyor. Destek 320 doların üzerinde olduğu sürece, temel senaryo açıktır: Tesla’nın bir sonraki major move daha yüksek - ve pazar hala bu boğa döngüsünün ilk bölümlerini yazıyor .
tex071173952

Hello traders! Let’s dive into a long-term analysis of Tesla (TSLA) on the monthly chart to understand where the stock might be headed next. I’ll walk you through my thought process, focusing on a comparison between the recent correction and a similar setup in 2020, while also analyzing the current correction’s alignment with the triangle formation from the 2021–2024 consolidation. My goal is to help you see the context of this setup and make an informed decision if you’re considering a trade. Step 1: Understanding the Big Picture and Historical Context Tesla has been in a strong uptrend since 2013, as evidenced by the ascending channel (highlighted in blue). This channel has guided the stock’s long-term trajectory, with the lower trendline providing support during pullbacks and the upper trendline acting as resistance during peaks. Within this uptrend, Tesla has experienced significant breakouts followed by corrections, and I’ve identified a compelling similarity between the current price action and a setup from 2020, alongside a key technical level from the recent consolidation. Step 2: Comparing the Recent Correction to 2020 In 2020, Tesla consolidated in a range between $12 and $24 (labeled "Consolidation 1" on the chart). It then broke out, rallying to a high of $64.60—a gain of about 169% from the upper end of the consolidation range. Following this breakout, Tesla experienced a sharp pullback, dropping to $23.37, which represents a 63.8% correction from the $64.60 high. After finding support at this level, Tesla resumed its upward trajectory, soaring to $166.71—a 613% increase from the pullback low. Now, let’s look at the current situation: Tesla broke out of "Consolidation 2" (around 2021–2024), rallying from $212.11 to a high of $488.54—a 130% increase. It has since corrected by 51%, dropping to the current price of $239.43. This 51% pullback is slightly less severe than the 63.8% correction in 2020, but the structure is similar: both followed significant breakouts from consolidation zones. Step 3: Current Price Action and the Triangle Retest Tesla is currently trading at $239.43, down 55% from its recent high of $488.54. If the correction deepens to around 60%, it would bring the price to approximately $195.42 (calculated as $488.54 × (1 - 0.60) = $195.42), which aligns perfectly with the upper trendline of the triangle formation from "Consolidation 2" and the "Retest support?" zone around $170–$200. This confluence suggests that the current correction could be setting the stage for a significant bounce, just as the 2020 correction did. If this $170–$200 level fails to hold, I’m watching for a deeper pullback to the "Retest support" zone around $138–$150, which aligns with the lower trendline of the ascending channel and has acted as support during previous pullbacks (e.g., in 2023). Step 4: My Prediction and Trade Idea Here’s where I put myself in your shoes: if I were trading Tesla, I’d be watching for a retest of the $170–$200 support zone as a potential buying opportunity, drawing from both the 2020 playbook and the current technical setup. Why? In 2020, Tesla found support at $23.37 after a 63.8% correction, which set the stage for a 613% rally to $166.71. Similarly, a 60% correction now would bring Tesla to the upper trendline of the Consolidation 2 triangle at $170–$200, a level that could act as a springboard for the next leg up. If Tesla holds this support, I expect a move back toward the $300–$339 range, where it faced resistance before the recent drop. A break above $339 could signal a continuation toward $488.54, retesting the recent high. Profit Targets and Stop Loss Entry: Consider buying around $170–$200 if the price retests this support and shows signs of reversal (e.g., a bullish candlestick pattern or increased volume). Profit Target 1: $300 (a conservative target based on recent resistance). Profit Target 2: $339 (a more aggressive target at the prior resistance zone). Stop Loss: Place a stop below $160 to protect against a breakdown of the $170–$200 support zone. This gives the trade a risk-reward ratio of up to 13:1 for the first target. Risks to Consider If Tesla fails to hold the $170–$200 support, we could see a deeper correction toward $138–$150, and potentially even $64–$90, another historical support level. Additionally, keep an eye on broader market conditions, as Tesla is sensitive to macroeconomic factors like interest rates and consumer sentiment in the EV sector. While the 2020 setup and the triangle retest provide a historical and technical parallel, the current 55% drop suggests heightened volatility, so be prepared for potential whipsaws around these key levels. Conclusion Tesla’s recent 55% correction from $488.54 to $239.43 echoes the 63.8% pullback in 2020 after the breakout from "Consolidation 1." If the correction deepens to 60%, it would retest the upper trendline of the Consolidation 2 triangle at $170–$200, suggesting a potential opportunity for a high-probability trade with clear profit targets and a defined stop loss. This setup could mirror the 2020 recovery, where Tesla rallied 613% after finding support. What do you think of this setup? Let me know in the comments—I’d love to hear your thoughts!
Sorumluluk Reddi
Sahmeto'nun web sitesinde ve resmi iletişim kanallarında yer alan herhangi bir içerik ve materyal, kişisel görüşlerin ve analizlerin bir derlemesidir ve bağlayıcı değildir. Borsa ve kripto para piyasasına alım, satım, giriş veya çıkış için herhangi bir tavsiye oluşturmazlar. Ayrıca, web sitesinde ve kanallarda yer alan tüm haberler ve analizler, yalnızca resmi ve gayri resmi yerli ve yabancı kaynaklardan yeniden yayınlanan bilgilerdir ve söz konusu içeriğin kullanıcılarının materyallerin orijinalliğini ve doğruluğunu takip etmekten ve sağlamaktan sorumlu olduğu açıktır. Bu nedenle, sorumluluk reddedilirken, sermaye piyasası ve kripto para piyasasındaki herhangi bir karar verme, eylem ve olası kar ve zarar sorumluluğunun yatırımcıya ait olduğu beyan edilir.