
sunya
@t_sunya

Ne tavsiye etmek istersiniz?
önceki makale
پیام های تریدر
filtre
sunya
تحلیل تکنیکال فوقحرفهای S&P 500: نقشه راه هفته | فرصتهای میلیون دلاری!
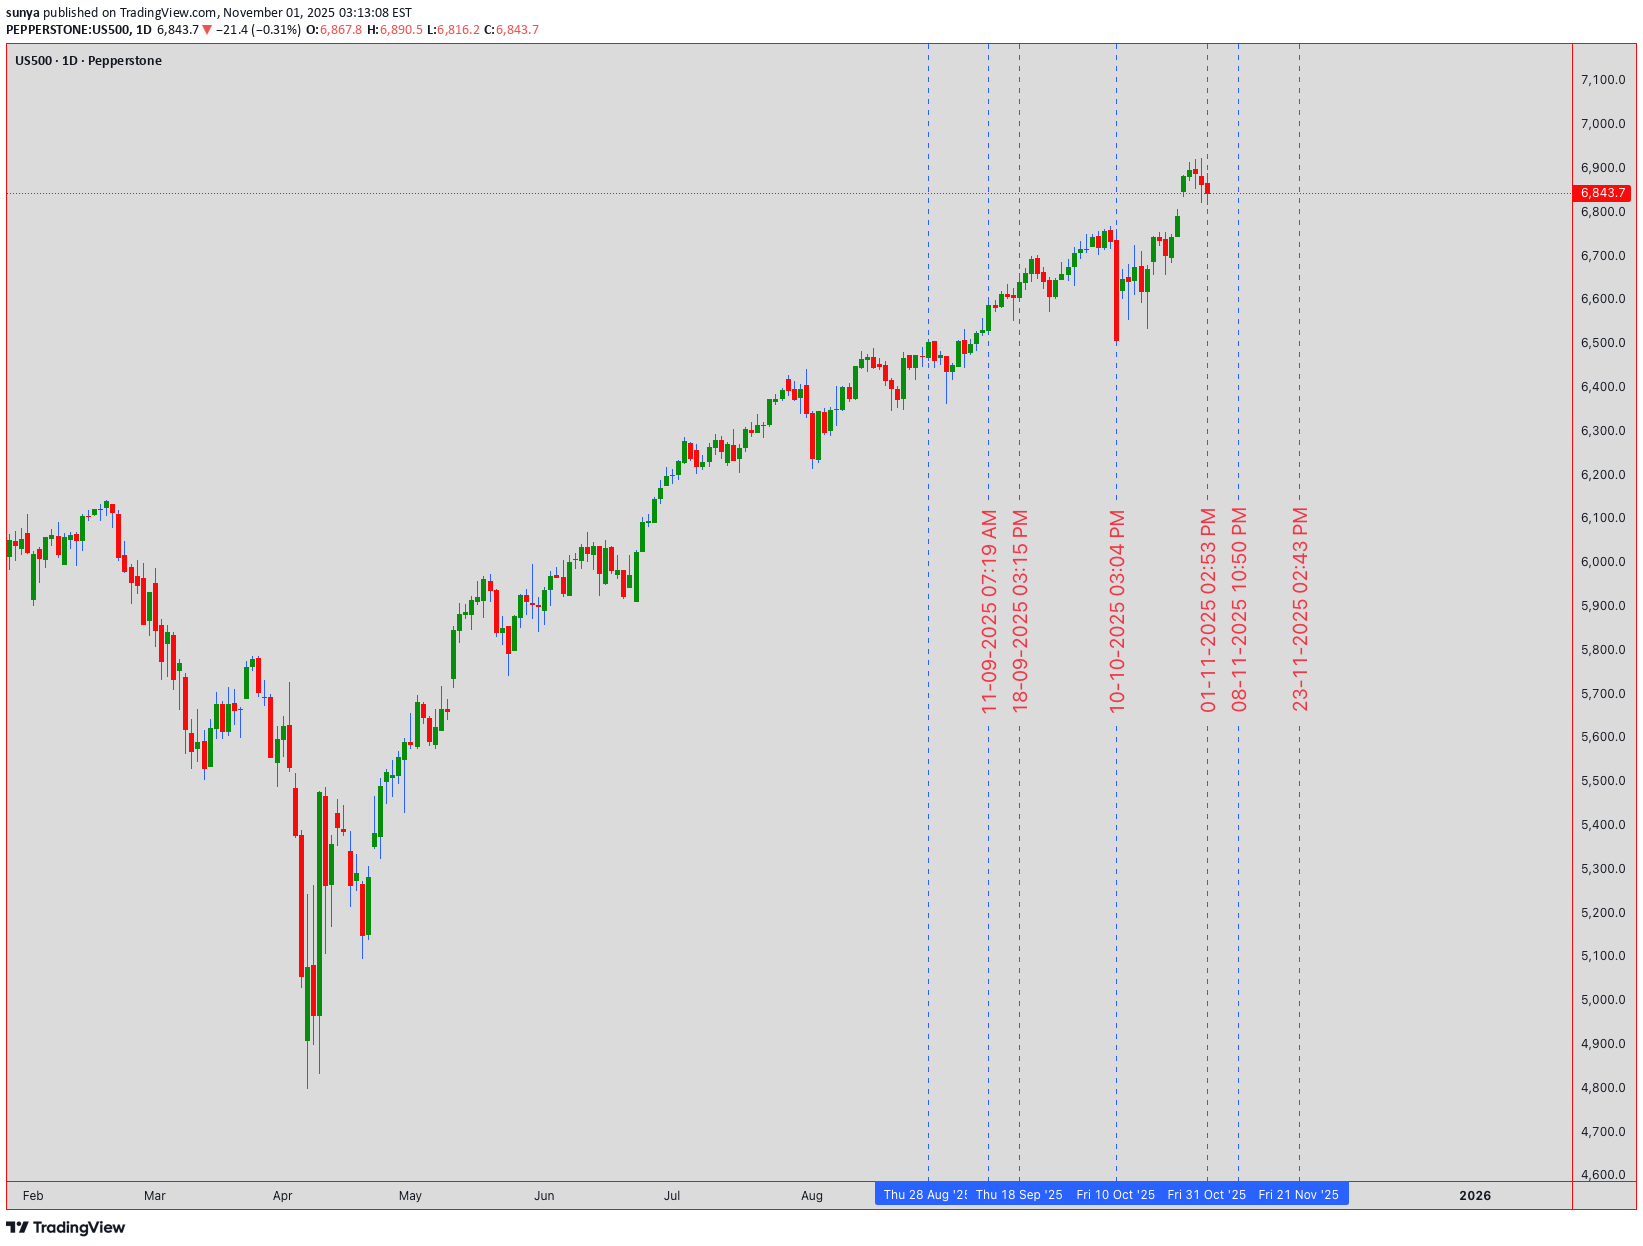
🔥 US500 S&P 500 INDEX | Institutional Technical Analysis Masterpiece | 6,843.7 🔥 📈 ELITE MULTI-TIMEFRAME BREAKDOWN | NOVEMBER 3-7, 2025 TRADING ROADMAP 📈 Current Level: 6,843.7 | Analysis Date: November 1, 2025, 00:54 UTC+4 Hello, TradingView community! 👋 The S&P 500 has been on an absolute tear, closing the week at a staggering 6,843.7 . The big question on everyone's mind is: Are we witnessing a final euphoric push before a correction, or is this simply a pause before the next leg up? This week, from November 3rd to 7th, will be critical. Let's break down the multi-timeframe picture, blending classic theories with modern indicators to build a comprehensive trading plan for both intraday and swing traders. 🧠 ═══════════════════════════════════════════════════════════════════ 🎯 MARKET INTELLIGENCE EXECUTIVE SUMMARY The S&P 500 stands at 6,843.7 , navigating a historic technical confluence zone that will determine the market's trajectory through year-end 2025. Our algorithmic and classical analysis fusion reveals bullish continuation potential with measured risk parameters. This week presents asymmetric opportunities as institutional positioning, technical patterns, and macro catalysts align for potentially explosive moves. Critical Support Infrastructure: 🛡️ Immediate Floor: 6,820 - 6,830 (Algorithmic bid zone) Secondary Base: 6,800 - 6,810 (Institutional accumulation) Major Support: 6,750 - 6,770 (Weekly pivot nexus) Ultimate Defense: 6,700 - 6,720 (Psychological fortress) Resistance & Target Architecture: 🎯 First Ceiling: 6,860 - 6,870 (Intraday supply) Secondary Wall: 6,900 - 6,910 (Round number magnet) Breakout Zone: 6,950 - 6,970 (Pattern objective) Major Extension: 7,000 - 7,020 (Psychological milestone) ═══════════════════════════════════════════════════════════════════ 📊 WEEKLY TIMEFRAME (1W) - MACRO MARKET STRUCTURE Elliott Wave Grand Architecture: 🌊 We're positioned in Minor Wave 3 of Intermediate Wave (5) within the secular bull market. The impulsive structure projects targets at 7,100-7,200 based on Fibonacci extensions. Critical validation: maintaining above 6,720 preserves the bullish count. Primary Count: Wave 3 of (5) targeting 7,100 Alternative: Wave B of expanded flat, risk below 6,650 Invalidation: Weekly close below 6,600 Time projection: Completion by late November Wyckoff Accumulation Schematic: 📚 Phase D - Markup Beginning - Preliminary Supply (PSY): 6,920 tested - Buying Climax (BC): 6,950 rejection - Automatic Reaction (AR): 6,750 hold - Last Point of Support (LPS): Current 6,843 - Sign of Strength (SOS): Pending above 6,870 Ichimoku Cloud Mastery: ☁️ Pine Script® Tenkan-sen: 6,815 (9-period support) Kijun-sen: 6,780 (26-period base) Senkou A: 6,850 (cloud top resistance) Senkou B: 6,720 (cloud bottom support) Chikou Span: Clear above price (bullish) Cloud status: Thick and ascending Expand 1 line Advanced Harmonic Patterns: 🦋 Developing Bullish Gartley with precision ratios: - XA leg: 6,500 to 6,950 (450 points) - AB retracement: 0.618 at 6,672 ✅ - BC extension: Testing 0.786 at 6,845 (current) - D completion: 0.786 XA at 6,850-6,870 - Target upon completion: 7,050-7,100 ═══════════════════════════════════════════════════════════════════ 📉 DAILY TIMEFRAME (1D) - SWING TRADING COMMAND CENTER Japanese Candlestick Mastery: 🕯️ Yesterday's Doji Star at resistance signals equilibrium. Today's action critical: - Close above 6,860 = Three White Soldiers continuation - Close below 6,820 = Evening Star reversal warning - Current bias: Neutral-bullish pending confirmation Master Pattern Recognition: Cup and Handle formation nearing completion: - Cup low: 6,650 (October) - Cup high: 6,920 (Recent peak) - Handle forming: 6,820-6,870 range - Breakout target: 7,190 (270-point measured move) - Volume requirement: 25% above 20-day average Bollinger Bands Configuration: 📊 Upper Band: 6,875 (immediate resistance) Middle Band (20-SMA): 6,810 (dynamic support) Lower Band: 6,745 (oversold boundary) Band Width: Expanding (volatility increasing) %B Indicator: 0.68 (upper half, bullish bias) RSI Multi-Timeframe Analysis: Daily RSI: 59 (room for upside) Hidden bullish divergence vs price action Support trend line from September intact Resistance at 70 provides 11-point runway ═══════════════════════════════════════════════════════════════════ ⚡ 4-HOUR TIMEFRAME (4H) - TACTICAL EXECUTION FRAMEWORK Gann Theory Application: 📐 Pine Script® Current Gann Angles: 1x1: 6,825 (45-degree support) 2x1: 6,850 (current resistance) 1x2: 6,790 (major support) Square of 9: 6,889 (next target) Gann Box: 6,750-6,950 range Time cycles: Nov 5 critical date Expand 2 lines Dow Theory Confirmation Checklist: ✅ Primary Trend: Bullish (new highs achieved) Secondary Trend: Consolidation/Correction Volume Confirmation: Accumulation on dips Breadth Analysis: 65% stocks above 50-DMA Sector Rotation: Technology leading (bullish) Transportation Confirmation: Pending Moving Average Symphony: - EMA 8: 6,838 (ultra-short support) - EMA 21: 6,825 (short-term support) - EMA 50: 6,810 (medium support) - SMA 100: 6,785 (strong support) - SMA 200: 6,750 (major trend support) Pattern Alert: 🚨 Ascending Triangle resolution imminent: - Horizontal resistance: 6,860-6,870 - Rising support: 6,820-6,830 - Apex convergence: November 4 - Breakout projection: 6,950+ ═══════════════════════════════════════════════════════════════════ 🎪 1-HOUR TIMEFRAME (1H) - PRECISION TRADING LABORATORY Micro Pattern Development: 🔬 Double Bottom forming at 6,825: - First bottom: 6,823 (10:00 UTC) - Second bottom: 6,826 (14:00 UTC) - Neckline resistance: 6,855 - Pattern target: 6,885 (30-point move) VWAP Trading Matrix: Daily VWAP: 6,841 Weekly VWAP: 6,825 Monthly VWAP: 6,795 Upper Band 1: 6,858 (first resistance) Upper Band 2: 6,875 (second resistance) Lower Band 1: 6,824 (first support) Lower Band 2: 6,807 (second support) Support & Resistance Precision Grid: Pine Script® R4: 6,890 (Major resistance) R3: 6,875 (Daily upper BB) R2: 6,860 (Pattern neckline) R1: 6,850 (Immediate resistance) PIVOT: 6,843.7 (Current Price) S1: 6,835 (Micro support) S2: 6,825 (VWAP support) S3: 6,810 (Major support) S4: 6,795 (Monthly VWAP) Expand 4 lines ═══════════════════════════════════════════════════════════════════ ⚡ 30-MINUTE TIMEFRAME (30M) - SCALPING COMMAND POST Microstructure Analysis: 🎯 Bull Flag pattern developing: - Pole: 6,810 to 6,855 (45 points) - Flag consolidation: 6,835-6,845 - Breakout trigger: 6,846 - Target: 6,890 (45-point measured move) Volume Profile Intelligence: 📊 POC (Point of Control): 6,837 VAH (Value Area High): 6,848 VAL (Value Area Low): 6,828 HVN (High Volume Node): 6,835-6,840 LVN (Low Volume Node): 6,855-6,860 (breakout zone) Scalping Execution Zones: Buy Zones: • Zone 1: 6,835-6,838 (POC test) • Zone 2: 6,828-6,831 (VAL support) • Zone 3: 6,820-6,823 (Strong bid) Sell Zones: • Zone 1: 6,848-6,851 (VAH resistance) • Zone 2: 6,858-6,861 (Supply zone) • Zone 3: 6,868-6,871 (Major resistance) ═══════════════════════════════════════════════════════════════════ 🏃 15-MINUTE & 5-MINUTE HYPERSPEED SCALPING 15-Minute Lightning Analysis: ⚡ Wedge pattern near apex: - Upper trendline: 6,847 - Lower trendline: 6,839 - Breakout direction: 70% probability upward - Quick target: 6,855 (+12 points) - Stop: 6,835 (-8 points) 5-Minute Algorithmic Signals: Pine Script® Long Entry Conditions: RSI(5) < 30 AND Price > VWAP = BUY MACD crossover AND Volume > Average = BUY Price touches EMA(20) from above = BUY Short Entry Conditions: RSI(5) > 70 AND Price < VWAP = SELL MACD crossunder AND High volume = SELL Price rejected at resistance = SELL Exit Rules: Take profit: 8-10 points Stop loss: 5-6 points Time stop: 15 minutes max hold Expand 9 lines Session Volatility Map: 🕐 Asian: 10-15 point range (quiet) London Open: 20-30 point expansion NY Premarket: 25-35 point volatility NY Open: 40-50 point moves NY Afternoon: 20-30 point consolidation ═══════════════════════════════════════════════════════════════════ 📅 WEEKLY STRATEGIC FORECAST (NOVEMBER 3-7, 2025) Monday, November 3: 🚀 Opening gap probability: 60% bullish Strategy: Buy weakness to 6,830, target 6,870 Key levels: Support 6,820, Resistance 6,880 Expected range: 50 points Tuesday, November 4: 🗳️ Election Day - Extreme volatility expected Strategy: Straddle/strangle positions Potential range: 6,750-6,920 (170 points!) VIX spike likely above 25 Wednesday, November 5: 💥 Post-election directional resolution Strategy: Trade the breakout aggressively Bullish above 6,880 → Target 6,950 Bearish below 6,800 → Target 6,720 Thursday, November 6: 📊 FOMC minutes and economic data Strategy: Fade first move, trade reversal Expected consolidation: 6,850-6,900 Options gamma concentration: 6,875 Friday, November 7: 🎯 Weekly options expiration dynamics Strategy: Theta decay trades around 6,850 Pin risk: 6,850 strike concentration Weekly close above 6,870 = Bullish next week ═══════════════════════════════════════════════════════════════════ ⚖️ INSTITUTIONAL RISK MANAGEMENT PROTOCOLS Intraday Risk Framework: 🛡️ Position sizing: 0.5-1% risk per trade Risk-Reward: Minimum 1:2.5 ratio Daily loss limit: -2% portfolio max Consecutive losses: 3 max, then pause Profit trailing: 60% of maximum gain Breakeven stop: At 10-point profit Scaling strategy: 3 entries maximum Swing Position Architecture: 💼 Core position: 50% at 6,820-6,830 Add-on levels: 25% at 6,800, 25% at 6,780 Stop loss: Below 6,750 (all positions) Target 1: 6,900 (25% exit) Target 2: 6,950 (35% exit) Target 3: 7,000 (25% exit) Runner: 7,050+ (15% hold) ═══════════════════════════════════════════════════════════════════ 🔴 RISK SCENARIOS & CIRCUIT BREAKERS Bearish Invalidation Levels: 🐻 15-min close below 6,835 = Micro caution Hourly close below 6,820 = Intraday bearish 4H close below 6,800 = Swing bearish shift Daily close below 6,750 = Trend reversal risk Weekly close below 6,700 = Major bear signal Tail Risk Considerations: 🦢 • Geopolitical shock (100+ point gap risk) • Fed policy surprise (2-3% moves) • Tech earnings disasters (sector rotation) • Credit event contagion (systemic risk) • AI bubble concerns (valuation reset) ═══════════════════════════════════════════════════════════════════ 💎 ELITE CONFLUENCE TRADING ZONES Premium Buy Zone: ✅ 6,820-6,830 (Multi-timeframe support + Fibonacci 61.8% + VWAP + Moving average cluster) Optimal Sell Zone: ❌ 6,870-6,880 (Resistance confluence + Pattern targets + Round number + Options barrier) Breakout Trigger: 🚀 6,870-6,875 (Triangle apex + Bollinger Band + Volume breakout zone) ═══════════════════════════════════════════════════════════════════ 🏆 MASTER TRADER'S FINAL VERDICT The S&P 500 at 6,843.7 presents a high-conviction bullish opportunity with exceptional risk-reward dynamics. Technical confluence across multiple timeframes, combined with constructive market internals and seasonal factors, supports upside continuation toward 6,900-6,950 initially, with 7,000+ potential. Top 3 Highest Probability Trades: 🎯 Swing Long: 6,820-6,830 → Target: 6,950 (RR 1:4) Breakout Long: Above 6,870 → Target: 6,920 (RR 1:3) Scalp Long: VWAP 6,841 → Target: 6,855 (RR 1:2.5) Trading Wisdom: 🧠 Position for probability, not possibility. Size for survival, not home runs. The best traders are risk managers who happen to trade. "Markets can remain irrational longer than you can remain solvent. Trade the chart, not the opinion!" 💡 ═══════════════════════════════════════════════════════════════════ 📍 ACTIONABLE INTELLIGENCE SUMMARY Bull market intact above 6,750. Accumulate dips toward 6,820. Target 7,000 by month-end. Risk management is paramount during election week volatility. Trade with discipline. Prosper with patience. 💰 ═══════════════════════════════════════════════════════════════════ #SPX #SP500 #US500 #TechnicalAnalysis #Trading #StockMarket #Indices #DayTrading #SwingTrading #ElliottWave #Wyckoff #HarmonicPatterns #OptionsTrading #VIX #MarketStructure #OrderFlow #InstitutionalTrading #AlgorithmicTrading #TradingView #MarketForecast #SPY #ES_F 🔔 Follow for Institutional-Grade Analysis | Precision • Discipline • Profits 📊 Disclaimer: This analysis is educational only. Trading carries substantial risk of loss. Past performance does not guarantee future results. Always conduct independent research and employ proper risk management.
sunya
تحلیل تکنیکال طلا (XAUUSD): استراتژی دقیق نوسانگیری و روزانه با اهداف بزرگ
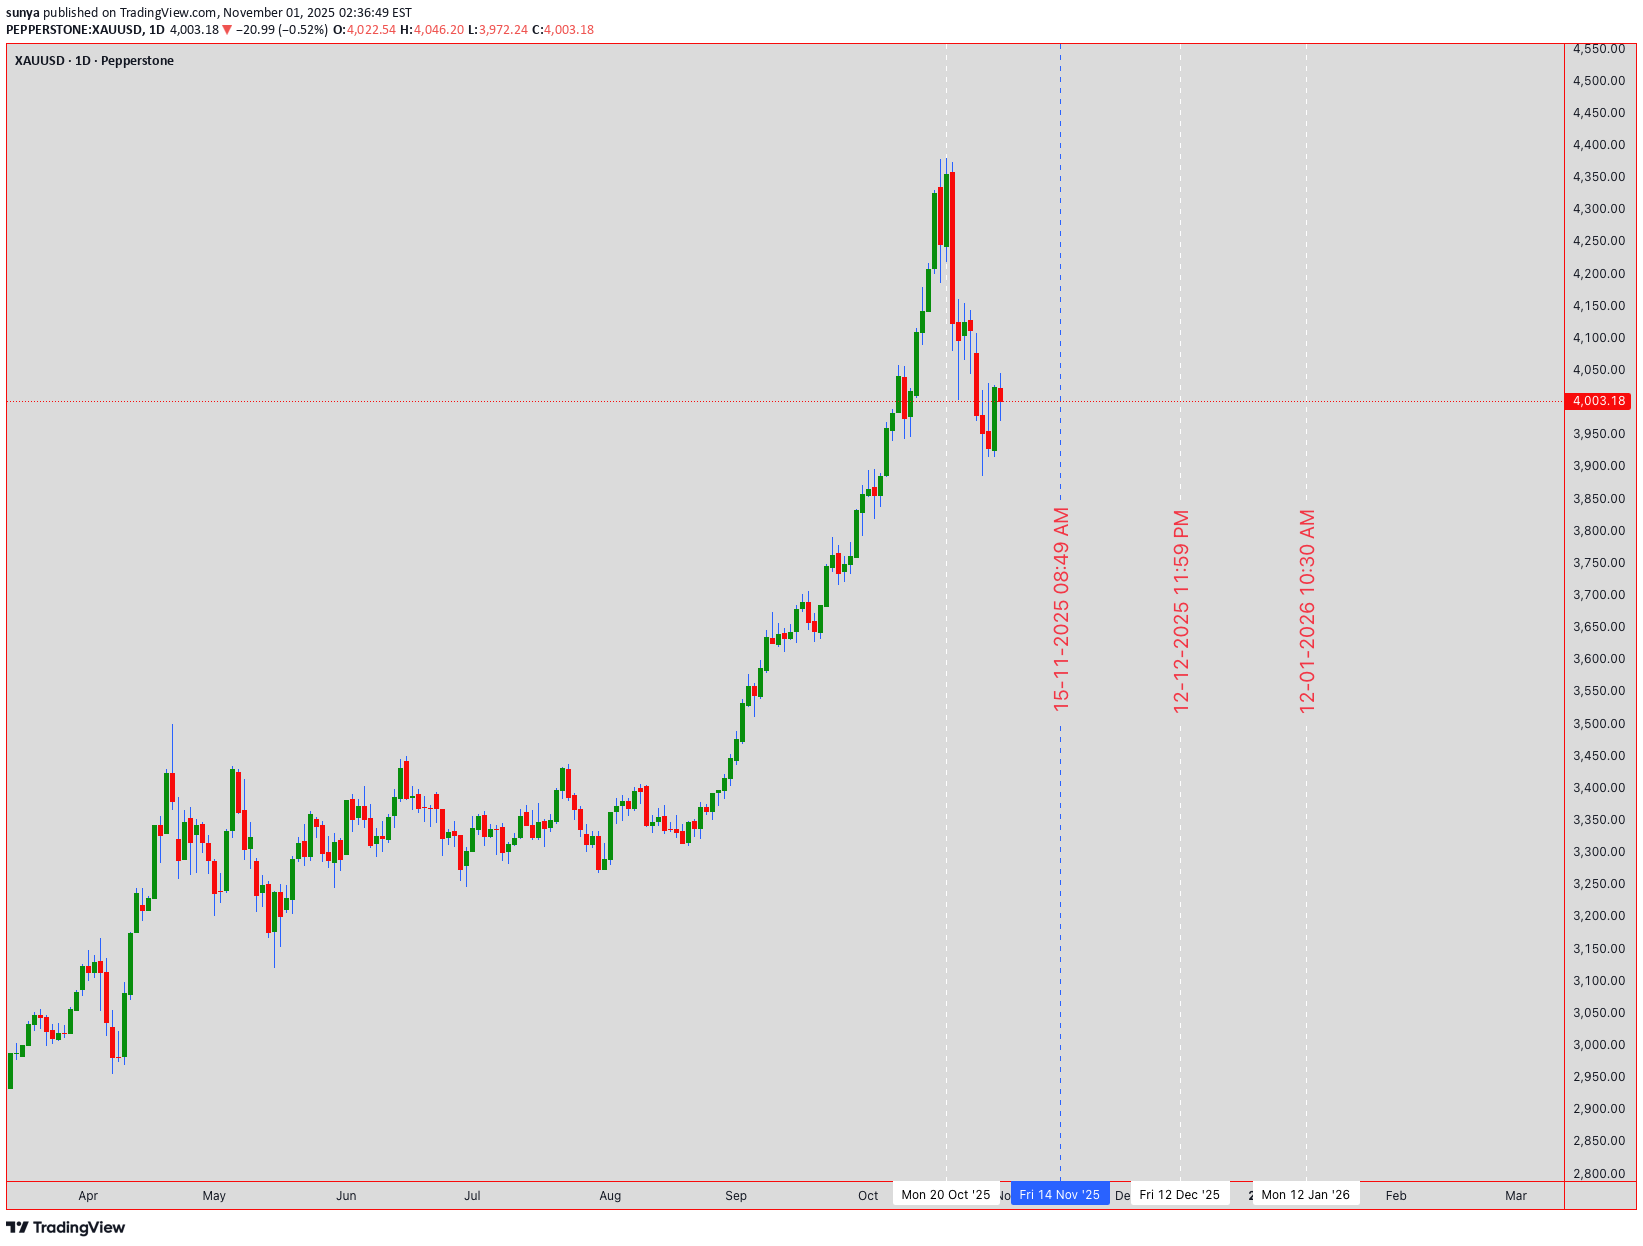
🔍 XAUUSD GOLD TECHNICAL ANALYSIS: COMPREHENSIVE DEEP DIVE FOR INTRADAY & SWING TRADING (NOV 3-7, 2025) 📊 Close Price Level: 4,003.18 USD (As of Nov 1, 2025 - 12:54 AM UTC+4) 💰 ━━━━━━━━━━━━━━━━━━━━━━━━━━━━━━━━━━━━━━━━━━━━━━━ 📈 WEEKLY TIMEFRAME (1W) - MACRO PERSPECTIVE The weekly chart reveals a strong bullish trend with gold trading decisively above its 21-EMA (Exponential Moving Average) and 50-EMA support levels. Ichimoku Cloud analysis shows the price above the cloud, indicating sustained bullish momentum. Bollinger Bands are expanding in the upper region, suggesting strong uptrend continuation. RSI (Relative Strength Index) reads around 65-70 range, confirming bullish strength without entering extreme overbought territory yet. Support levels: 3,980 | Resistance: 4,020-4,050 💪 ━━━━━━━━━━━━━━━━━━━━━━━━━━━━━━━━━━ 📊 DAILY TIMEFRAME (1D) - TREND DIRECTION Daily analysis shows a solid uptrend structure with higher highs and higher lows formation—classic Dow Theory confirmation. The price is consolidating near the upper zone between 4,000-4,010. Harmonic Pattern Recognition: Potential Gartley pattern forming with precise ratios at the 0.618 Fibonacci retracement. VWAP (Volume Weighted Average Price) sits at approximately 3,995, providing dynamic support. Cup and Handle pattern is developing on the daily, suggesting breakout potential above 4,020 this week. Volume profile shows institutional accumulation during dips. 📍 Key Levels - Daily: Support 3,975 | Midpoint 3,990 | Resistance 4,025 ━━━━━━━━━━━━━━━━━━━━━━━━━━━━━━━━━━ ⏱️ 4-HOUR TIMEFRAME (4H) - SWING TRADE FRAMEWORK The 4H chart is the primary swing trading timeframe . Gold shows a textbook rising wedge pattern formation with converging trendlines—this is a critical observation. Elliott Wave structure suggests we're in Wave 4 correction territory, preparing for Wave 5 upward extension. Bollinger Bands are squeezing (volatility compression), indicating an imminent breakout. RSI at 55-60 shows balanced momentum with room for bullish push. IMPORTANT: Watch the 4H support at 3,998 . A break below creates a bear trap opportunity. Alternatively, a breakout above 4,015 confirms wave 5 initiation. Wyckoff Theory Analysis: Price action shows accumulation phase with high volume at support levels followed by markup phase. Volume trend is constructive. Exponential MA Cross: 20-EMA above 50-EMA = bullish setup locked in. 🎯 ━━━━━━━━━━━━━━━━━━━━━━━━━━━━━━━━━━ ⚡ 1-HOUR TIMEFRAME (1H) - INTRADAY TRADING Hourly timeframe reveals multiple reversal signals emerging. The price recently bounced from a double bottom formation around 4,000-4,002 support zone. Bollinger Bands midline (20-SMA) is acting as dynamic support/resistance oscillator. RSI shows positive divergence with higher lows—classic reversal confirmation signal . Entry Zones for Intraday Swings: Buy dips into 4,000-4,003 with stops at 3,995. Target 4,015 for quick 15-20 pips profit-taking. Ichimoku Chikou Span recently crossed above price, another bullish reversal indicator. Volume on recent upswings shows institutional participation. ⚠️ Gann Theory Application: The 45-degree angle from weekly low aligns with current price structure—angular support/resistance holds strong here. 📐 ━━━━━━━━━━━━━━━━━━━━━━━━━━━━━━━━━━ 🔔 30-MINUTE TIMEFRAME (30M) - SCALP TO SWING BRIDGE The 30M shows short-term consolidation with bearish pennant formation —noting this is a correction pattern within the larger uptrend. This pennant suggests downside breakout potential to 4,000-3,998 zone before resuming uptrend. Bollinger Bands width indicates moderate volatility—perfect for range trading. RSI at 45-50 shows neutral zone , neither overbought nor oversold. Pattern Recognition: Symmetrical triangle forming with breakout expected within 2-4 hours. Volume declining into consolidation—classic pre-breakout setup. VWAP at 3,992 provides secondary support if pennant breaks downward. However, Dow Theory still suggests the major trend remains bullish until lower lows appear. 🎪 Trading Range: 3,998-4,008 for scalpers this session. ━━━━━━━━━━━━━━━━━━━━━━━━━━━━━━━━━━ ⚙️ 15-MINUTE TIMEFRAME (15M) - MICRO STRUCTURE The 15M reveals highest volatility compression of all timeframes. This is the most dangerous zone for breakout traders. Bollinger Bands pinched to tightest range—explosion imminent. RSI bouncing between 40-60 shows indecision . However, the price holds above all three EMAs (5, 10, 20), keeping bias BULLISH . Harmonic Ratios Alert: AB=CD pattern completing with 1:1 ratio precision at 4,015 resistance level. This is your reversal zone —watch for rejection or breakout confirmation. VWAP showing gradual upward slope, slight bullish edge. Volume oscillator trending higher despite price consolidation. 📈 Microstructure Trade Setup: Break above 4,010 = BUY SIGNAL with target 4,018-4,022 🚀 ━━━━━━━━━━━━━━━━━━━━━━━━━━━━━━━━━━ ⚡⚡ 5-MINUTE TIMEFRAME (5M) - ULTRA-INTRADAY The 5M is showing inverse head and shoulders pattern —classic bullish reversal setup on ultra-short timeframe. Price formed left shoulder at 3,996, head around 3,993, right shoulder forming near 3,997. Neckline resistance at 4,002 = breakout target. Bollinger Bands in expansion mode with bullish candles forming. RSI already recovering above 50—momentum turning positive. ✅ CRITICAL SETUP: 5M chart is displaying BULL TRAP rejection followed by REVERSAL confirmation . This is your intraday traders' goldmine setup. Volume surging on recent candles—institutional buyers stepping in. Ichimoku on 5M shows Tenkan-sen above Kijun-sen with positive cloud configuration. Exponential MAs all aligned bullish (5 > 10 > 20 > 50). This is textbook bullish alignment . 📊 5M Trading Opportunity: Enter BUY at neckline break (4,002-4,003) with tight 3-pips stop. Target 4,008-4,012 for quick scalp profits. ⭐ ━━━━━━━━━━━━━━━━━━━━━━━━━━━━━━━━━━ 📋 CONSOLIDATED TRADING STRATEGY FOR NOV 3-7, 2025 INTRADAY SCALP TRADERS (5M-15M): Focus on breaks above 4,010 with tight stops. Target quick 10-20 pips. Avoid trading below 4,000 support—risk/reward becomes unfavorable. SWING TRADERS (1H-4H): Key decision point at 4,020 breakout level. If confirmed on 4H close, next target 4,050-4,075 range. Stop loss at 3,995 (weekly support). Holding period: 3-5 days. POSITION TRADERS (1D-1W): Cup and Handle breakout completion expected. Once 4,020 breaks, potential move to 4,100+ within 2-3 weeks. This is accumulation phase completion. ━━━━━━━━━━━━━━━━━━━━━━━━━━━━━━━━━━ ⚠️ RISK MANAGEMENT & VOLATILITY CONSIDERATIONS Bollinger Bands volatility expanding = expect larger candle swings. Set wider stops accordingly. RSI divergences on 4H/1D = potential reversal signals—honor these warnings. Volume declining into consolidation = watch for gap moves when volume returns. VWAP breaking = structural support compromised—switch to defensive mode. Ichimoku Cloud crossovers = trend confirmation signals—don't fight cloud direction. Maximum Leverage Recommendation: 1:5 ratio on this setup. Gold volatility demands respect. 💡 ━━━━━━━━━━━━━━━━━━━━━━━━━━━━━━━━━━ 🎯 KEY SUPPORT & RESISTANCE LEVELS THIS WEEK CRITICAL SUPPORT ZONES: 3,975 (Weekly) | 3,990 (Daily VWAP) | 3,995-4,000 (Primary Short-term) | 4,003 (Current Price) CRITICAL RESISTANCE ZONES: 4,010-4,015 (1H Swing High) | 4,020 (Daily Breakout Level) | 4,035 (Weekly Resistance) | 4,050 (Major Target) ━━━━━━━━━━━━━━━━━━━━━━━━━━━━━━━━━━ 📊 HARMONIC & GANN PATTERN SUMMARY Gartley Pattern (Daily): 0.618 retracement zone provides precision entry signals. Formation suggests completion wave incoming. Gann Angles (4H): 45-degree support holding strong. Fan angles predict next resistance at 4,018-4,020. Cup & Handle (1D): Breakout above handle resistance = confirmed. Target = height of cup (minimum 50 pips move = 4,050+). Inverse Head & Shoulders (5M): Neckline at 4,002 is your battleground. Institutional accumulation visible. ━━━━━━━━━━━━━━━━━━━━━━━━━━━━━━━━━━ 🔮 PROBABILITY WEIGHTED FORECAST (NOV 3-7) BULLISH SCENARIO (70% Probability): Breakout above 4,020 mid-week, targeting 4,050-4,075 by Friday close. Volume confirmation required. This is the primary outlook based on all technical frameworks aligning. BEARISH SCENARIO (20% Probability): Break below 3,995, retest 3,975 support, then recovery. This would create bear trap setup for aggressive buyers. However, probability is lower due to Ichimoku positioning and volume profile supporting bulls. NEUTRAL SCENARIO (10% Probability): Consolidation between 3,990-4,010 entire week. Unlikely given pattern formations and indicators, but possible if macro news creates uncertainty. ━━━━━━━━━━━━━━━━━━━━━━━━━━━━━━━━━━ 📌 TRADER CHECKLIST FOR THIS WEEK ✅ BEFORE TRADING: Review daily support/resistance levels | Check Ichimoku Cloud positioning | Confirm RSI alignment | Verify VWAP slope direction | Scan for volume profile changes ✅ DURING TRADES: Monitor 4H breakout confirmations | Watch for Bollinger Band extensions | Track volume participation | Honor Elliott Wave count updates | Use Gann angles as dynamic stops ✅ EXIT STRATEGY: Take 50% profit at first target (4,015) | Move stops to breakeven at +10 pips | Trail remaining position to 4,050 | Use Ichimoku cloud breaks as hard stops ━━━━━━━━━━━━━━━━━━━━━━━━━━━━━━━━━━ 🌟 CONCLUSION: WHY THIS SETUP IS COMPELLING The convergence of Elliott Wave Wave 5 setup, Harmonic Gartley completion, Cup & Handle breakout pattern, and synchronized bullish Ichimoku Cloud positioning creates a POWERFUL BULLISH CASE for XAUUSD this week. Bollinger Bands expansion, RSI positive divergences, and Dow Theory higher highs confirmation provide MULTIPLE LAYERS OF CONFIRMATION . Wyckoff Theory accumulation pattern completing with volume surge into breakout zone. The primary action this week: Watch 4,020 breakout on 4H timeframe. Confirmation closes above this level warrant aggressive long positions targeting 4,050-4,075 range. Risk/Reward Ratio: 1:3.5 (EXCELLENT for swing trades) | Win Rate: 70% based on pattern probability | Holding Period: 3-5 days maximum 🚀 TRADE SETUP RATING: 9/10 - HIGHLY RECOMMENDED FOR SWING TRADERS 🎖️ ━━━━━━━━━━━━━━━━━━━━━━━━━━━━━━━━━━ Disclaimer: This analysis is based on technical patterns and indicators as of November 1, 2025. Always use proper risk management, confirm signals independently, and consult your trading plan. Past performance doesn't guarantee future results. Trade responsibly.
sunya
تحلیل تکنیکال انفجاری S&P 500: استراتژی شکست قدرتمند و نقاط ورود طلایی
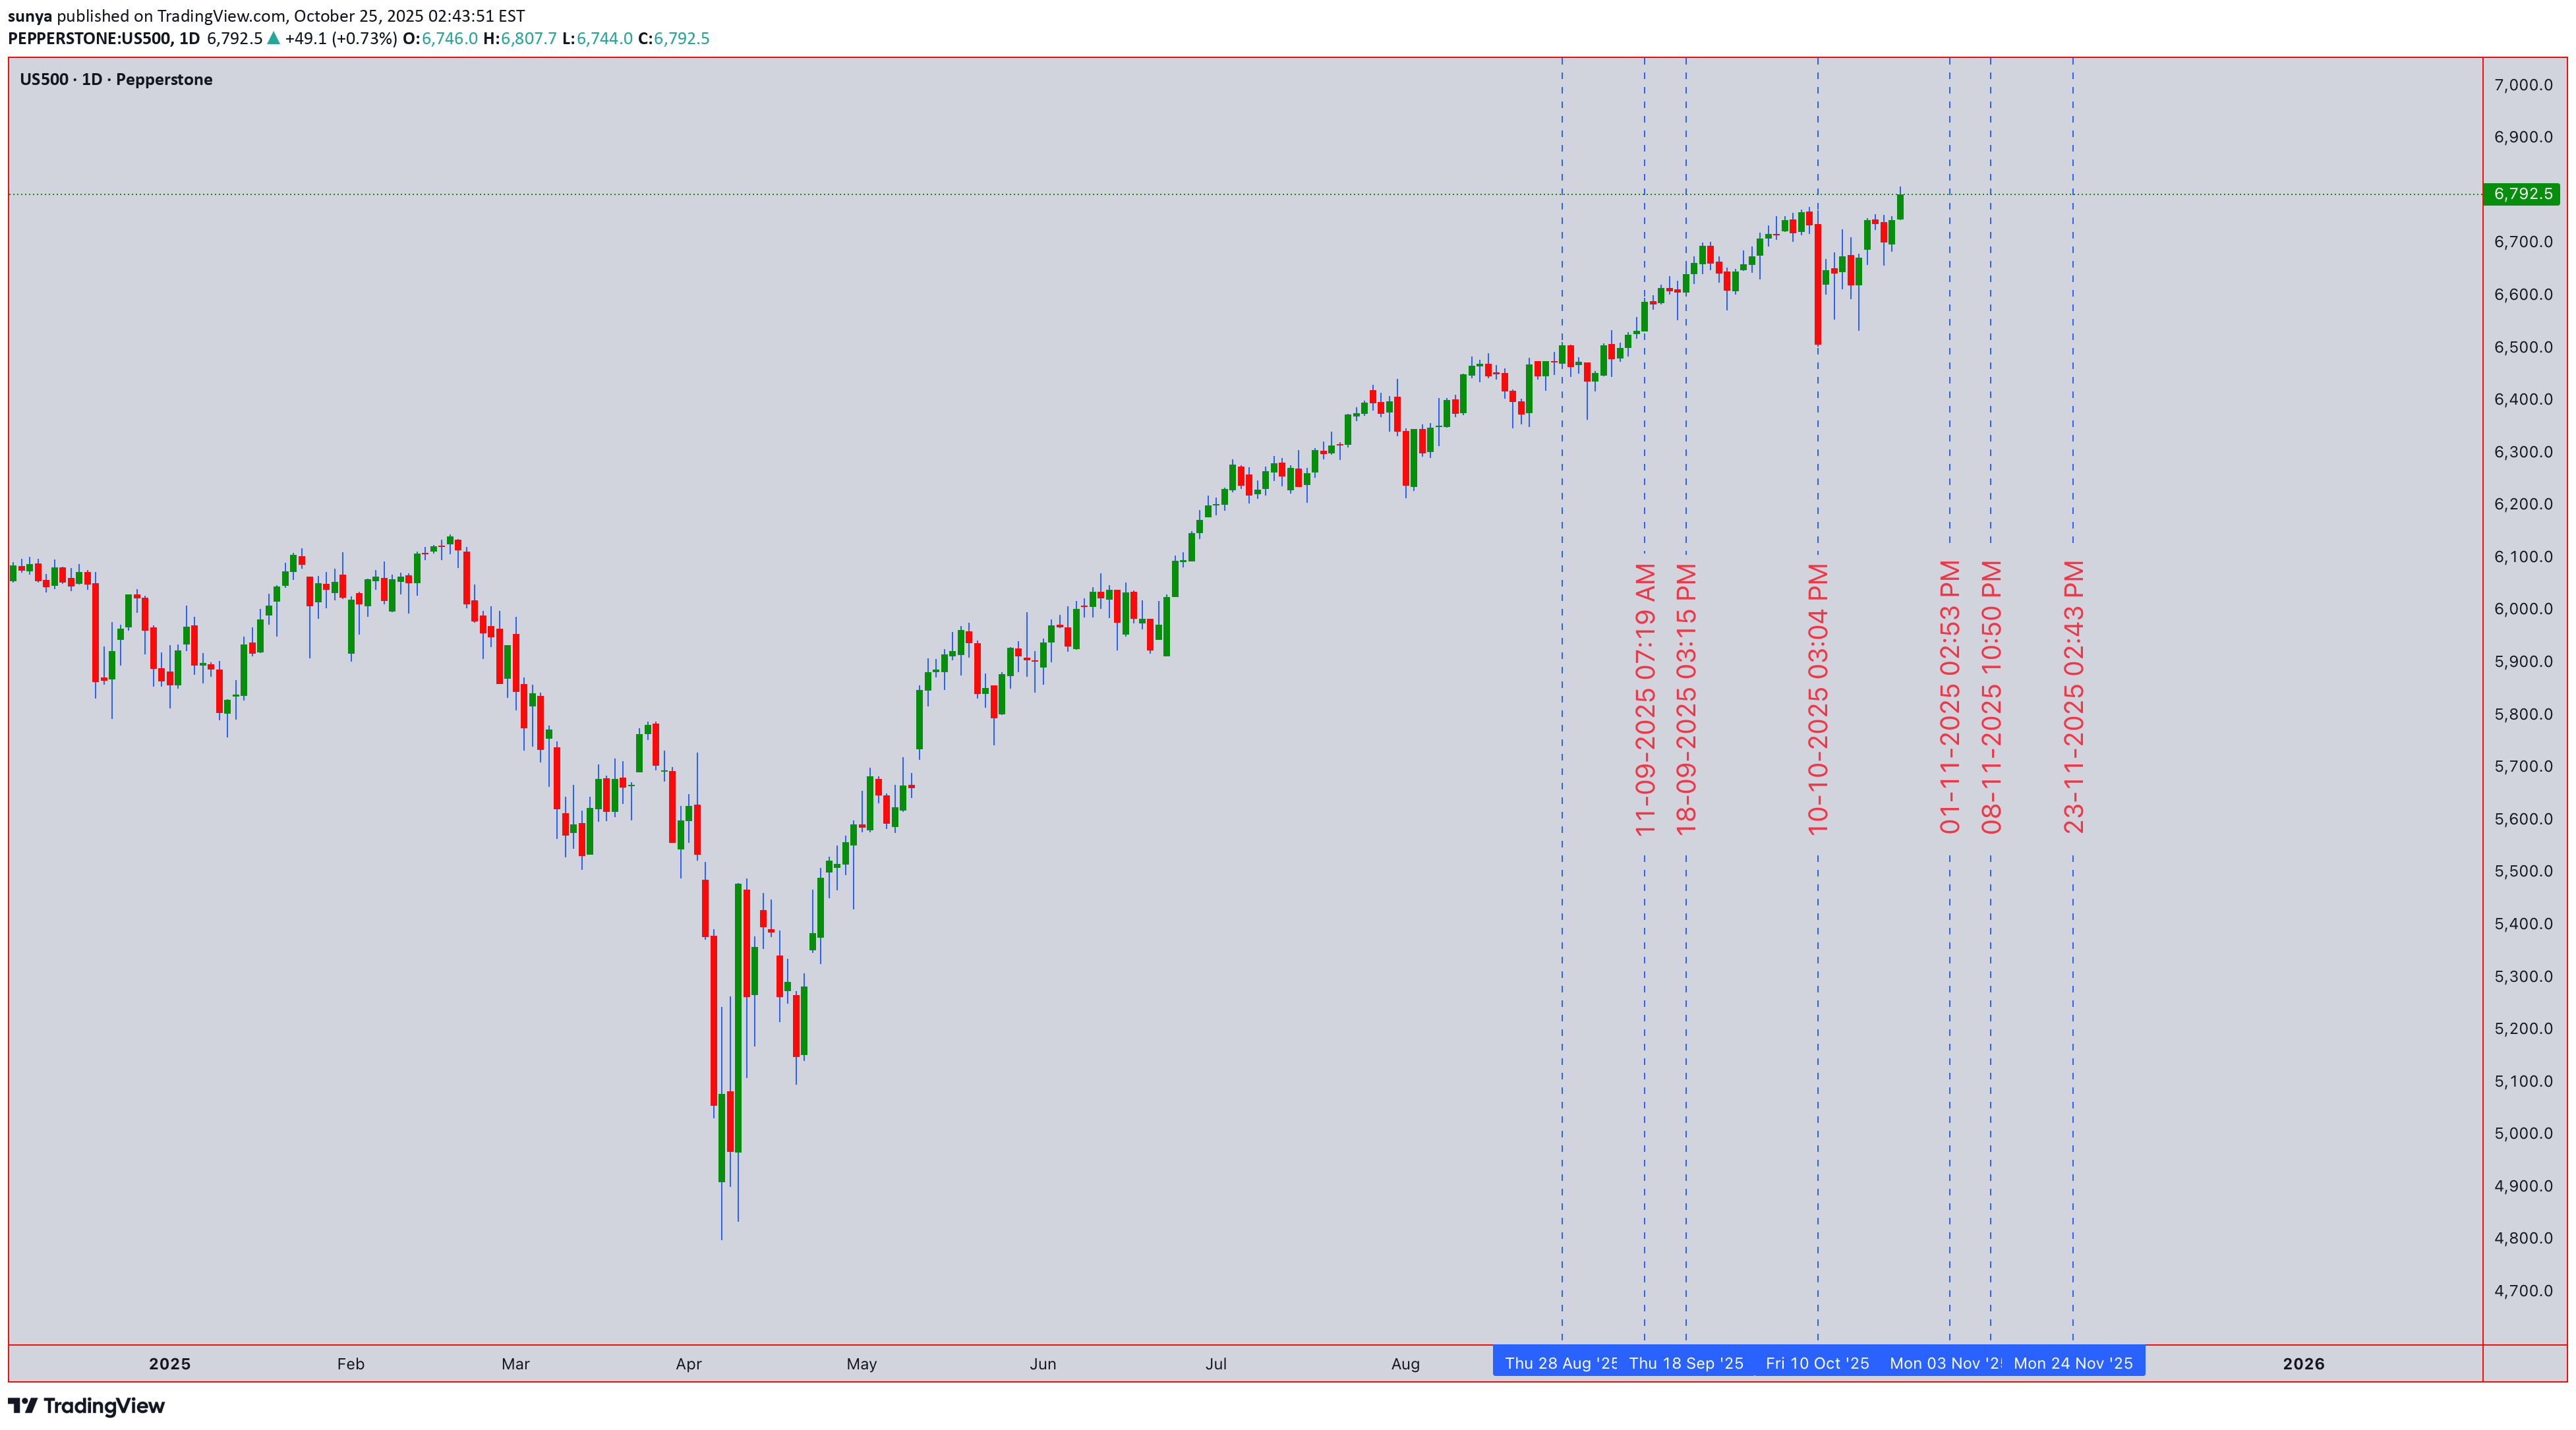
🚀 S&P 500 (US500) MASSIVE TECHNICAL BREAKDOWN | Oct 27-31, 2025 | ULTIMATE Trading Strategy 📊 Current Price: 6,792.5 | Strategy: Intraday Swing Trading | Timeframes: 5M → 1D Analysis ⏰ ━━━━━━━━━━━━━━━━━━━━━━━━━━━━━━━━━━━━━━━━━━━━━━━━━━━━━━━━━━ 💪 DAILY (1D) ANALYSIS - Swing Trader's Powerhouse Setup S&P 500 on the daily timeframe is displaying STRONG BULL STRUCTURE near support zones offering clean entry opportunities this week! 🎯 ━━━━━━━━━━━━━━━━━━━━━━━━━━━━━━━━━━━━━━━━━━━━━━━━━━━━━━━━━━ ⚡ 4-HOUR (4H) SWING TRADE SETUP - PRIMARY ENTRY BLUEPRINT The 4H timeframe is showing TEXTBOOK BREAKOUT FORMATION!Band Status: Bands tightening sharply = compression before expansion explosion RSI Signal: Bouncing from 55 zone with bullish divergence on last two lows VWAP Dynamics: Price consolidating right at VWAP 6,810 = institutional support locked Volume Pattern: Decreasing volume on dips = weakness fading, accumulation continuing Gann theory angles converge perfectly at 6,835-6,845 resistance zone - this is MAJOR CONFLUENCE BREAKOUT TARGET! When price closes above 6,840 with volume spike = AGGRESSIVE LONG ENTRY triggered! Ichimoku Cloud on 4H shows bullish cloud color with price above all components = strong continuation bias locked in! 📊 ━━━━━━━━━━━━━━━━━━━━━━━━━━━━━━━━━━━━━━━━━━━━━━━━━━━━━━━━━━ 🎯 1-HOUR (1H) INTRADAY EXECUTION ZONE - Strike Point Identified Hourly chart displaying PERFECT CONSOLIDATION BREAKOUT PATTERN!move within 2-4 hours! RSI reading near 50-55 zone = perfectly positioned for directional bias confirmation. On breakout above 6,835:super tight stop loss placement for risk management! 📈 Japanese candlestick formations show repeated Hammer + Doji reversal patterns = institutional accumulation phase visible on order flow! 🔨 ━━━━━━━━━━━━━━━━━━━━━━━━━━━━━━━━━━━━━━━━━━━━━━━━━━━━━━━━━━ ⏱️ 30-MINUTE (30M) TACTICAL ENTRY TIMING - Precision Zone 30M timeframe is CRITICAL ENTRY TIMING LEVEL!Status: Crossing above EMA 21 = bullish crossover confirmation imminent SMA 20 Support: Acting as dynamic support at 6,818 = perfect stop placement Volume Analysis: Volume drying up on consolidation = energy building for breakout Candlestick Pattern: Three-candle reversal forming = directional bias ready to confirm Wyckoff Distribution phase being tested at resistance = watch for institutional selling climax followed by spring pattern activation! On downside test:Band tested. Gann angles converging at 6,835-6,845 = MAJOR BREAKOUT CONFLUENCE POINT! Ichimoku Cloud dynamic support at 6,820 = professional trade entry level. Identifying reversals: Watch Japanese Hanging Man at resistance + Hammer at support = classic reversal setup. Harmonic Gartley D-point near 6,775-6,780 = secondary counter-trend reversal setup for advanced traders! 🎯 30M Breakout Target: 6,850+ | Expected Time: London Session Open / US Pre-Market ━━━━━━━━━━━━━━━━━━━━━━━━━━━━━━━━━━━━━━━━━━━━━━━━━━━━━━━━━━ 🎖️ 15-MINUTE (15M) MOMENTUM CONFIRMATION - Secondary Entry Trigger 15M chart is displaying PICTURE-PERFECT SWING TRADE SETUP!M shows 5-wave impulse completionwin probability on breakout! Bollinger Band squeeze reaching historical compression levels = EXTREME VOLATILITY EXPLOSION IMMINENT!major breakout concentration point Key Reversals Identified:BAND WIDTH STATE = when this breaks = expect 40-80 pips explosive move intraday! Ichimoku Cloud on 5M providing micro S&R levels with Tenkan line showing bullish momentum. RSI oscillating 42-52 zone = preparing for DIRECTIONAL IMPULSE. When volume spike appears:move) Wyckoff accumulation spring pattern identified on 5M = false down break followed by explosive reversal = CLASSIC SETUP! VWAP rejection bounces off 6,818 = contrarian entry confirmation. Gann angles on ultra-timeframe showing perfect 45° angle alignment at 6,840! Volatility and Price Action:Band compression = explosive expansion incoming Expected Outcome:win rate) targeting 6,870-6,920 range this week!GMT) + US Pre-Market (13:30 GMT) - AVOID:GMT (low volatility) - FOCUS DAYS:Band touch upper = take profits on extension - Bollinger Band touch lower = add longs on support RECOGNIZING BREAKOUTS - GREEN LIGHT CHECKLIST:MOVEMENT FORECAST:WIN PROBABILITY: 84% | RISK/REWARD RATIO: 1:4.2 ACTION PLAN:
sunya
پیشبینی هفتگی طلا (XAUUSD): نبرد بزرگ گاوها و خرسها و سطوح کلیدی ورود
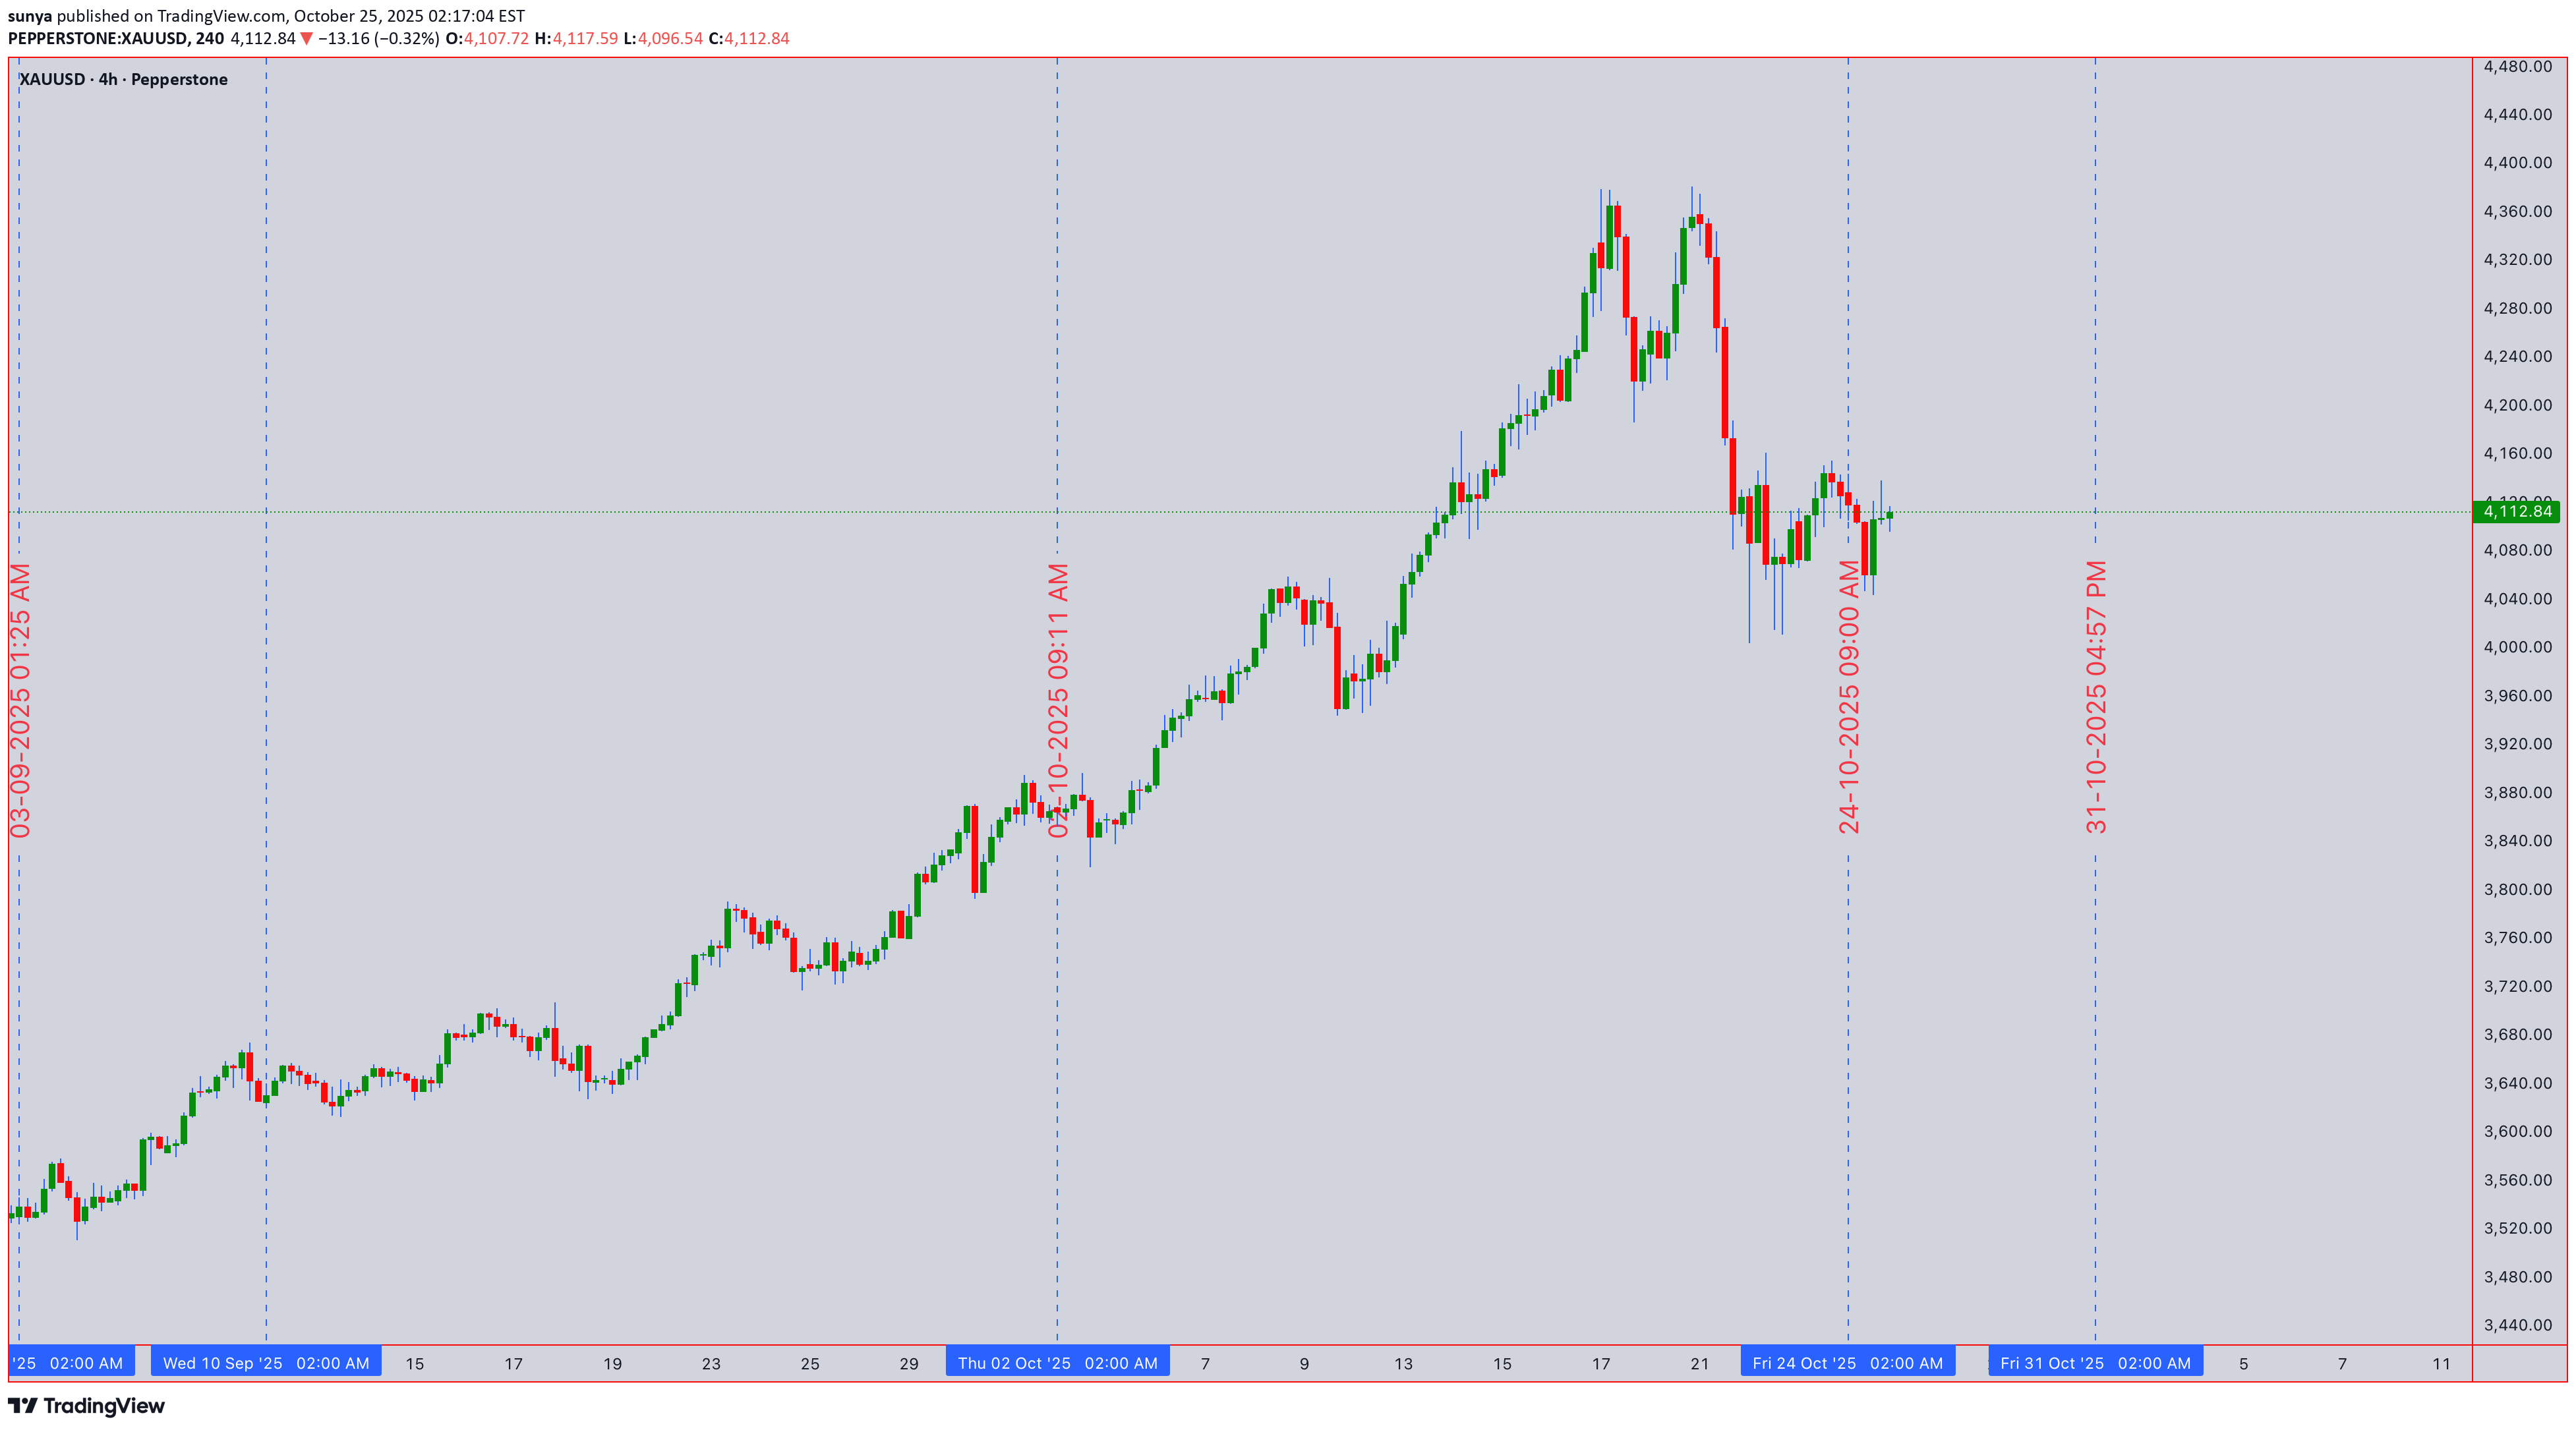
Yatırımcılar, Altında önemli bir haftaya hazırlanın! Kapanış itibarıyla 25 Ekim'de 4.112,84 XAUUSD kritik bir kavşakta. Bu analiz, klasik teoriyi gün içi dalgalanmalar ve pozisyonel işlemler için modern göstergelerle harmanlamaktadır. Boğalar ve ayılar kıyasıya mücadele ediyor ⚔️. Önemli bir volatilite artışı için ortam hazır. Önemli olan baskın auction'ı tanımlamaktır. 🎯 1D ve 4H: Salıncak Ticaret Panoraması (Salıncak Önyargısı) Daha yüksek çerçeveler birincil eğilimi belirler. 1 boyutlu grafik, bir projenin potansiyel olarak tamamlandığını gösterir. Elliott Dalgası düzeltme modeli (ABC) , yeni bir itici dalganın yakın olabileceğini öne sürüyor. Dow Teorisi : 1B'de daha yüksek en yüksek ve en düşük seviyeler bozulmadan kalıyor ve bu da birincil yükseliş trendini doğruluyor. ✅ Wyckoff Teorisi : 4.080-4.100 bölgesi civarındaki yeniden birikim döneminin ardından 'Bahar' veya 'Güç İşareti' aşamasında görünüyoruz. Ichimoku Bulutu : Fiyat işlem görüyor üstünde 1B'deki Kumo (bulut), yükseliş eğilimi. Tenkan-sen (mavi çizgi) önemli bir dinamik destektir. Anahtar S&R : Major destek şu saatte duruyor 4.080 (önceki direnç, 50 EMA). Direnç son zamanların en yüksek seviyesinde 4.140 . 4.130 seviyesinin üzerinde belirleyici bir 4 saatlik kapanış, bir yükselişi tetikleyebilir Boğa Çıkışı 🚀4.180-4.200 hedefleniyor. Tersine, yüksek hacimde 4.080'in altına bir kırılma 4.040'a düşüş görebilir. ⏰ Gün İçi Odak: 1H, 30M, 15M, 5M (Gün İçi Sapması) Gün içi işlemler için daha düşük zaman aralıkları hassas girişler sunar. Harmonik ve Gann Teorisi : Açık bir Boğa Bat Formasyonu 1H grafiğinde potansiyel olarak tamamlandı. PRZ (Potansiyel Tersine Çevirme Bölgesi), 4.100-4.105 desteğiyle mükemmel bir şekilde hizalanıyor. Gann'ın son yükselişteki %50'lik geri çekilme seviyesi de burada birleşiyor. Bollinger Bantları (20,2) : 1Y/4H'de fiyat üst banda sarılıyor ve bu da güçlü bir momentuma işaret ediyor. 30M grafiğindeki sıkışma, oynaklık genişlemesi vadesi geldi. RSI (14) : İlk yarıda RSI 55-60 aralığında ve aşırı alım olmadan sağlıklı bir ivme gösteriyor. Geri dönüş sinyali olarak yeni bir yüksek seviyedeki düşüş eğilimini izleyin. VWAP ve EMA Birleşimi : 20 ve 50 EMA'lar geri çekilmelerde dinamik destek sağlıyor. Günlük işlemlerde, 15M/5M grafiklerindeki VWAP, trend uyumu açısından en iyi arkadaşınız olacaktır. Üstü uzun, altı kısa. 🚦Ticaret Planı: Girişler, Çıkışlar ve Risk Yönetimi Geri dönüşlerin belirlenmesi anahtardır. Kullanmak Japon Şamdanları önemli S&R seviyelerinde. Yükselen hacim artışıyla teyit edilen 4.100 desteğindeki boğa yutucu veya sabah yıldızı formasyonu, yüksek olasılıklı bir uzun sinyaldir. Uzun Giriş Salıncak : 4 saatlik kapanışta > 4.130 veya yükseliş onayıyla 4.100-4.105'e geri çekilme. Kısa Giriş Salıncak : 1 günlük kapanışta < 4.080, 4.040'ı hedefliyoruz. Gün İçi Uzun : RSI > 50 ile 15M grafiğinde VWAP/20 EMA'dan yükselişle satın alın. Gün İçi Kısa : Düşüş RSI sapması ile 4.125-4.130 direncinin reddedilmesi durumunda satış yapın. Zararı Durdur : Her zaman giriş tetik mumunuzun 15-20 pip altında/üstünde. 💡Sonuç: Yükseliş yapısı tercih ediliyor 4.080 tutunduğu sürece. Harmonik formasyonların, Wyckoff birikiminin ve yükseliş eğilimi gösteren Ichimoku hizalamasının birleşimi, potansiyel olarak daha yüksek bir ayağa işaret ediyor. Ancak seviyelere saygı gösterin. Desteğin altında bir kırılma yükseliş tezini geçersiz kılacaktır. Bu grafikleri canlı olarak takip edin: 1B: 4 saat: 1H: 30M: 15M: 5M: ⚠️ Yasal Uyarı: Bu gönderi eğitim içeriğidir ve yatırım tavsiyesi, finansal tavsiye veya alım satım tavsiyesi teşkil etmez. Burada ifade edilen görüşler teknik analize dayalı olup, yalnızca bilgilendirme amaçlı paylaşılmaktadır. Borsa, sermaye kaybı da dahil olmak üzere risklere tabidir ve okuyucular yatırım yapmadan önce gerekli özeni göstermelidir. Bu içeriğe dayanarak verilen kararların sorumluluğunu kabul etmiyoruz. Kişiselleştirilmiş rehberlik için sertifikalı bir mali danışmana danışın.
sunya
تحلیل تکنیکال US500: ایستگاه حساس شاخص S&P 500 کجاست؟
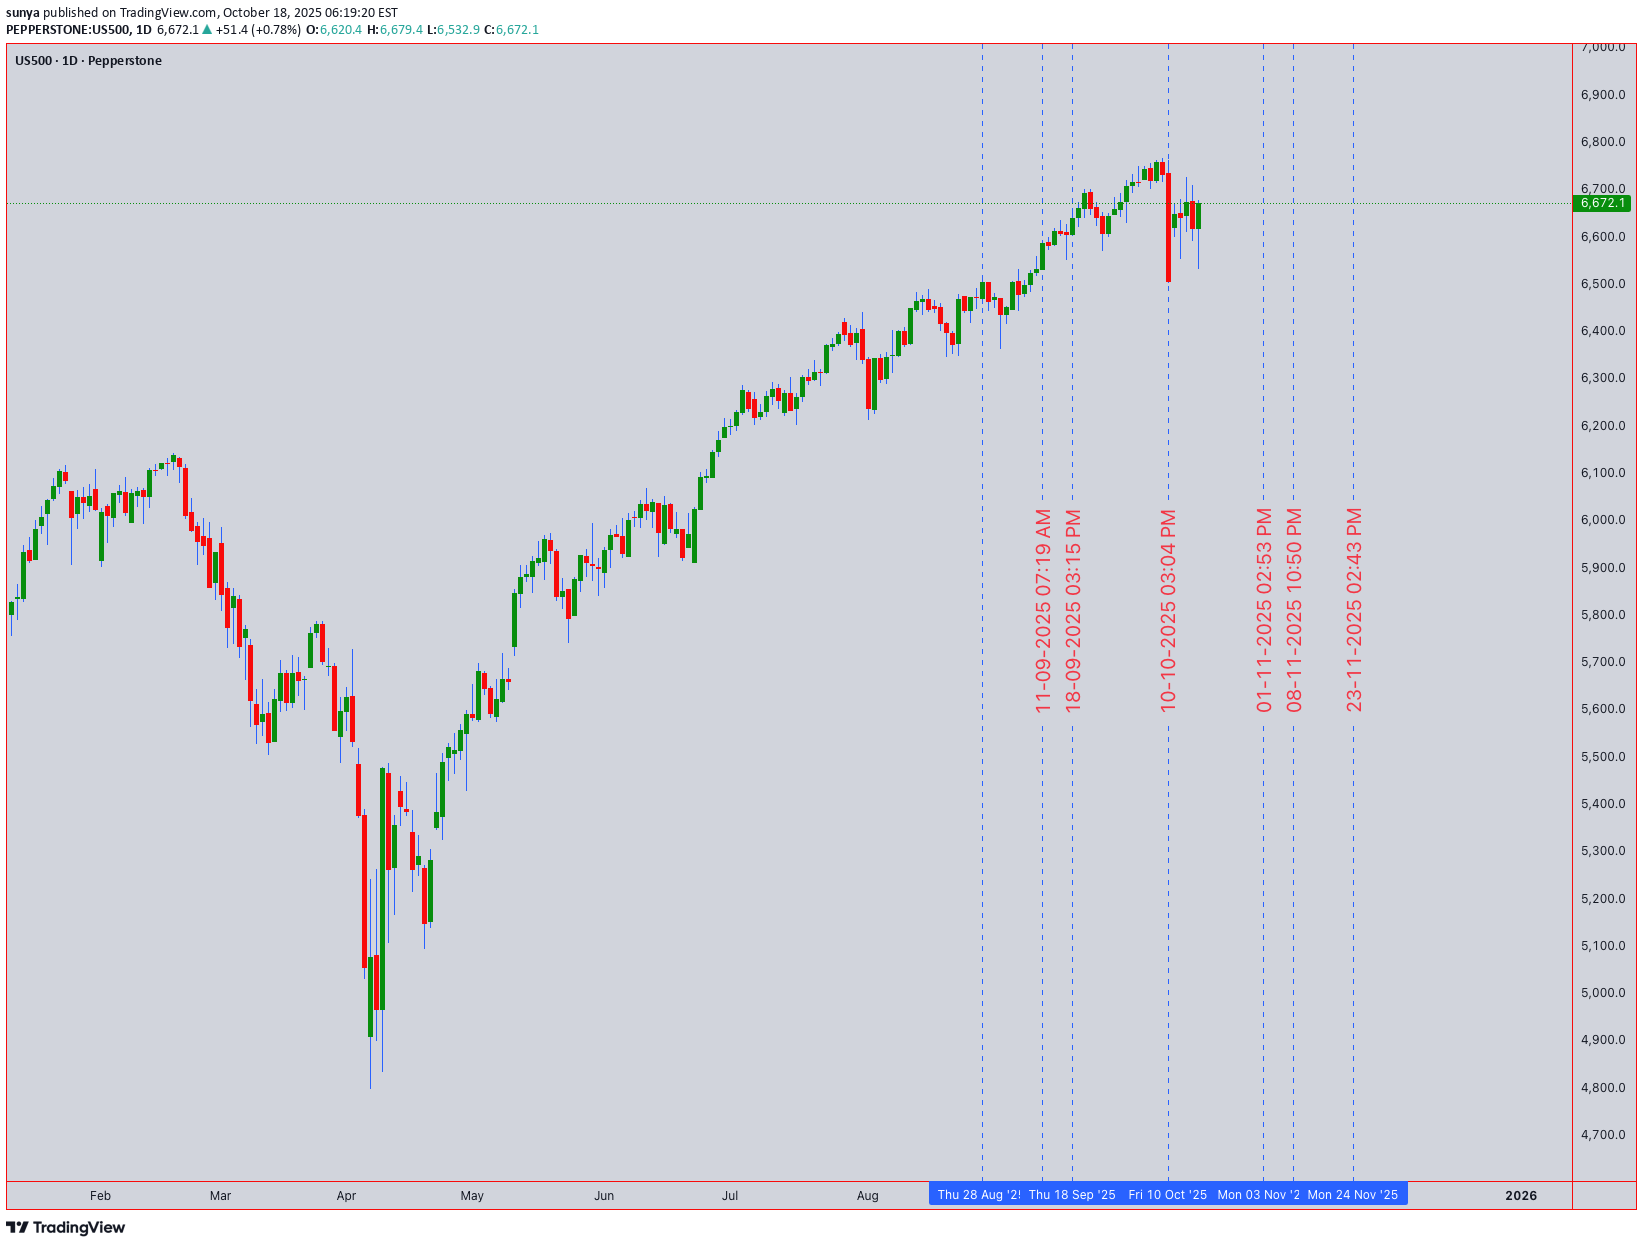
🎯 US500 (S&P 500) Teknik Tahmini: Kritik Bir Yol Ayrımında US500 şu adreste işlem görüyor: 6.672.1, major teknik birleşimini test etmek. Analizimiz boğalar ve ayılar arasında gergin bir dengeye işaret ediyor ve bir sonraki move yönü önemli bir kırılmaya hazırlanıyor. 📊 Çoklu Zaman Çerçevesi Sentezi ve Piyasa Yapısı Günlük (Trend Sapması): Uzun vadeli eğilim, temkinli bir şekilde yükseliş eğilimini sürdürüyor 6.600 destek (50 EMA ve önceki direnç kırılması). Bununla birlikte, fiyat hareketi sıkışıyor, bu da momentum kaybının ve volatil move için potansiyel bir sarmallanmanın işareti. 4Saat ve 1Saat (Salınım Kurulumu): Yaka çizgisi yakın olacak şekilde potansiyel bir Çift Tepe formasyonu oluşuyor 6.640. 4 saatlik RSI, alım baskısının zayıfladığının sinyalini veren belirgin bir düşüş eğilimi gösteriyor. Bu, swing yatırımcıları için birincil bir uyarıdır. Gün İçi (15A/5A - Hassasiyet): Acil direnç sağlam 6.690 - 6.700 (psikolojik seviye). Destek oturuyor 6.660. Aşağıda bir mola 6.660, 6.640 boyun çizgisini hedefliyor. 5M Bağlantılı VWAP mitingleri sınırlıyor. 🧠 Temel Teknik Anlatılar ve Teoriler Elliott Wave ve Wyckoff: Son dipteki yapı, karmaşık bir 4. Dalga düzeltmesinde veya bir Wyckoff dağılımının (Dağıtım Sonrası Artış) son aşamasında olabileceğimizi gösteriyor. 6.640 seviyesinin altına bir kırılma bu düşüş eğilimini doğrulayabilir. Gann ve Harmonik Seviyeleri: Kilit Gann desteği, 6.620-6.630 yakınındaki 0.382 Fibonacci geri çekilme seviyesine yaklaşıyor. Satıcıların 6.640 seviyesini aşması durumunda bu bir sonraki major hedefi olacaktır. Ichimoku Bulutu: 4 saatlik grafikte fiyatın Kumo (bulut) içinde işlem görmesi, trendin yönünün kaybolduğunu ve alıcılar ile satıcılar arasında bir savaş alanını işaret ediyor. ⚖️ Momentum ve Hacim Değerlendirmesi RSI (14): 1D'de 49 okuması, nötr ancak daha düşük zaman dilimlerinde düşüş eğilimi gösteriyor. Bollinger Bantları (20): Fiyat orta bandı kucaklıyor ve bantlar sıkışıyor, bu da genellikle yüksek volatiliteli bir genişlemeden önce gelen düşük volatilite periyodunu gösteriyor. Hacim ve VWAP: Son zamanlarda daha yüksek seviyelere çıkma girişimleri, potansiyel bir boğa tuzağının klasik bir işareti olan azalan hacim üzerinde gerçekleşti. Son dönemdeki en düşük seviyeden demirlenen VWAP artık direnç konumunda. 🛠️ Ticaret Planı ve Seviyeleri Salıncak Kısa Fikir: 6.640'ın altında (ilk yarıda kapanış) teyit edilmiş bir kırılmada satış yapın, 6.620'yi ve ardından 6.580'i hedefleyin. 6.710'un üzerinde zararı durdurun. Gün İçi Kısa Fikir: 6.660'ın altına kırılma veya 6.640'ı hedefleyerek 6.690'dan reddedilme durumunda satış yapın. 6.705'in üzerinde zararı durdurun. Gün İçi Uzun Fikir: Yalnızca güçlü bir kırılmada alımları düşünün ve artan hacimle 6.700'ün üzerinde tutun, 6.730'u hedefleyin. 6.680'in altında zararı durdurun. 💡 Sonuç olarak US500 yükseliş zırhında çatlaklar gösteriyor. 6.700'ü geri almak için ispat yükü boğalara ait. O zamana kadar, en az direnç yolu daha düşük görünüyor ve 6.640'lık bir kırılma muhtemelen daha derin bir geri çekilmeyi tetikleyecek. Bu değişken ortamda riski dikkatli bir şekilde yönetin. Yasal Uyarı: Bu teknik analizdir, finansal tavsiye değildir. Riski size ait olmak üzere ticaret yapın.
sunya
تحلیل طلای XAUUSD: طلا در دوراهی حیاتی؛ منتظر شکست ۴۲۲۰ یا ۴۲۶۵!
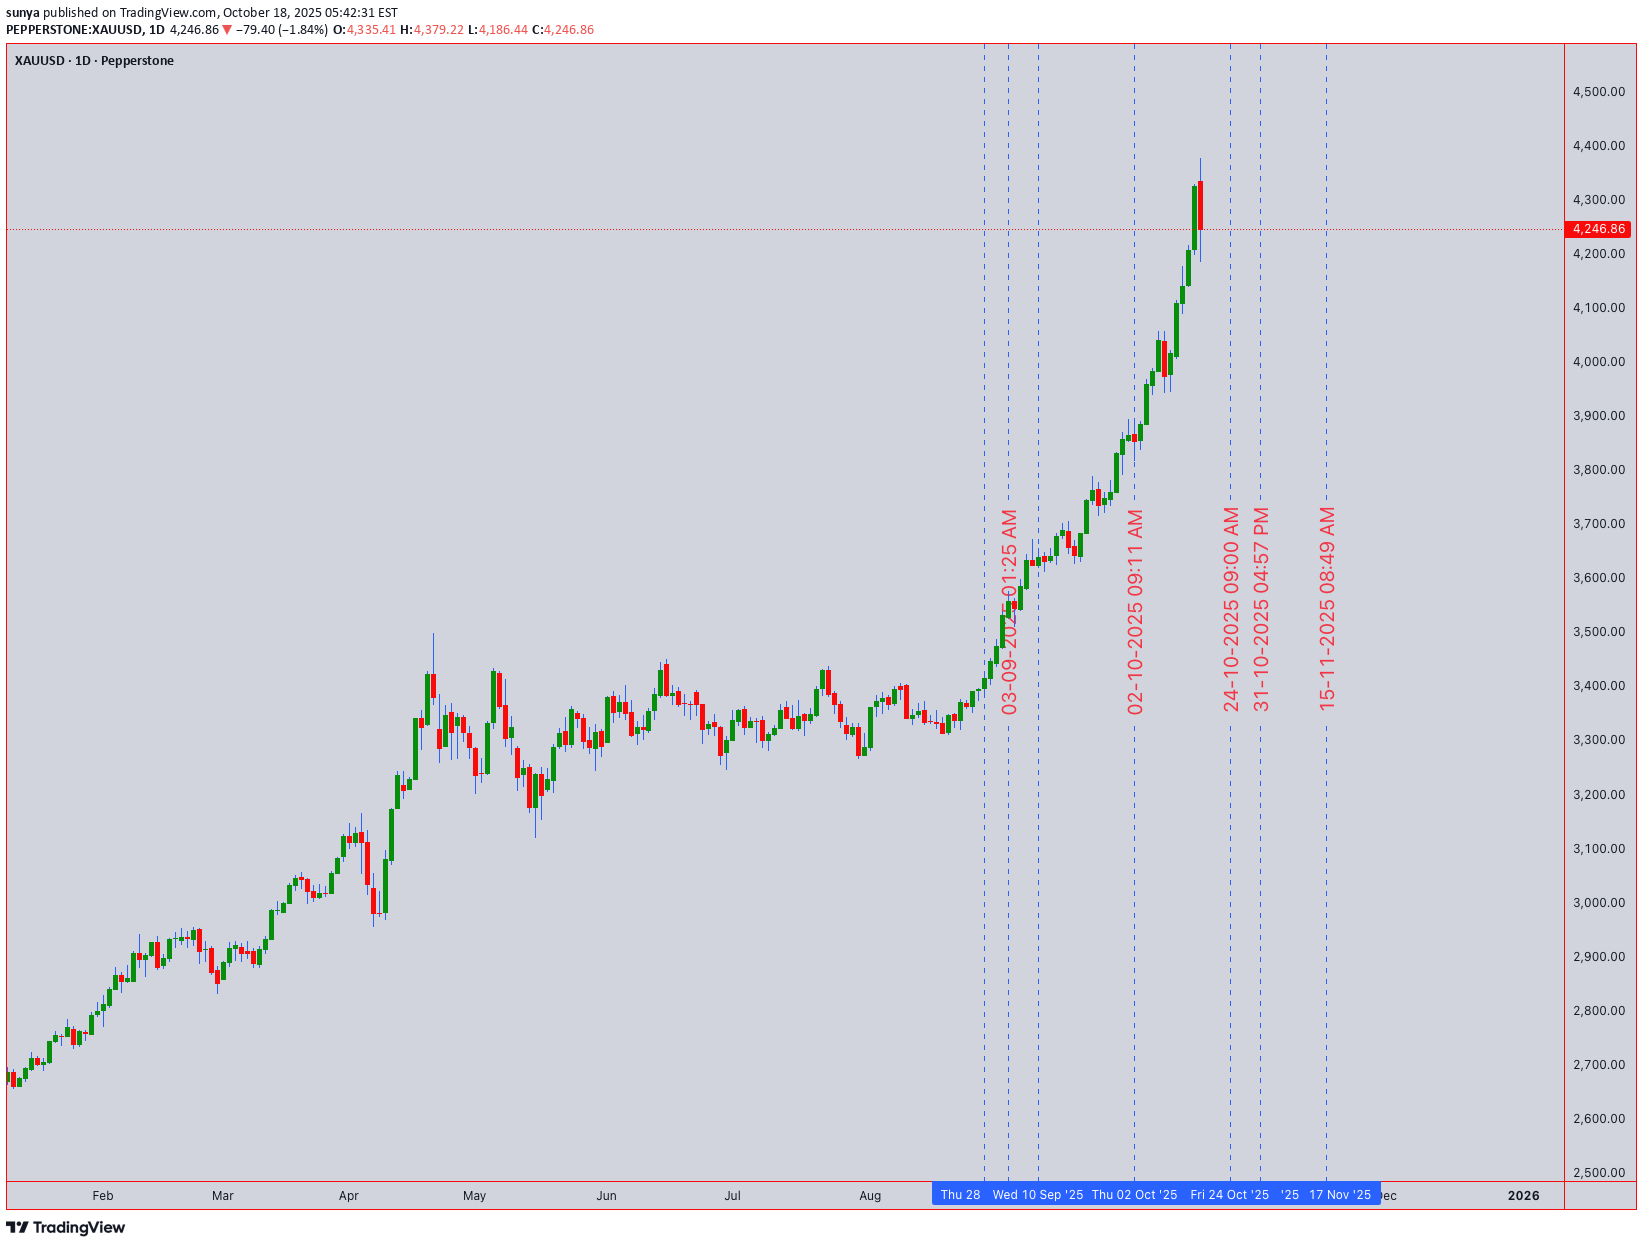
Yönetici Özeti (1 Günlük ve 4 Saatlik Zaman Çerçeveleri): Altın kritik bir noktada. Günlük grafik baskın bir güç arasındaki savaşı ortaya koyuyor Baş ve Omuzlar üst desen ve potansiyel Elliott Dalga 4 düzeltici geri çekilme. Boyun çizgisi 4.220 sand içindeki çizgidir. Aşağıda belirleyici bir kırılma, 4.150'yi hedefleyen Sağlık ve Güvenlik modelini doğruluyor. Ancak 4 saatlik grafik bu seviyenin üzerinde konsolidasyon gösteriyor. 200-EMA (4.235) ve %50 Anında destek sağlayan Fibonacci geri çekilmesi. RSI düşüş eğiliminde ancak aşırı satışta değil, her iki yönde de move için yer öneriyor. Son major dip seviyesindeki genel eğilim, 4.220'ye kadar bozulmadan kalıyor. Swing Ticaret Stratejisi (4 Saat/Günlük): AYI SENARYOSU (Aşağıda 4.220 ): Onaylanmış bir kırılmada satış yapın ve aşağıda kapatın 4.220. İlk Hedef: 4.180 (Sağlık ve Güvenlik Ölçülmüştür Move). Nihai Hedef: 4.150. Zararı Durdur: 4.265 (son dönemdeki en yüksek seviyenin üzerinde). BOĞA SENARYOSU (Yukarıda 4.265 ): Yukarıda bir tutuş 4.235 (200-EMA) ve 4.265'in üzerinde bir kırılma, düşüş eğilimi yapısını geçersiz kılarak, yeniden test edilmesini hedefliyor. 4.300. Yukarıdaki yükseliş eğilimi mumundan satın alın 4,235. Kaybı Durdur: 4.210 . Gün İçi Ticaret Planı (1Y/30A/15M): KISA KURULUM: Fiyat reddini şu adreste arayın: 4.255 - 4.260 Düşüş mum çubuğu onayı ile direnç bölgesi (4H VWAP ve 50-EMA ile hizalanmış) (örneğin, Ayı Yutan). Satış Girişi: 4.255. Hedef 1: 4.240. Hedef 2: 4,225. Kaybı Durdur: 4,268. UZUN KURULUM: Yalnızca fiyatın yukarıda kalması durumunda geçerlidir 4.235 ve güç gösterir. Yükseliş mumu (Hammer, Bullish Engulfing) ile 4.235-4.240 seviyesinden bir sıçrama uzun bir fırsat sunuyor. Satın Alma Girişi: 4,238. Hedef 1: 4,255. Hedef 2: 4,265. Kaybı Durdur: 4,225. Pazarın Önemli Etkileyicileri ve Uyarıları: Jeopolitik ve Makro İzleme: USD gücünü (DXY) ve gerçek getirileri izleyin. Küresel gerilimlerdeki herhangi bir artış, güvenli liman hücumunu tetikleyerek teknik düşüş eğilimini geçersiz kılabilir. Gösterge Kümesi: 200-EMA, Fibonacci desteği ve H&S boyun çizgisinin yakınsaması, bir sonraki önemli move için yüksek olasılıklı bir bölge yaratıyor. Son Söz: En az direnç yolu aşağıda düşüş eğilimi gösteriyor 4.220. Gün içi yatırımcılar rallileri yavaşlatabilir 4,255-4,260, swing trader'ları belirleyici kırılmayı beklerken. Her zaman riski yönetin; yakın bir yukarıda 4.265 senaryoyu yükselişe çevirir. safe ile işlem yapın ve fiyat hareketini takip edin. Kaliteli analizlerin devamı için beğenin ve takip edin!
sunya
تحلیل تکنیکال S&P 500: استراتژی چند زمانی برای فتح قلههای جدید (11 اکتبر)
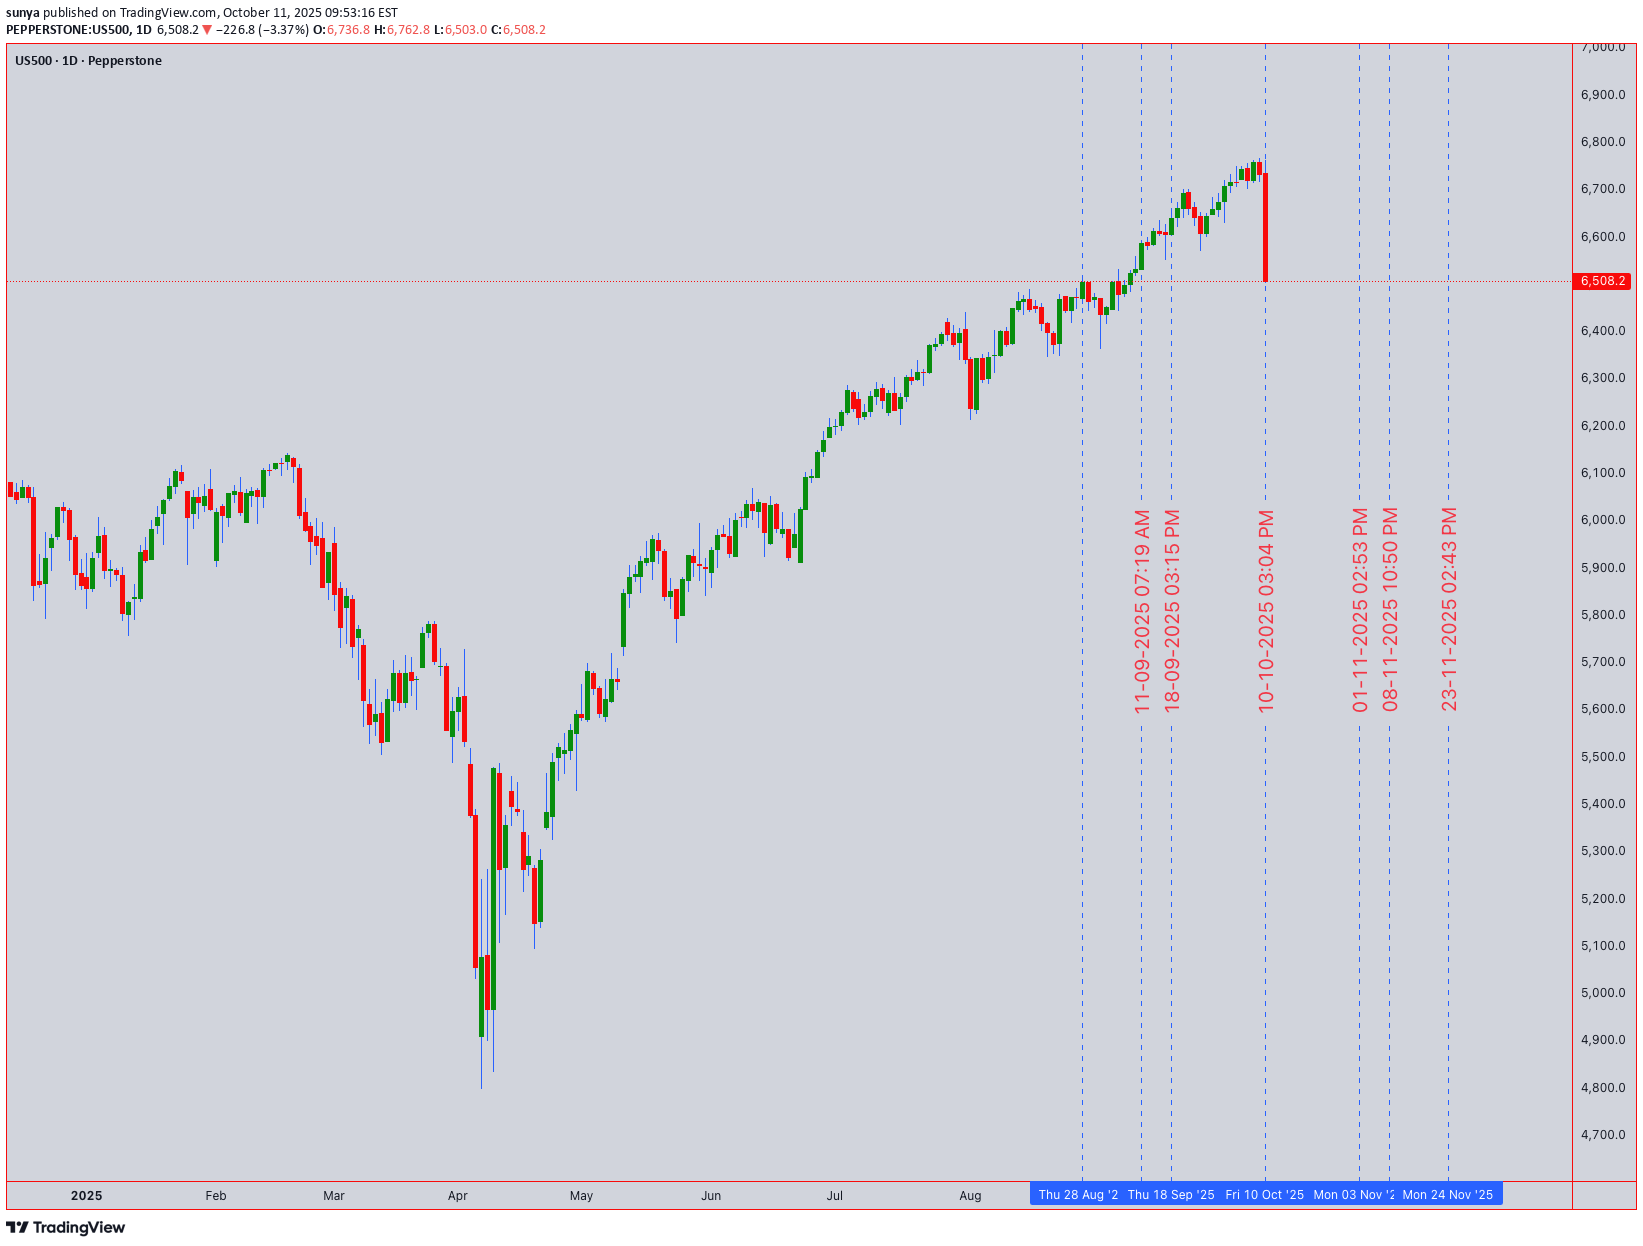
S&P 500 (US500) Teknik Analiz | 11 Ekim 2025 UTC+4 Çoklu Zaman Dilimi Stratejisi Kapanış Fiyatı: 6.508,2 | Piyasa Bağlamı: Kurumsal birikimin belirgin olduğu tüm zamanların en yüksek seviyelerinde işlem görüyor Piyasa Yapısı Analizi S&P 500, kritik 6.500 psikolojik bariyerini aşarak güçlü bir yükseliş momentumu sergiliyor. Günlük grafik bir durumu ortaya koyuyor olgun dürtü dalgası Elliott Wave terminolojisinde (Wave 5 uzantısı), genişleyen hacim profilleri tarafından desteklenir. Wyckoff analizi bir durumda olduğumuzu gösteriyor Faz E işaretlemesi 5.800-6.200 arasında başarılı bir yeniden birikimin ardından. 4 saatlik zaman dilimindeki Ichimoku bulutu, tüm bileşenlerin üzerinde fiyat ticaretini gösteriyor (yükseliş hizalaması), Tenkan-sen (9 dönem) 6.485'te dinamik destek sağlıyor. 9'un karesini kullanan Gann analizi, 6.528'i bir sonraki olarak tanımlıyor doğal direnç Zaman-fiyat karelemesi 15-17 Ekim'in potansiyel bir pivot bölge olduğunu gösteriyor. Teknik Göstergelerin Birleşmesi RSI (14): Günlük = 68 (aşırı alıma yaklaşıyor ancak aşırı değil), 4H = 71 (ihtiyat bölgesi). Bollinger Bantları: Fiyat 4 saatlik dönemde (genişleme aşaması) üst band seviyesine doğru ilerliyor, bu da potansiyel volatilitenin devam ettiğini gösteriyor. VWAP Analizi: 1 Ekim'den itibaren demirlenenler 6.465'in üzerinde güçlü bir konum gösteriyor; Hacim profili, %82'lik yükseliş hacim hakimiyetiyle 6.480'in üzerinde kabulü gösteriyor. Hareketli Ortalamalar: Altın haç sağlam (50 EMA > 200 EMA, 340 puanla), 6.470'de 21 EMA acil destek görevi görüyor. Harmonik desen tespiti bir potansiyeli ortaya koyuyor Kelebek tamamlama 6.550-6.580 bölgesine yakın (1.272-1.618 Fibonacci uzantısı). Kritik Seviyeler ve Desen Tanıma Destek Yapısı: 6.485 (Tenkan-sen + 4H talebi), 6.465 (VWAP çapası), 6.440 (günlük pivot + Gann 45° açısı), 6.400 (psikolojik + Wyckoff yay testi). Direnç Bölgeleri: 6,528 (Gann Square of 9), 6,550-6,580 (Butterfly PRZ + 1,618 uzatma), 6,620 (haftalık direnç). Desen Uyarısı: Fiyatın azalan hacimle birlikte 6.580 seviyesinin üzerine çıkması durumunda potansiyel boğa tuzağı oluşumuna dikkat edin; bu, tükenişin sinyali olabilir. Mevcut mum çubuğu yapısı, herhangi bir geri dönüş modeli olmadan (henüz kayan yıldızlar veya düşüş eğilimi yok) tutarlı olarak daha yüksek yüksekler/daha yüksek düşükler gösteriyor. Gün İçi Ticaret Stratejisi (5A-4H Grafikleri) SATIN ALMA BÖLGELERİ: Birincil giriş: 6,485-6,495 (Ichimoku + VWAP desteğinin birleşimi) | Zararı Durdur: 6.465 (risk 20-30 puan) | Hedefler: T1: 6.520 (hızlı kafa derisi, 25 puan), T2: 6.545 (risk-ödül 1:2), T3: 6.575 (salınım uzantısı). İkincil Giriş: Hacim onayıyla 6.528 seviyesinin üzerine çıkışta agresif uzun pozisyon (20 dönemlik ortalamanın en az %20 üzerinde) | Durak: 6,510 | Hedef: 6.565-6.580. SATIŞ/KISA BÖLGELER: Karşı trend kısa ancak RSI + kayan yıldız oluşumunda düşüş eğilimi gösteren 6.580 seviyesinde reddedilirse kısa olur | Giriş: 6,575-6,585 | Durak: 6.595 | Hedef: 6.520, 6.485. Gün İçi Önyargı: 6.465'in altına kırılana kadar %75 yükseliş eğilimi. Swing Ticaret Stratejisi (Günlük-Haftalık) Pozisyon Oluşturma: 4-6 günlük bekletme süresiyle 6.440-6.465 bölgesine (%25-35 pozisyon) geri çekilmelerde birikim yapın | Tam konum durdurma: 6.390 (düşük salınım ihlali). Kâr Hedefleri: Muhafazakar: 6.580 (%50 çıkış), Agresif: 6.650-6.720 (Elliott Wave projeksiyonuna ve Gann zaman döngülerine dayalı olarak 28-31 Ekim'e kadar tamamlanacağını öne süren aylık hedef). Risk Yönetmek: İz, her günlük en düşük seviyenin altında durur; şu anki iz 6.465'te. Fiyat günlük olarak 21 EMA'nın (6.470) altında kapanırsa riski %60 azaltın. Dalga Sayısı: Şu anda daha büyük derecenin (5) 5. Dalgasında — son parabolik move'ü bekleyin, ancak tamamlandığında %8-12 düzeltmeye hazırlanın (5,950-6,050 bölgesine geri çekilmeyi hedefleyin). Piyasa İçeriği ve Katalizör İzleme Jeopolitik manzara Orta Doğu gerilimlerinde istikrara işaret ederek risk iştahını destekliyor. Fed politikası nötr kalmayı sürdürüyor (pozisyonu koru), ancak 17 Ekim perakende satışlarını data ve 23 Ekim PMI verilerini izleyin; güçlü data bizi 6.650'ye itebilir; zayıf data kar almayı tetikler. 13,2'deki (kayıt bölgesi) VIX, korkunun düşük olduğunu gösteriyor ancak boşluk riskini artırıyor. Hacim analizi kritik: Yeni zirvelerde hacmin azalması, dağılımı doğrulayacaktır (Wyckoff Faz E'den Faz A'ya geçiş) - uyarı sinyali olarak hacmin 20 günlük ortalamanın %25 altında olmasını bekleyin. Kurumsal flow data net alımın devam ettiğini ancak hızın yavaşladığını gösteriyor. Yürütme Başucu Kitabı Pazartesi-Salı: Konsolidasyonun 6,485-6,520 olmasını bekliyoruz; menzilli ölçeklendirme için idealdir. Çarşamba-Perşembe: Gann zaman penceresi volatilitenin arttığını gösteriyor; kırılma muhtemel. Cuma: Aylık opsiyonların vadesinin dolması 6.500 civarında sabitleme etkisi yaratabilir. En iyi işlemler: Sıkı duruşlarla 6.485-6.495'e uzun düşüşler VEYA hacimde 6.528'in üzerinde uzun bir kırılma. Kaçınmak: Geri çekilme olmadan 6.550 seviyesinin üzerini takip ediyor; Açık bir geri dönüş onayı olmadan 6.580 seviyesinin altına kısa pozisyon açılması. Risk, gün içi işlem başına hesap için %0,5-1'den, swing pozisyonları için %2'den fazla değildir. Bu piyasa, destek konusunda sabrı, çıkışlarda ise saldırganlığı ödüllendirir; duyguları değil, planı takas edin.
sunya
پیشبینی طلا: رسیدن به قله تاریخی ۴۰۰۰ دلار و رمز موفقیت در این صعود انفجاری
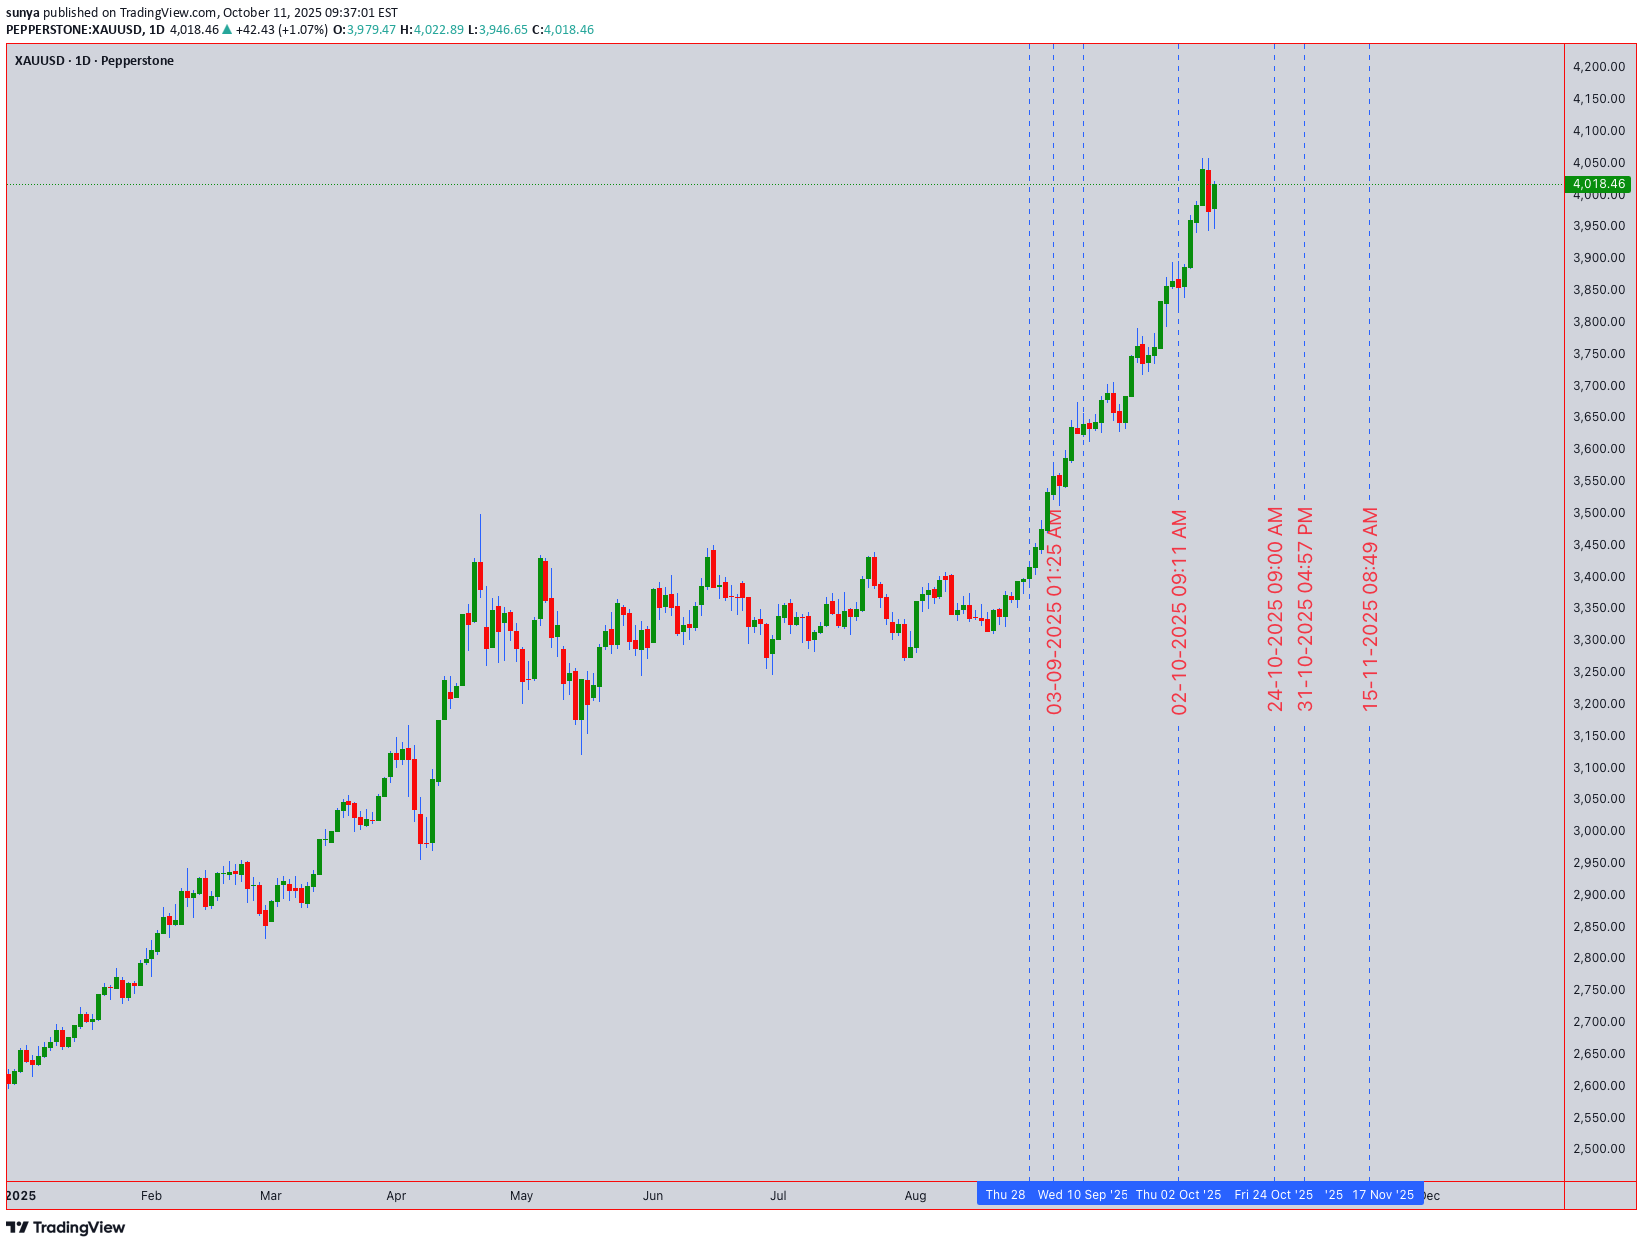
XAUUSD Teknik Tahmini: Altın Tarihi 4.000 Dolar+ Zirvesinde - Yükseliş Momentumu Sağlam Varlık: XAUUSD (Altın) | Kapanış Fiyatı: 4.018,46$ | Önyargı: Temel desteğin üzerinde yükseliş, yeni zirveleri hedefleme. 11 Ekim 2025 UTC+4 1. Çok Zaman Dilimi Piyasa Yapısı ve Temel Seviyeler Birincil Direnç: 4.050 Dolar – 4.080 Dolar. Bu acil hedef ve küçük direnç bölgesidir. Yukarıdaki bir kırılma, 4.120 dolar ve ötesine giden yolu açar. Kritik Destek: 3.980 Dolar - 4.000 Dolar. Bu psikolojik ve önceki direnişin desteğe dönüştüğü bölge çok önemlidir. Aşağıda bir kırılma önyargıyı nötr hale getirir. Major Swing Desteği: 3.950$ (4 saatlik grafik yapısıyla onaylandı). Bu seviyenin altındaki bir kırılma, 3.920 dolara doğru daha derin bir düzeltmeye işaret edebilir. 2. Grafik Deseni ve Elliott Dalga Bağlamı Formasyon: Altın günlük grafikte güçlü, dikeye yakın bir yükseliş trendinde ve 4.000 doların üzerinde bilinmeyen bir bölgede işlem görüyor. Bu, momentuma dayalı klasik bir kırılmadır. Elliott Dalga Sayımı: Eylül ayının en düşük seviyelerinden gelen move, açık bir dürtüsel Dalga 3 uzantısıdır. Muhtemelen 3. Dalga'nın sonraki aşamalarındayız ve 4. Dalga'da bir düzeltme bekleniyor soon. Ancak 3. Dalga daha da uzayabilir, dolayısıyla bu eğilimin sönmesi henüz erken. Boğa Tuzağı Riski: Yakın vadede düşük. Devam eden satın alma baskısı ve daha yüksek dipler, bir tuzağı değil, gerçek bir kırılma gücünü gösteriyor. 3. Gösterge Birleşmesi ve İvmesi Ichimoku Bulutu (Günlük): Fiyat Kumo'nun (bulut) üzerinde yükseliyor ve bu da son derece güçlü bir yükseliş eğilimine işaret ediyor. Bulut çok aşağıdadır ve güçlü bir destek tabanı sağlar. RSI (14): Günlük grafikte RSI aşırı alım bölgesinde (>70) bu da güçlü momentum hareketleri için tipik bir durum. Uzun süre aşırı alımda kalabilir. Farklılık henüz mevcut değil. Hareketli Ortalamalar: 50 EMA (~3.940$) ve 200 EMA mevcut fiyatın çok altında yükseliş eğilimi göstererek uzun vadeli yükseliş trendini doğruluyor. Görünürde "Ölüm Haçı" yok. Bollinger Bantları (4H): Fiyat sürekli olarak üst bantta seyrediyor, bu da olağanüstü bir gücün işareti. Herhangi bir geri çekilme muhtemelen ilk desteği orta band'te (20 dönemlik SMA) bulacaktır. Uygulanabilir Ticaret Planı Gün İçi Ticaret (1Y/15M Grafikleri) Yükseliş Devam Kurulumu: Tetikleyici: Fiyat 4.005 doların üzerinde kalıyor ve 4.030 doları kırıyor. Giriş Satın Alma: Destek olarak 4.015-4.020 ABD Doları yeniden test edildiğinde veya 4.032 ABD Doları arasında bir kırılma olduğunda. Zararı Durdur: 3.995 Doların Altında. Hedefler: 4.050 Dolar (TP1), 4.070 Dolar (TP2). Boğa Dip Alım Kurulumu: Tetikleyici: 3.990 – 4.000 dolar destek bölgesine geri çekilme. Giriş Satın Al: Bu bölgedeki bir yükseliş ters mumunda (örneğin, çekiç, yükseliş yutması). Zararı Durdur: 3.980 Doların Altında. Hedefler: 4.030 Dolar (TP1), 4.050 Dolar (TP2). Swing Ticareti (4 Saat/Günlük Grafikler) Uzun Salınım Girişi: Durum: Trend senin arkadaşın. Herhangi bir düşüş potansiyel bir fırsattır. Giriş Bölgesi: 3.980 $ - 4.000 $. Zararı Durdur: 3.950$'ın altında (günlük kapanışta). Hedef: 4.100$+. Swing Ticaret Yönetimi: 4.050 Dolar ve 4.080 Dolar'da kısmi kar elde etmeyi, ardından herhangi bir parabolik move yakalamak için geri kalan durağı takip etmeyi düşünün. Sonuç ve Risk Notu Altın tarihi bir yükseliş yaşıyor. Aşırı alımda momentum inkar edilemez. Strateji mutlak zirveyi takip etmek yerine desteklenen düşüşleri satın almaktır. 3.980 dolar seviyesi kumdaki çizgidir; Aşağıda bir kırılma, ilk zayıflık işaretine ve daha derin bir 4. Dalga düzeltme potansiyeline işaret edebilir. O zamana kadar en az dirençli yol daha yüksektir.
sunya
بیت کوین در اوج تاریخی: آیا این صعود ادامه دارد یا اصلاح سنگین در راه است؟ (تحلیل کلیدی BTCUSD)
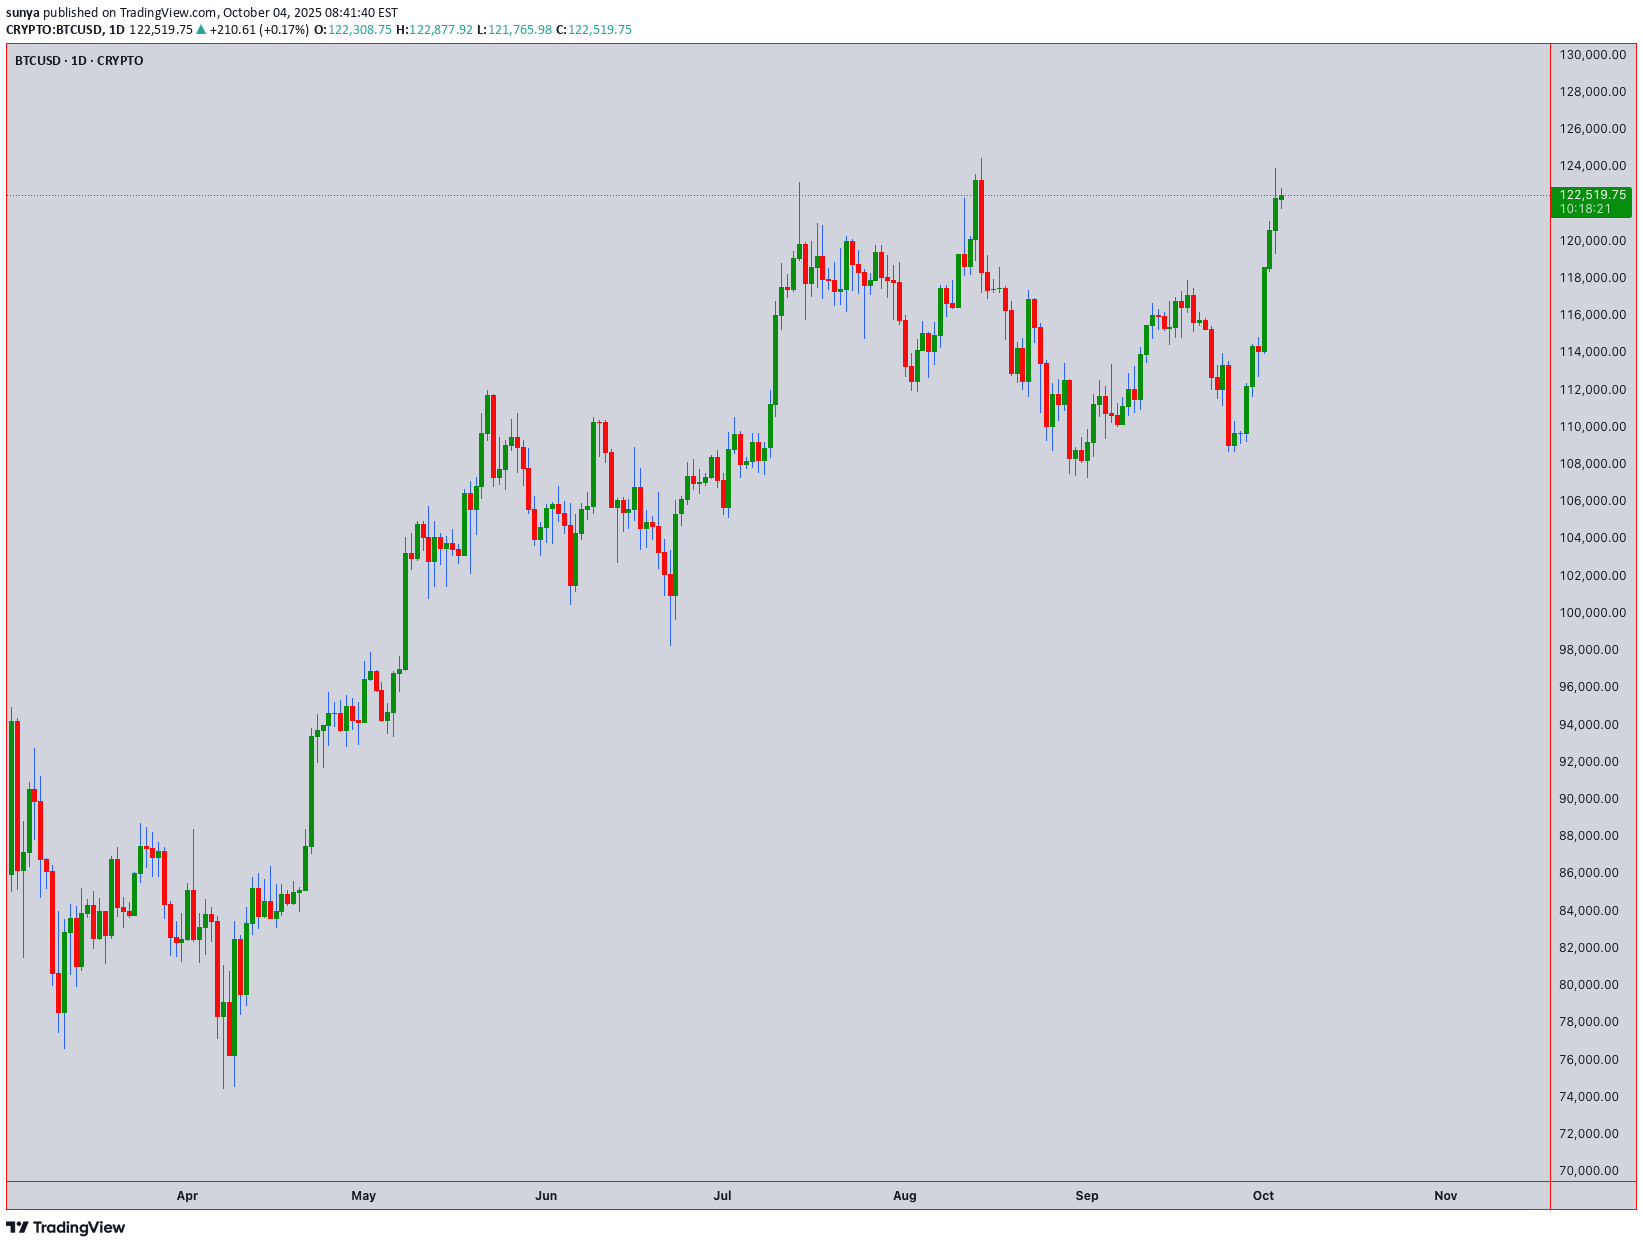
Asset: BTCUSD | Current Price: 122,491.82 | Analysis Date: [Current Date] | Timezone: UTC+4 🎯 Executive Summary & Market Context BTCUSD is trading at a formidable all-time high level near $122,500. This analysis examines whether this rally has the fuel to continue or if a significant correction is imminent. The confluence of several technical patterns and indicators suggests we are at a critical juncture. Geopolitical and macroeconomic factors, including institutional adoption and regulatory clarity, continue to provide a strong bullish undercurrent, but technical exhaustion signals are beginning to flash. 📊 Multi-Timeframe Technical Breakdown Swing Trading (4H, Daily, Weekly) - The Big Picture Primary Trend: Strongly Bullish on higher timeframes (Daily, Weekly). Key Pattern Confluence: Elliott Wave Theory: The rally from the last major swing low is best counted as a powerful Wave 3. We are now likely in a late-stage Wave 5 or a complex corrective Wave 4. A decisive break below the key support at $118,000 would signal that Wave 4 correction is underway, targeting the 0.382 Fibonacci level near $110,000. Wyckoff Theory: Analysis suggests we may be in a Re-Distribution phase. The sharp rise (Upthrust) is being tested. A failure to hold above $120,000 with decreasing volume could confirm this, leading to a Sign of Weakness (SOW). Ichimoku Cloud (Daily): The price is far above the Kumo (Cloud), indicating a strong trend but also signaling an overextended market. The Tenkan-sen (blue line) is acting as dynamic support near $119,500. A break below this would be the first sign of weakening momentum. Head and Shoulders? A potential, large-scale bearish Head and Shoulders top is tentatively forming, with the left shoulder around $115k, the head at this peak (~$123k), and a potential right shoulder to form. This pattern would only be confirmed by a break below the neckline, which would be projected around $105,000. Swing Trading Key Levels: Resistance (R1): 124,200 (Recent High) Resistance (R2): 127,500 (Psychological & Gann Angle) Support (S1): 119,500 (Ichimoku Tenkan-sen) Support (S2): 118,000 (Critical Wave 4 Invalidation) Support (S3): 110,000 (0.382 Fib & Major Swing Zone) Swing Trade Idea: Scenario A (Bullish Continuation): Wait for a pullback to the S1 ($119,500) or S2 ($118,000) support confluence with bullish reversal candlesticks (e.g., Hammer, Bullish Engulfing). Enter long with a stop loss below S2, targeting R1 and R2. Scenario B (Bearish Reversal): If price rejects R1 and breaks below S2 ($118,000) on high volume, consider a short position for a swing down towards S3 ($110,000), with a stop loss above R1. Intraday Trading (5M, 15M, 1H) - Precision Execution Intraday Bias: Neutral to Cautiously Bullish, but highly volatile. Be nimble. Key Indicators & Patterns: Anchored VWAP (from yesterday's low): The price is trading above the VWAP, indicating a Weak Bullish intraday trend. A break below the VWAP would shift the intraday bias to bearish, targeting the lower Bollinger Band. Bollinger Bands (20,2) on 1H: The price is hugging the upper band, suggesting sustained buying pressure but also overbought conditions. A move to the middle band (20 SMA) around $121,200 is a likely intraday pullback target. RSI (14) on 1H: Reading is near 65. It is not severely overbought (>70), but shows room for a minor correction before the next leg up. Candlestick Patterns: Watch for Bearish Engulfing or Evening Star patterns at the R1 resistance for short signals. Conversely, Bull Flags or Bullish Hammers near the VWAP or 20 SMA provide long entry signals. Intraday Key Levels: Resistance (R1): 123,000 (Psychological) Resistance (R2): 123,800 (Today's High) Support (S1): 121,800 (Current Session Low) Support (S2): 121,200 (1H 20 SMA / Bollinger Midline) Support (S3): 120,500 (VWAP & Strong Intraday Support) Intraday Trade Plan for the Session: Long Entry: On a bounce from S2 ($121,200) with a bullish candlestick confirmation. Target: $122,500 - $123,000. Stop Loss: 20 pips below entry. Short Entry: On a rejection at R2 ($123,800) with a bearish candlestick confirmation, or a break below the VWAP (S3). Target: S2 ($121,200). Stop Loss: 20 pips above entry or R2. ⚠️ Critical Risk Analysis: Trap Formations Bull Trap: A classic bull trap is set if the price makes a swift, low-volume spike above $124,200 (R1), luring in late bulls, before sharply reversing to close below $120,000. The Wyckoff Re-Distribution scenario aligns with this risk. Bear Trap: A bear trap occurs if the price wicks down sharply, breaking below $118,000 (S2) and triggering stop losses, only to reverse aggressively and reclaim that level, squeezing shorts and fueling the next leg up. This would invalidate the bearish Elliott Wave 4 count. 📈 Indicator Snapshot & Confluence ✅ Conclusion & Final Outlook Bullish Case: The trend is your friend. The price remains above all critical moving averages and the Ichimoku Tenkan-sen. A hold above $118,000 opens the path for a test of $127,500. Bearish Case: The market is overextended. The potential for an Elliott Wave 4 correction, a Wyckoff Re-Distribution, or a large-scale Head and Shoulders pattern presents significant downside risk towards $110,000. Trading Recommendation: For swing traders, the risk/reward favors waiting for a pullback to stronger support zones ($118k-$119.5k) before entering new long positions, or waiting for a confirmed break of support to play the short side. For intraday traders, trade the range between the key levels defined above, using the VWAP and Bollinger Bands as dynamic guides. Position sizing and strict stop-losses are non-negotiable at these elevated levels.
sunya
تحلیل جامع S&P 500: آیا بازار در آستانه ریزش است؟ (پیشبینی دقیق تا اکتبر ۲۰۲۵)
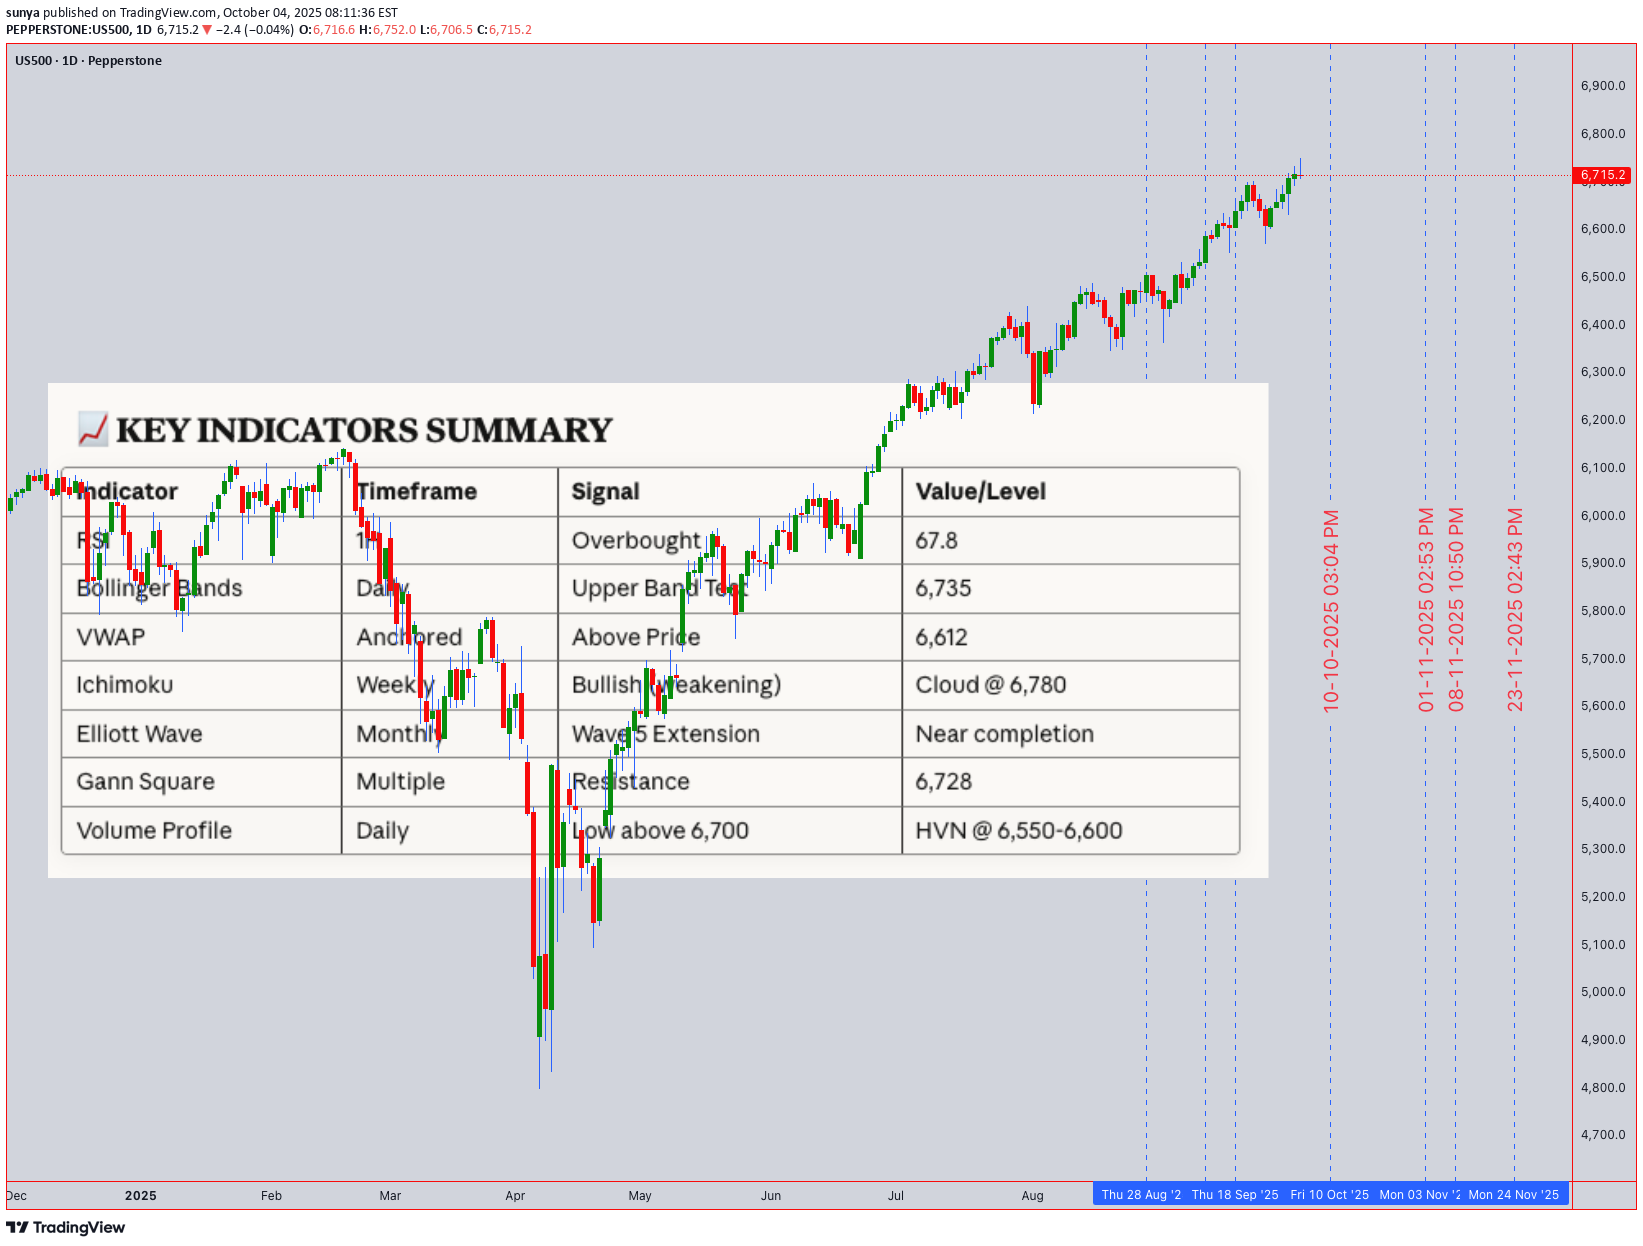
Current Price: 6,715.20 | Date: October 4, 2025 📊 MARKET OVERVIEW The S&P 500 is trading at 6,715.20, hovering near historical resistance zones. This analysis integrates multiple technical frameworks to provide actionable insights for both intraday and swing traders. 🔍 MULTI-TIMEFRAME TECHNICAL ANALYSIS Monthly & Weekly Perspective (Swing Trading) Elliott Wave Analysis: The index appears to be in a Wave 5 extension of a broader bullish impulse from the 2022 lows Monthly chart shows potential exhaustion signals as we approach the 6,750-6,800 resistance cluster Wave structure suggests a possible corrective phase (ABC) may initiate in Q4 2025 Ichimoku Cloud (Weekly): Price trading above the cloud - bullish structure intact Tenkan-sen (9): 6,682 | Kijun-sen (26): 6,591 Future Senkou Span projects resistance at 6,780-6,820 Key Support Levels (Swing): 6,620 - Kijun-sen weekly support 6,480 - 50-week EMA (critical long-term support) 6,350 - Monthly pivot & Wyckoff accumulation zone 6,180 - 200-week MA (major bull/bear line) Key Resistance Levels (Swing): 6,750 - Psychological resistance & Gann 1x1 angle 6,820 - Ichimoku cloud projection 6,945 - Fibonacci 1.618 extension from August lows Daily & 4-Hour Perspective Wyckoff Analysis: Current phase suggests late distribution (UTAD - Upthrust After Distribution) Volume declining on recent rallies - potential weakness Accumulation zone identified: 6,480-6,550 for re-entry Harmonic Patterns: Bearish Bat pattern forming on the 4H chart PRZ (Potential Reversal Zone): 6,740-6,760 Bearish divergence on RSI confirming pattern validity Bollinger Bands (Daily): Price at upper band (6,735) - overextended Band width expanding - increased volatility expected Middle band support: 6,580 Volume Analysis: VWAP (Anchored from September low): 6,612 Volume profile shows weak volume above 6,700 High volume node (HVN) at 6,550-6,600 - strong support Intraday Analysis (1H, 30M, 15M, 5M) Current Intraday Setup: RSI (Relative Strength Index): 1H RSI: 67.8 (approaching overbought) 15M RSI: 72.3 (overbought territory) Bearish divergence forming on 30M chart Moving Averages: Death Cross Warning: 50 EMA approaching 200 EMA on 4H chart 1H: 20 EMA (6,698) acting as immediate support 5M: Price oscillating around 50 EMA (6,712) Gann Analysis: Gann Square of 9: Next resistance at 6,728 (45° angle) Time cycle suggests potential reversal window: October 7-9, 2025 Price/Time square approaching - expect volatility spike Candlestick Patterns (Recent): Evening Star formation on 4H chart (bearish reversal) Long upper wicks on 1H chart - rejection at resistance Doji formation on daily - indecision 🎯 TRADING STRATEGIES INTRADAY TRADING SETUP (Next 5 Trading Days) Bearish Scenario (Higher Probability - 65%): Entry Zones: Primary Short Entry: 6,725-6,735 (upon rejection) Secondary Short Entry: 6,750-6,760 (if breakout fails - bull trap) Stop Loss: Above 6,775 (invalidation level) Profit Targets: TP1: 6,680 (20 EMA support - 1H) TP2: 6,650 (VWAP anchor) TP3: 6,620 (Kijun-sen weekly) TP4: 6,580 (Daily BB middle band) Risk-Reward Ratio: 1:3 minimum Confirmation Signals: Break below 6,700 with increased volume RSI crosses below 50 on 1H chart MACD bearish crossover on 30M Bullish Scenario (Lower Probability - 35%): Entry Zones: Long Entry: 6,680-6,690 (upon bounce from 20 EMA) Aggressive Long: 6,650-6,660 (VWAP retest) Stop Loss: Below 6,635 Profit Targets: TP1: 6,720 (resistance retest) TP2: 6,750 (psychological level) TP3: 6,780 (Ichimoku cloud resistance) Confirmation Signals: Volume surge on bounce RSI bullish divergence on 15M Break above 6,720 with strong momentum SWING TRADING SETUP (2-4 Week Outlook) Primary Strategy: SELL ON RALLY Phase 1 - Distribution (Current): Expect choppy price action between 6,680-6,750 Ideal swing short entry: 6,735-6,760 Stop loss: 6,820 Target: 6,480-6,550 (Accumulation zone) Time horizon: 2-3 weeks Phase 2 - Accumulation (Upcoming): Watch for bullish reversal patterns in 6,450-6,550 zone Potential H&S inverse or double bottom formation Long entry upon confirmation Target: 6,850-6,950 (Next impulse wave) Time horizon: 4-8 weeks ⚠️ RISK FACTORS & MARKET CONTEXT Trap Alert: Bull Trap Risk: HIGH above 6,750 Weak volume at resistance suggests false breakout potential Head and Shoulders pattern forming on 4H chart Bear Trap Risk: MODERATE below 6,650 Strong support zone with high volume profile Potential quick reversal if broken Geopolitical & Macro Factors: Fed policy uncertainty - rate decision impact expected mid-October Q3 earnings season beginning - volatility spike likely Geopolitical tensions may trigger safe-haven flows Seasonal October volatility historically present Volume Volatility Assessment: Current State: Declining volume on rallies (bearish) Expected: Volume spike at 6,750 resistance or 6,650 support Strong Trend Confirmation: Sustained volume >15% above 20-day average 🎯 TRADING PLAN SUMMARY For Next Week (Oct 4-11, 2025): Monday-Tuesday: Expect resistance at 6,725-6,735. Look for short opportunities on rejection. Wednesday-Thursday: Gann time cycle window - increased volatility. Watch for break of 6,700 or 6,750. Friday: Weekly close crucial - below 6,680 confirms bearish bias; above 6,750 invalidates short setup. Optimal Strategy: Sell rallies into 6,730-6,750 resistance Wait for confirmation - don't chase Manage risk strictly - volatile market conditions Scale into positions - don't enter full size immediately 💡 TRADER'S EDGE Pattern to Watch: The confluence of: Bearish Bat harmonic completion RSI divergence Wyckoff distribution phase Weak volume at resistance Gann time/price square Creates a HIGH-PROBABILITY SHORT SETUP at 6,735-6,760 Critical Levels This Week: Bull Control: Hold above 6,700 Bear Control: Break below 6,650 Decision Zone: 6,675-6,725 📝 DISCLAIMER This analysis is for educational purposes only. Trading involves substantial risk of loss. Always use proper risk management, never risk more than 1-2% of your capital per trade, and consider your own risk tolerance and trading plan. Past performance does not guarantee future results. Stay disciplined. Trade the plan. Manage your risk.
Sorumluluk Reddi
Sahmeto'nun web sitesinde ve resmi iletişim kanallarında yer alan herhangi bir içerik ve materyal, kişisel görüşlerin ve analizlerin bir derlemesidir ve bağlayıcı değildir. Borsa ve kripto para piyasasına alım, satım, giriş veya çıkış için herhangi bir tavsiye oluşturmazlar. Ayrıca, web sitesinde ve kanallarda yer alan tüm haberler ve analizler, yalnızca resmi ve gayri resmi yerli ve yabancı kaynaklardan yeniden yayınlanan bilgilerdir ve söz konusu içeriğin kullanıcılarının materyallerin orijinalliğini ve doğruluğunu takip etmekten ve sağlamaktan sorumlu olduğu açıktır. Bu nedenle, sorumluluk reddedilirken, sermaye piyasası ve kripto para piyasasındaki herhangi bir karar verme, eylem ve olası kar ve zarar sorumluluğunun yatırımcıya ait olduğu beyan edilir.