
aydinbirc
@t_aydinbirc

Ne tavsiye etmek istersiniz?
önceki makale
پیام های تریدر
filtre
aydinbirc
meme/usdt

1. Chart PatternTriangle Pattern: The price movement appears to be forming an ascending triangle pattern. This pattern typically indicates a potential breakout.Lower Trendline: There is an ascending support line where the price is consistently finding support.Upper Resistance Line: The resistance level is around 0.01235, which acts as a ceiling for the price.2. Support and Resistance LevelsSupport Levels:0.01114: A strong short-term support level.0.01098: A secondary support level below.Resistance Levels:0.01235: The key resistance level that needs to be broken for further upward movement.3. IndicatorsRSI (Relative Strength Index):The RSI graph below fluctuates between 30 and 70, indicating that the market is neither in an overbought nor oversold zone.The current RSI is near the mid-level, suggesting neutral momentum. An upward movemVolume:The 24-hour volume shown is 320.53 million.If the volume is low, the breakout from the triangle pattern might lack strength. A high-volume breakout would provide more reliability.4. Performance DataIn the performance section on the bottom right:1D (1 Day): +10.05% increase.1W (1 Week): -29.46% decrease.1M (1 Month): -17.19% decrease.This indicates a short-term recovery attempt within an overall bearish trend.5. General OutlookShort-Term Expectation:If the price holds above the 0.01114 support level and breaks upwards with significant volume, the next target would be the 0.01235 resistance level.Long-Term Risk:If the 0.01114 support level is broken to the downside, the price could drop further to 0.01098 or lower levels.
aydinbirc
MEME/USDT
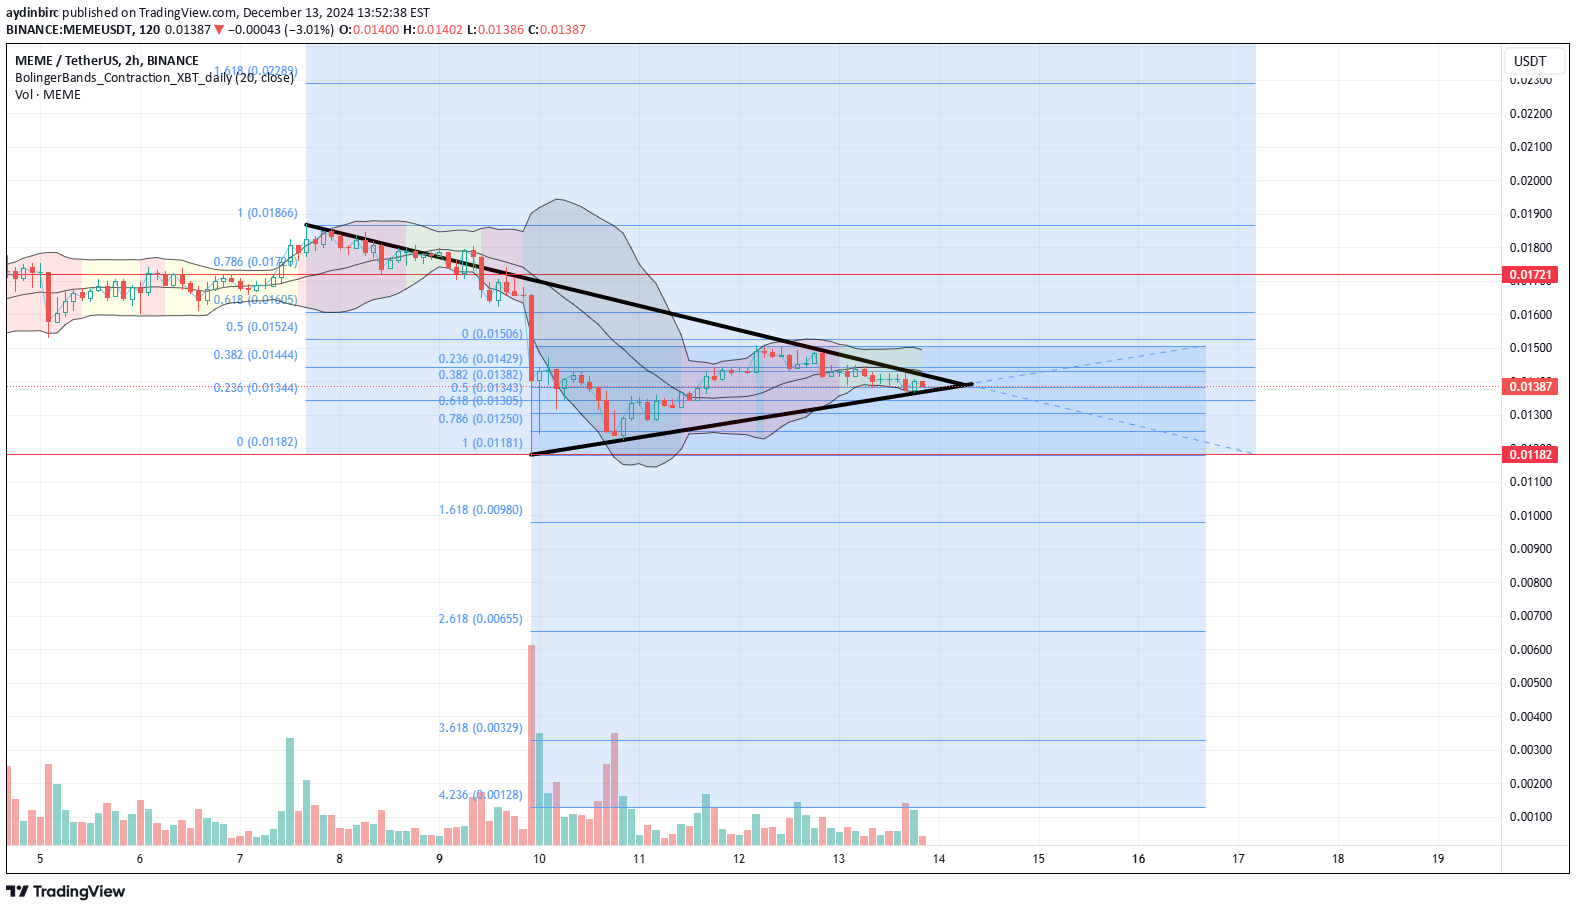
Symmetrical Triangle:The chart clearly shows a symmetrical triangle formation. This type of pattern typically indicates that the price is consolidating within narrowing ranges and a breakout (in either direction) is likely to occur.Symmetrical triangles can break out either upward or downward. To determine the breakout direction, pay attention to the trading volume.Fibonacci Levels:Fibonacci retracement levels are marked on the chart to identify potential support and resistance zones.Levels such as 0.786, 0.618, and 0.5 are highlighted, showing where the price might react.Key Support and Resistance:The lower boundary (around 0.0130) appears to act as support, while the upper boundary (around 0.0140) serves as resistance.If the price breaks above the upper triangle boundary with volume, it could test higher resistance levels. Conversely, a breakdown below the triangle may lead to a move towards lower support zones.Potential Scenarios:Bullish Scenario:If the triangle breaks upward, the target price is usually calculated as the height of the triangle added to the breakout point.Bearish Scenario:If the triangle breaks downward, the target price is typically the height of the triangle subtracted from the breakdown point.Suggestions:Watch the Volume:An increase in volume often confirms the strength of the breakout.Set a Stop-Loss:Place a stop-loss near the triangle's lower or upper boundary to manage risk.Use Additional Indicators:Tools like RSI or MACD can provide insights into trend strength and momentum.
aydinbirc
meme - usdt

1. Fibonacci LevelsThe chart shows the use of Fibonacci retracement levels:These levels are crucial for identifying potential support and resistance zones.Key levels visible on the chart:0.0140 (support level)0.0150 (resistance level)Currently, the price is trading around 0.01493, nearing the resistance zone. A breakout above 0.0150 could indicate bullish momentum.2. TrendlinesThe chart features a downward trendline and possibly an upward trendline:The price seems to be testing the downward trendline.If the price breaks and sustains above this trendline, it may signal the beginning of a bullish trend.3. Bollinger BandsBollinger Bands are visible on the chart, used to measure price volatility:The price is currently moving near the middle band.Upper Band: Acts as a potential resistance in case of an upward move.Lower Band: Provides support during downward movement.A contraction (tightening) of Bollinger Bands often indicates an upcoming breakout in either direction.4. Volume AnalysisThe volume bars indicate the strength of market moves:Current volume appears relatively low, suggesting a lack of strong momentum.A high-volume breakout is crucial to confirm any significant price movement.5. General Trend DirectionFrom the chart:Short-term recovery signals are visible, but the overall trend appears bearish.For an upward confirmation:The price must break and hold above 0.0150.Failure to do so may result in a pullback to the 0.0140 support zone.6. RecommendationsFor short-term trades:Watch for resistance around 0.0150—this could be a key selling point.Buying opportunities might emerge near the 0.0140 support zone.For long-term positions:Wait for a confirmed trend reversal and higher volumes before entering.A breakout of the downtrend and sustained trading above resistance levels is essential.
aydinbirc
SHIP/USDT 15 MİN

Fibonacci Retracement Levels:The chart displays key Fibonacci retracement levels, such as 0.236, 0.382, 0.618, and 0.786.The current price is at 0.00003195, very close to the 0.786 Fibonacci level (around 0.00003190). This level often acts as a significant support or resistance point.Marked Zones:Horizontal support and resistance levels are highlighted on the chart:0.00003272 appears to be a resistance level.0.00003086 is marked as a potential support level.The price seems to be consolidating near these zones.Potential Bearish and Bullish Scenarios:The price has tested the same resistance level twice, suggesting a double top formation, which could indicate a potential reversal.If the resistance is not broken, the price might retrace further to lower Fibonacci levels (e.g., 0.00003086 or lower).If the resistance is broken, the price could head toward the next target at 0.00003303.Indicators and Performance:On the bottom-right corner, the trading volume (14.7T) and daily price change (-0.06%) for SHIB/USDT are shown.The performance chart highlights percentage changes for different timeframes (e.g., +66.60% for the past week, while the daily performance is flat at -0.06%).
aydinbirc
MEME-USDT 15MİN

Symmetrical Triangle Formation:A symmetrical triangle indicates price consolidation and a potential breakout.If the price breaks upward, the bullish trend may continue.A downward breakout could indicate increased selling pressure.Support and Resistance Levels:Resistance levels: Around 0.01874, 0.01881, and 0.01887. These levels could act as targets in case of upward movement.Support levels: Around 0.01819 and 0.01783. These levels may act as safety nets during downward movements.Indicators and Current Trend:The price has increased by +9.47%, indicating positive momentum.Volume is relatively low (2.51B), so confirmation of a breakout will require an increase in trading volume.Recommendations:Watch the breakout direction: Breakouts from symmetrical triangles are often accompanied by a surge in volume.Use Stop-Loss: If you're planning to open a position, set your stop-loss below the support levels to minimize risks.Monitor Volume and News: Keep an eye on trading volume and any related market news before making a decision.
aydinbirc
AMP/USDT 15 MİN UPDATE

Fibonacci Levels: The chart shows Fibonacci retracement levels (0.236, 0.382, 0.5, 0.618, etc.), which often act as support and resistance zones for price movement.Price Movements:Current price is around 0.01130.Resistance is observed just below the 0.382 level (0.01135).Expected Movement:The blue line indicates a potential upward price movement. The first target aligns with the 0.618 Fibonacci level (around 0.01400).Support and Resistance:Support: 0.01100 level.Resistance: 0.01135, followed by 0.01400.Volume and Momentum:It's crucial to monitor volume and price response. If volume supports, the upward move might sustain.
aydinbirc
MEME/USDT 15MİN UPDATE

Chart Type: Analysis of MEME/USDT pair on a 15-minute time frame.Fibonacci Levels: Fibonacci retracement levels are applied, highlighting key points such as 0.236, 0.382, 0.5, 0.618, and 0.786.The price is currently hovering around the 0.618 level, a key support or resistance zone.If the price breaks upwards, targets like 1.0 (0.01777), 1.618 (0.01825), and 2.618 (0.01902) could be reached.Channel: The chart shows a rising channel, indicating an upward trend.If the price breaks below the lower boundary of the channel, a downward move might occur.Support and Resistance Levels:Support: 0.01688, 0.01651Resistance: 0.01749, 0.01777Possible Scenarios:If the price surpasses 0.01777, the bullish trend could strengthen further.If the price drops below 0.01688, selling pressure might increase, targeting 0.01630.
aydinbirc
MEME/USDT UPDATE 04/12

1. Conditions for a "W" PatternBottoms: A "W" pattern requires two significant lows. In this chart, the areas labeled (2) and (4) seem to fulfill this condition.Peak: The peak between the two lows, labeled (3), forms the neckline of the pattern.Breakout: The price must break above the neckline (around 0.01689) for the pattern to be confirmed. A breakout with strong volume is a bullish signal.2. Fibonacci LevelsThe chart includes Fibonacci retracement levels, which often act as support and resistance points.0.786 Level (0.01689): The neckline aligns with this level. If the price breaks above this, it could confirm the pattern.1.618 Target Level (0.01829): This is a potential target if the breakout occurs.3. Potential Targets and RisksIf the "W" pattern is activated, the first target can be calculated as the height of the pattern (distance between the neckline and the lowest point).However, if the price fails to break above the neckline and reverses downward, the pattern will be invalidated. In this case, support levels around 0.01575 or 0.01547 might come into play.ConclusionFor the "W" pattern to be confirmed, the price must break clearly above the 0.01689 level with strong volume.If this breakout occurs, the price could target 0.01829 first and potentially 0.02056 afterward.However, entering before the breakout carries higher risk. Stop-loss levels should be carefully set, with a possible stop below 0.01575 to manage downside risks.
aydinbirc
AMP/USDT

Key Observations:Fibonacci Retracement Levels:The 0.236 (0.008077), 0.382 (0.010161), 0.5 (0.011948), and 0.618 (0.013730) levels are visible on the chart. These are critical areas where the price may face resistance or find support.The 0.236 level currently acts as the closest resistance. The price seems to be approaching this zone.Trend Direction:The overall trend appears to be recovering after a long-term downtrend.There is a visible diagonal resistance (trendline) that has been drawn. This line might signal an area where the price could face selling pressure.Key Levels to Watch:Support Zone: Around 0.007 or slightly below. If the price falls, this level may provide support.Resistance Zone: 0.00807 (Fibonacci 0.236 level) is the first major resistance. A breakout above this level could see the price aiming for 0.01016 (Fibonacci 0.382 level).Volume and Momentum:Volume seems low relative to previous spikes, which might indicate consolidation before a significant move.If volume increases near resistance zones, a breakout becomes more likely.TP1 Level:A target price (TP1) is marked near 0.016181. This suggests a potential bullish scenario if the price continues climbing.Possible Scenarios:Bullish Scenario:A breakout above 0.008077 with strong volume could drive the price toward 0.01016 and potentially 0.01194.If the diagonal trendline resistance is also breached, the recovery trend could strengthen further.Bearish Scenario:If the price fails to break 0.008077, it may retrace back to 0.007 or even lower.A break below the support zone could signal further downside, targeting lower Fibonacci extensions.Suggestions:For Long Positions: Wait for a clear breakout above 0.008077 with strong volume confirmation.For Short Positions: Look for rejection near the 0.008077 resistance or a breakdown below the 0.007 support.Monitor momentum indicators like RSI or MACD to confirm potential reversals or continuation signals.
aydinbirc
MEME/USDT UPDATE

Fibonacci Levels:Fibonacci retracement levels such as 0.236, 0.382, 0.618, and 1.618 are marked on the chart. These levels are used to identify potential retracement or continuation points for the price.The price appears to have broken above the 0.618 level, indicating a potential bullish continuation.Trend Line:There seems to be a "cup formation," which is generally considered a bullish signal.The price is moving along an upward trendline, supporting the bullish momentum.Support and Resistance Levels:Key resistance levels include 0.01642, 0.02062, and 0.02437.Higher target levels are marked as TP1 (Take Profit 1), TP2, and TP3 (e.g., 0.03421 and 0.04411).Targets:Potential targets for the price are highlighted, with the highest target (TP3) at 0.04590.Before reaching these levels, the price might face resistance at intermediate levels.Risk Factors:If the price falls below the ascending trendline, a bearish trend might start.Losing Fibonacci support levels may result in a pullback to lower support zones.
Sorumluluk Reddi
Sahmeto'nun web sitesinde ve resmi iletişim kanallarında yer alan herhangi bir içerik ve materyal, kişisel görüşlerin ve analizlerin bir derlemesidir ve bağlayıcı değildir. Borsa ve kripto para piyasasına alım, satım, giriş veya çıkış için herhangi bir tavsiye oluşturmazlar. Ayrıca, web sitesinde ve kanallarda yer alan tüm haberler ve analizler, yalnızca resmi ve gayri resmi yerli ve yabancı kaynaklardan yeniden yayınlanan bilgilerdir ve söz konusu içeriğin kullanıcılarının materyallerin orijinalliğini ve doğruluğunu takip etmekten ve sağlamaktan sorumlu olduğu açıktır. Bu nedenle, sorumluluk reddedilirken, sermaye piyasası ve kripto para piyasasındaki herhangi bir karar verme, eylem ve olası kar ve zarar sorumluluğunun yatırımcıya ait olduğu beyan edilir.