
agatarigan
@t_agatarigan

Ne tavsiye etmek istersiniz?
önceki makale
پیام های تریدر
filtre
The 3-Method Framework: Simplifying Technical Analysis
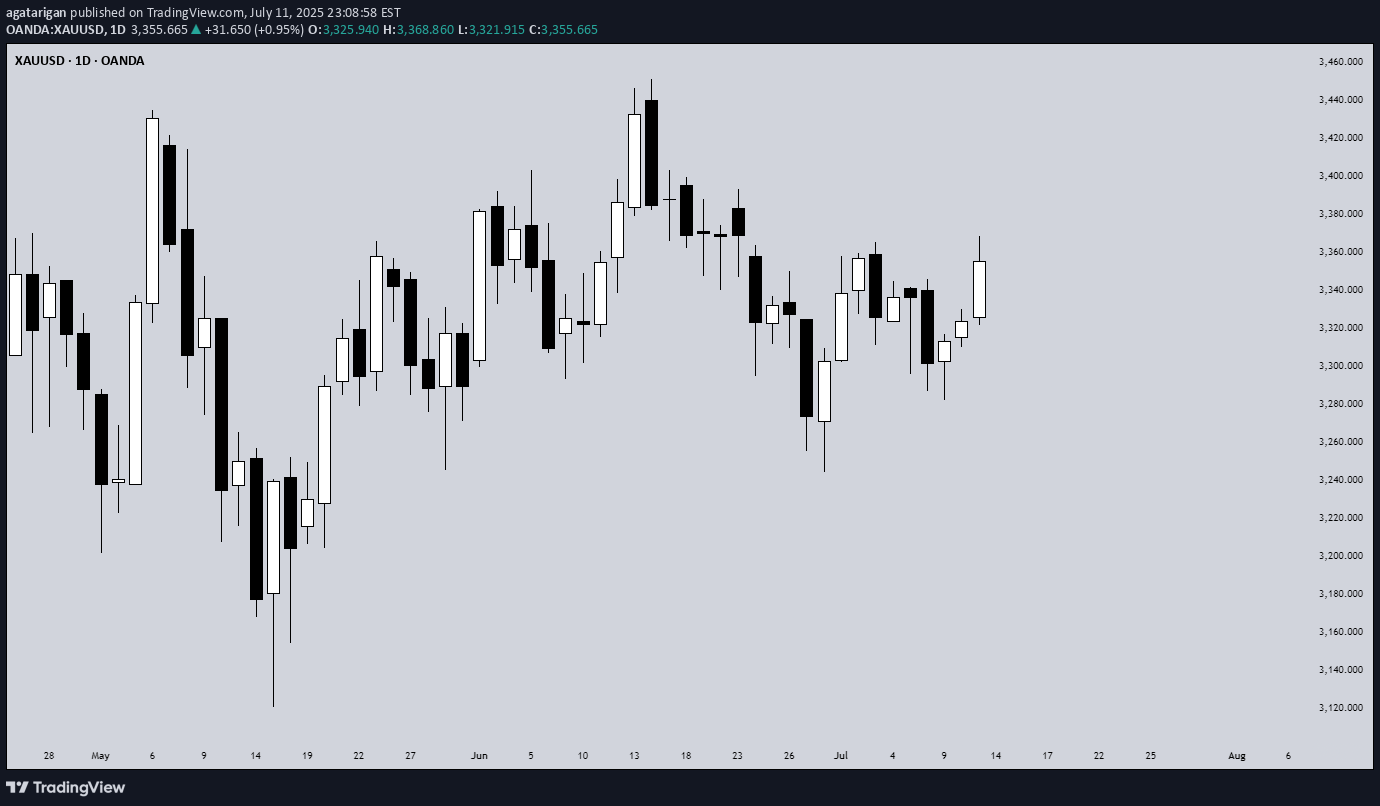
Most traders get caught up in complex indicator setups, thinking that more tools equal better results. We rely on moving averages to tell us if prices are trending up or down, and we depend on support and resistance levels to predict market movement. But what if I told you there's a simpler, more powerful way to read the market using pure price action? Today, I want to share my experience and understanding of bias and expectations for the next candle formation. This approach is refreshingly simple because we don't need to understand every single price movement - we just need to focus on what matters most. Method 1: Opening Price Comparison The first method is beautifully straightforward. For a bullish bias, the current opening price should be above the previous opening price. That's it. Sounds almost too simple, right? But simplicity often holds the greatest power in trading. For Gold yesterday, we simply needed to compare the latest opening price on the Daily timeframe with the previous opening price. It's that simple. Method 2: Mid-Level Analysis The second approach involves comparing mid-levels between candles. We compare the mid-level of the previous candle with the mid-level of the candle before that. I know it might sound a bit complicated when explained this way, but once you visualize it on your chart, the concept becomes crystal clear. Still on Gold, we just compare the 50% or mid-level of the previous candle with the candle two periods back from the latest candle on the daily chart. Method 3: Expansion Expectations The third method helps us anticipate expansion in price. Traditional complex methods require analyzing numerous factors, but this simplified approach only needs two candles before the current one. Here's how it works: we use the high and low of the candle two periods back, and the open and close (body) of the previous candle. If the previous candle's body sits within the high-low range of the two-candle-back formation, we can expect price expansion. The beauty of this method is that we don't care whether the price is bullish or bearish - we simply expect expansion to occur. Think of it like a compressed spring: when price gets squeezed within a previous range, it often seeks to break out in either direction. We're not predicting the direction, just the likelihood of significant movement. Still on Gold, I randomly selected all inside candles on the Daily timeframe. Remember, the purpose is only to expect expansion, not direction. If you want to use this for directional bias, make sure you apply the additional analysis required. Remember, there are no guarantees in trading, but this method provides valuable insight into potential market expansion. Advanced Combinations for Enhanced Analysis Combining Methods 1 and 2 creates our most accessible approach since you only need two candles. When both the opening price and mid-point from two candles ago indicate bullish conditions, we can expect the current candle to follow an OLHC bullish pattern. You can see the 3 examples I've provided in the image, and all of these are applicable across all timeframes, both daily and 4-hour. Combining all three methods offers a more sophisticated analysis, particularly useful for anticipating market reversals. This involves marking the current and previous opening prices, comparing mid-levels from the last two candles, and identifying the high/low range from two to three candles back. Now I'm adding Inside Candles from 2-3 periods back (My personal rule is maximum 3 candles before the current candle, or this analysis will lead to analysis paralysis). The Bullish and Bearish Rules Bullish Rule 1: Opening price above the previous opening price Mid-level of the previous candle above the mid-level of the previous candle before that. Inside candle formation (optional) Bearish Rule 1: Opening price below the previous opening price Mid-level of the previous candle below the mid-level of the previous candle before that. Inside candle formation (optional) The Secret Sauce: Timeframe Harmony Here's where the "devil is in the details" comes into play. You might find perfect bullish conditions on your chart, but the market still reverses. The secret lies in using this method on Daily and 4-hour timeframes simultaneously. Simply understand it from the chart. Simply understand it from the chart. If Rule 1 conditions are met on the daily chart, they must also align on the 4-hour chart. When the 4-hour contradicts the daily, follow the 4-hour signal as it might indicate a "sell on strength" or "buy on weakness" scenario. The formula is simple: [Daily Rule 1] must align with [4-Hour Rule 1] I've never tested this on 1-hour charts because the Daily and 4-hour combination provides sufficient accuracy for my trading approach. Enhanced Rules for Precision Rule 2 makes the inside candle formation mandatory rather than optional. Sometimes you'll encounter mixed signals where the mid-level suggests one direction while the opening price suggests another. The solution? Drop down to a lower timeframe for additional confirmation. I don't recommend using this method below the 4-hour timeframe, but you can certainly apply it to Monthly or Weekly charts for long-term bias determination. The key is analyzing both Daily AND 4-hour timeframes together, not just one or the other. When timeframes conflict, often just one key level provides the confirmation you need - typically a previous Monthly or Weekly high or low. Final Thoughts Pure price action mastery isn't about having the most sophisticated setup or the most indicators on your chart. It's about understanding the fundamental relationship between opening prices, mid-levels, and candle formations across meaningful timeframes. This approach has served me well because it cuts through market noise and focuses on what price is actually telling us. Start with these three methods, practice identifying the patterns, and gradually build your confidence in reading pure price action. Remember, consistent profitability comes from mastering simple, reliable methods rather than chasing complex strategies. Keep practicing, stay disciplined, and let price action guide your trading decisions. Good Luck! :)
Is It Possible to Predict Market Direction with Certainty?

Birisi bana piyasa hareketlerini kesin olarak tahmin etmeyi sordu. Büyük emirleri tespit etme ve piyasa yönünü tahmin etme sorusuna yanıt olarak, piyasaların gerçekten nasıl işlediğini ve bir tüccar olarak nasıl büyüyeceğini keşfedelim. Piyasa hareketi pazarlarının doğası bireysel emirler değil, kolektif davranışlarda ilerliyor. Duygu göstergeleri kısa/uzun pozisyonlar arasında yaklaşık 50:50 bölünme gösterse bile, piyasalar yine de bir yönde güçlü bir şekilde eğilim gösterebilir. Neden? Çünkü piyasa hareketi şunlara bağlıdır: Ticaretin yürütme büyüklüklerinin emirlerin saldırganlığı (piyasa emirleri ve sınır emirleri) zamanlaması ve kitlesel davranışları etkileyen dağıtım psikolojik faktörleri: BTCUSD'yi görünüşte dengeli bir duygu ile hayal edin. Bununla birlikte, uzun pozisyonlar öncelikle pasif sınır emirleri ise, şortlar sıkı duraklarla agresif piyasa emirleridir, fiyat "dengeli" oranına rağmen keskin bir şekilde düşebilir. Piyasa, milyonlarca katılımcıdan oluşmaktadır: farklı analiz yöntemleri arasında değişen zaman dilimleri (uzun vadeli yatırımcılara scalpers) çeşitli motivasyonlar (riskten korunma, spekülasyon, yatırım) Aynı Newsreal-dünya örneğine benzersiz tepkiler: major FOMC toplantıları gibi haber olayları sırasında Fiyatların her iki yönde de şiddetli bir şekilde sallandığını görür. Neden? Çünkü aynı bilgilerle bile, tüccarlar farklı olarak yorumlanır ve tepki verir: portföy ihtiyaçları toleranslı toleransa yöneltme TimframeOverall piyasa görüntüleme, daha iyi ticaret habitsinstead'i kesinlik arayışı, iyi ticaret alışkanlıkları geliştirmeye odaklanır: 1. Risk Yönetimi Firstuse uygun pozisyon boyutlandırma (ticaret başına% 1-2'den fazla risk), rasgele sayılara göre değil, teknik seviyelere göre durakları ayarlayın. Potansiyel kârın potansiyel LosStget 1: 2 Risk-Ödülü'nü aştığı işlemler için asimetrik returnSaim Minimum örnekte: 100 $ risk alıyorsa, minimum hedefiniz 200 $ kar olmalıdır. Stratejide tutarlılık - diğer stratejiler çekici görünse bile ticaret planınıza sadık kalın - tüm işlemleri belgeleyin ve düzenli olarak gözden geçirin - Örnek: Kurulum, giriş, çıkış ve ders öğrenilen dersler ile bir ticaret dergisi tutun 4. Piyasa Analizi ile Her Günü İyi HabitsStart Oluşturma major Haberler ve Potansiyel Etki Seti Ticaret Ticaretinden Önce Ticaret Gözden Geçirmeden Önce Giriş Programı Programı: - 8:00 AM: Piyasa Genel Bakış - 8:30: Potansiyel Kurulumları Gözden Geçirme - 09:00 : Haber etkinliklerini kontrol edin-16:00: Gün sonu incelemesi Kaçınılması için Tuzaklar. Strateji Hoppingswitch Stratejileri Sıklıkla farklı yaklaşımlara sahip birden fazla tüccar izleyen son performanslara dayanarak: en az 3 ay boyunca bir yaklaşımı taahhüt eder2. Sıkıntı veya Fomozolution'dan aşırı işlem yapımı işlemleri: Günlük/Haftalık Ticaret Sınırları ayarlayın3. Kayıpları kurtarmak için intikam alımı hızlı bir şekilde: Kayıplardan sonra bir mola verin, neyin yanlış gittiğini gözden geçirin: Piyasa ne istediğinizi umursamıyor. Bireysel arzulara değil, kolektif eyleme dayalı hareket eder. Ticaretteki başarınız, ne kadar bildiğinizle değil, bildiklerinizin tutarlı, disiplinli alışkanlıklarla ne kadar iyi uyguladığınıza göre belirlenmez.
Awal Terjunnya Harga Emas atau Awal ATH Baru?

Önceki analizim tahminimin fiyatla ilgili olduğunu belirtti XAUUSD altın fiyatında en yakın hedef olan 2426.530'a, ardından şu anda fiyata göre kırılan ve yeni high veya yeni ATH haline gelen Eski High'a olan artıştır. Bu sefer Altın, fiyata saygı duyulmayan ve IFVG yapan +FVG ile kanıtlandığı gibi oldukça güçlü bir fiyat reddi sağladı. Bu da 16-23 Mayıs 2024 tarihleri arasında yaşandı. Benim beklentim "fiyat nereye gidecek?" diye sorulduğunda cevabım en yakın hedefte olacaktır. Bundan sonra, Premium Array fiyata direnç gösterirse ve fiyat yeni bir düşük seviyeye ulaşırsa, en yakın Satış Tarafı Likiditesi büyük olasılıkla bir sonraki fiyat hedefi olacaktır. Bu analizdeki son hedefim grafiğin alt kısmında yer alan Satış Tarafı Likiditesidir. Aylık zaman dilimini açarsanız FVG'den Satış Tarafı Likiditesi Düşük olur ve bu muhtemelen uluslararası finans kurumları için giriş seviyesi olarak kullanılır. Uluslararası Finans Kuruluşlarından biri olan Credit Agricole açısından bakıldığında durum yine bir önceki fikirde aktardığım gibi, Altın hala favori çünkü onlara göre Forex iyi gitmiyor (elde tutma süreleri uzun olabilir). milyonlarca dolara varan fonları nedeniyle 1 aydan fazla). Bu analizdeki sonuç, fiyat indirimi beklentisidir. XAUUSD 2380'deki ilk hedefe kadar (aralığın %50'si). Daha fazla düşüş için hala data'nin önümüzdeki birkaç gün içinde görünmesini bekliyorum. Yayınladığım fikirleri okuduğunuz için teşekkür ederim, ada sorularınız varsa lütfen doğrudan yorumlardan sorun; bu bilgilerin sizin için yararlı olabileceğini umuyorum. 😁 Mutlu ticaret ve iyi şanslar!
Sorumluluk Reddi
Sahmeto'nun web sitesinde ve resmi iletişim kanallarında yer alan herhangi bir içerik ve materyal, kişisel görüşlerin ve analizlerin bir derlemesidir ve bağlayıcı değildir. Borsa ve kripto para piyasasına alım, satım, giriş veya çıkış için herhangi bir tavsiye oluşturmazlar. Ayrıca, web sitesinde ve kanallarda yer alan tüm haberler ve analizler, yalnızca resmi ve gayri resmi yerli ve yabancı kaynaklardan yeniden yayınlanan bilgilerdir ve söz konusu içeriğin kullanıcılarının materyallerin orijinalliğini ve doğruluğunu takip etmekten ve sağlamaktan sorumlu olduğu açıktır. Bu nedenle, sorumluluk reddedilirken, sermaye piyasası ve kripto para piyasasındaki herhangi bir karar verme, eylem ve olası kar ve zarar sorumluluğunun yatırımcıya ait olduğu beyan edilir.