
SinerjiPortfoy
@t_SinerjiPortfoy

Ne tavsiye etmek istersiniz?
önceki makale
پیام های تریدر
filtre
SinerjiPortfoy
تحلیل زورا (ZORA): آیا حمایت ۰.۰۸۴ شکسته میشود؟ پیشبینی نزولی تا کجا ادامه دارد؟
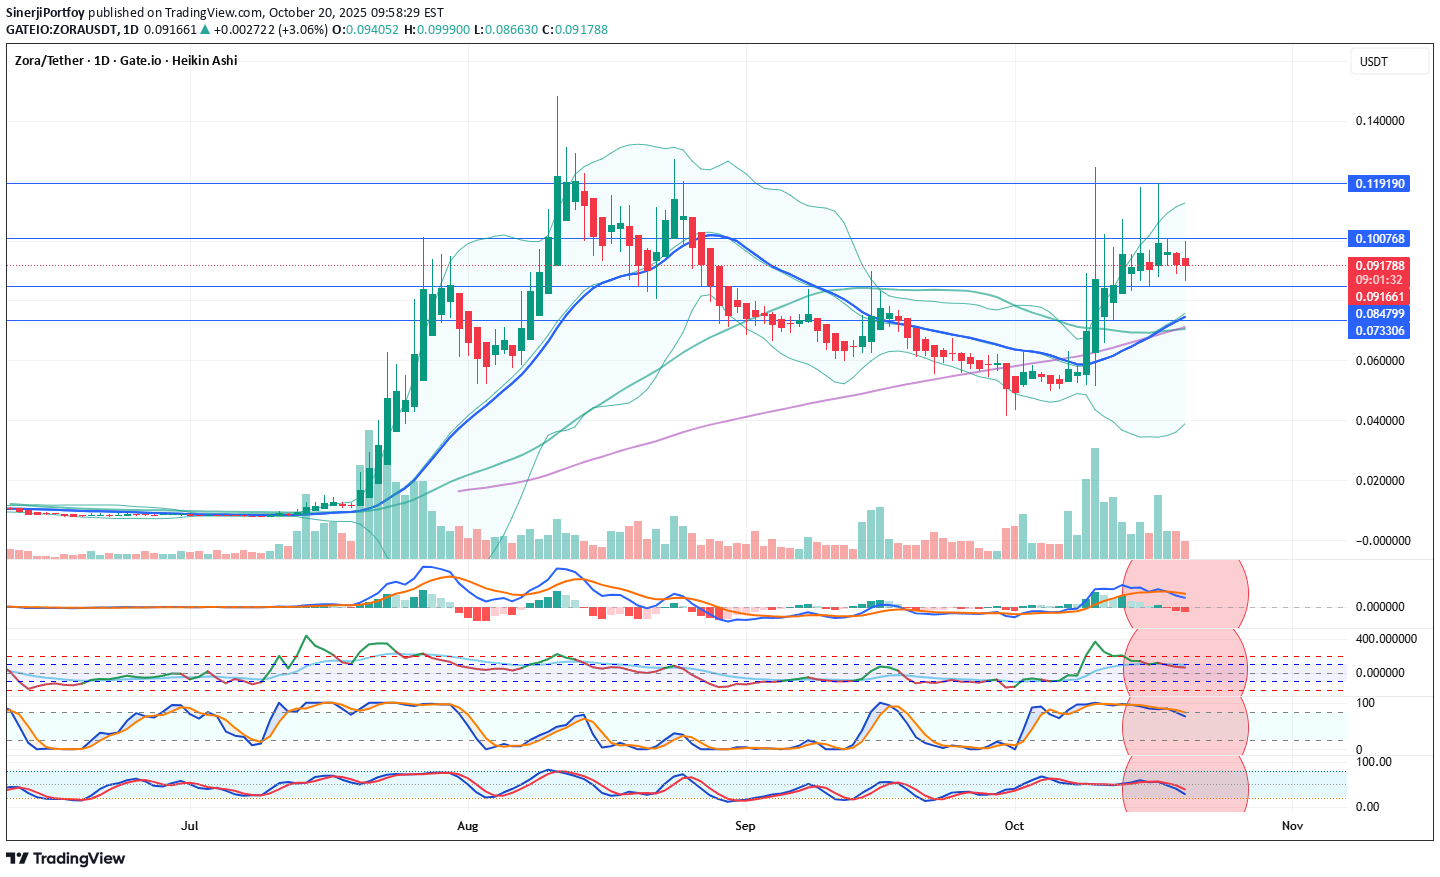
ZONAUSDT Coin Analysis and Commentary ZORA Coin indicators are currently in a negative condition. In the daily technical outlook, selling pressure is expected to continue. In a possible pullback, the 0.08479 support level will be monitored. If this level is broken downward, a decline toward the 21-day moving average (0.074807) may occur. If the price stabilizes around this average, it could create an opportunity for another upward move in the coming weeks. In a potential positive scenario, the 0.100768 resistance level is significant, and the price must break above it. Due to the negative indicators, our overall outlook for ZORA Coin remains bearish. Resistance: 0,100768 - 0,119190 Support: 0,084799 - 0,73306 We’d appreciate it if you could boost our posts and share them on your social media. 🚀 Legal Disclaimer: The information, comments, and recommendations contained herein do not constitute investment advice. Investment advisory services are provided only within the framework of an investment advisory agreement to be signed between the investor and authorized institutions such as brokerage firms, portfolio management companies, and non-deposit banks. The opinions expressed here are personal views and may not be suitable for your financial situation, risk profile, or return preferences. Therefore, no investment decisions should be made based solely on the information and opinions presented on this page.
SinerjiPortfoy
تحلیل و پیشبینی قیمت سکه ZORA (ZONAUSDT): آیا زمان خرید فرا رسیده است؟
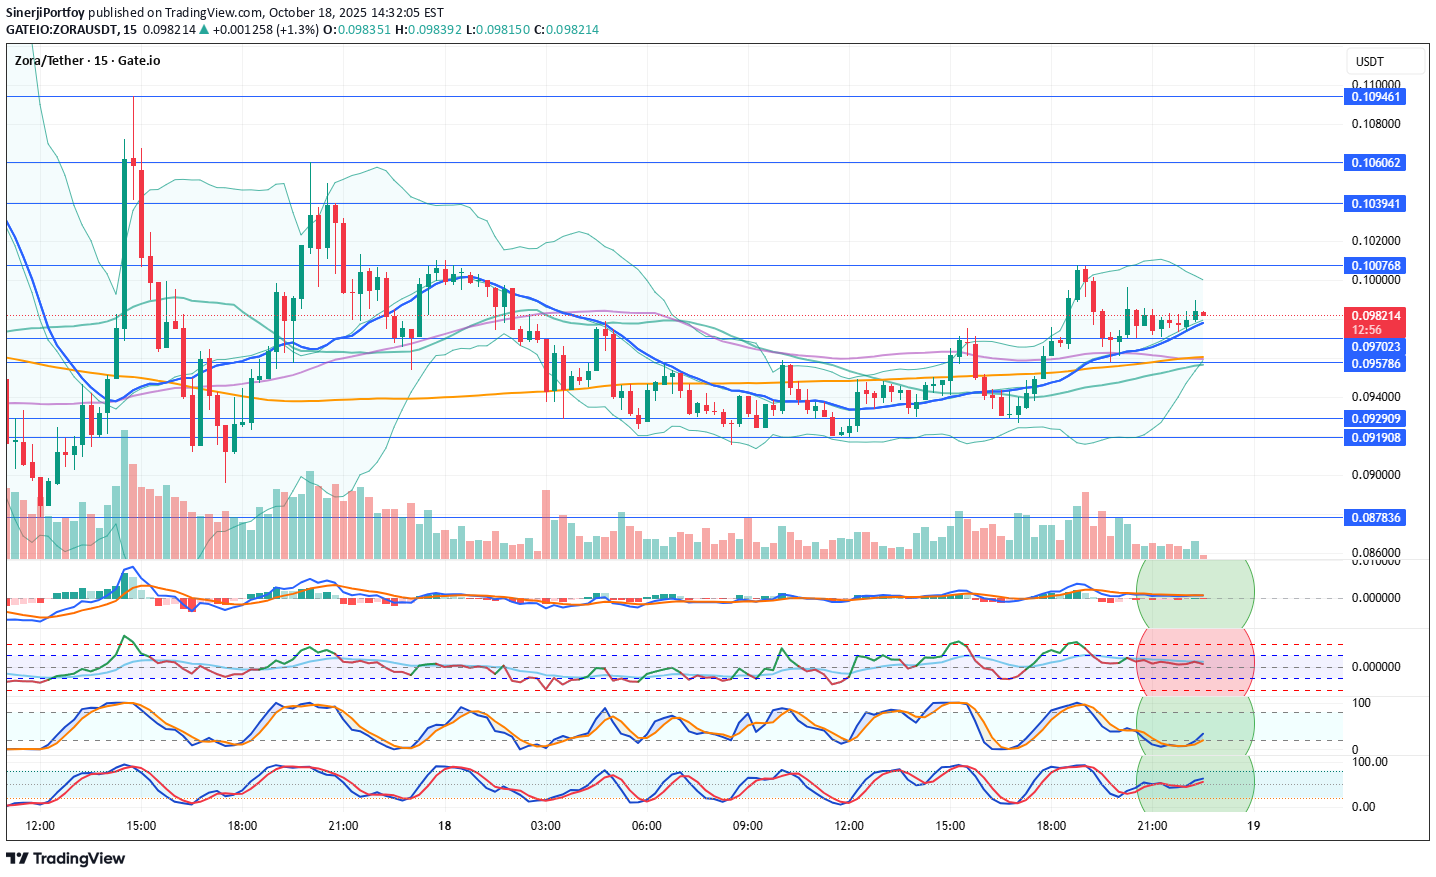
ZONAUSDT Coin Analysis and Commentary ZORA Coin has broken above its 21-hour moving average (0.097681) on the 15 min. technical chart. Indicators appear to have turned positive. If the support holds, upward price movements may occur. Resistance: 0.103941 – 0.100768 Support: 0.097023 – 0.095786 We’d appreciate it if you could boost our posts and share them on your social media. 🚀 Legal Disclaimer: The information, comments, and recommendations contained herein do not constitute investment advice. Investment advisory services are provided only within the framework of an investment advisory agreement to be signed between the investor and authorized institutions such as brokerage firms, portfolio management companies, and non-deposit banks. The opinions expressed here are personal views and may not be suitable for your financial situation, risk profile, or return preferences. Therefore, no investment decisions should be made based solely on the information and opinions presented on this page.
SinerjiPortfoy
تحلیل فوری ارز زورا (ZORAUSDT): فشار فروش بالا رفت؛ منتظر چه سطوحی باشیم؟
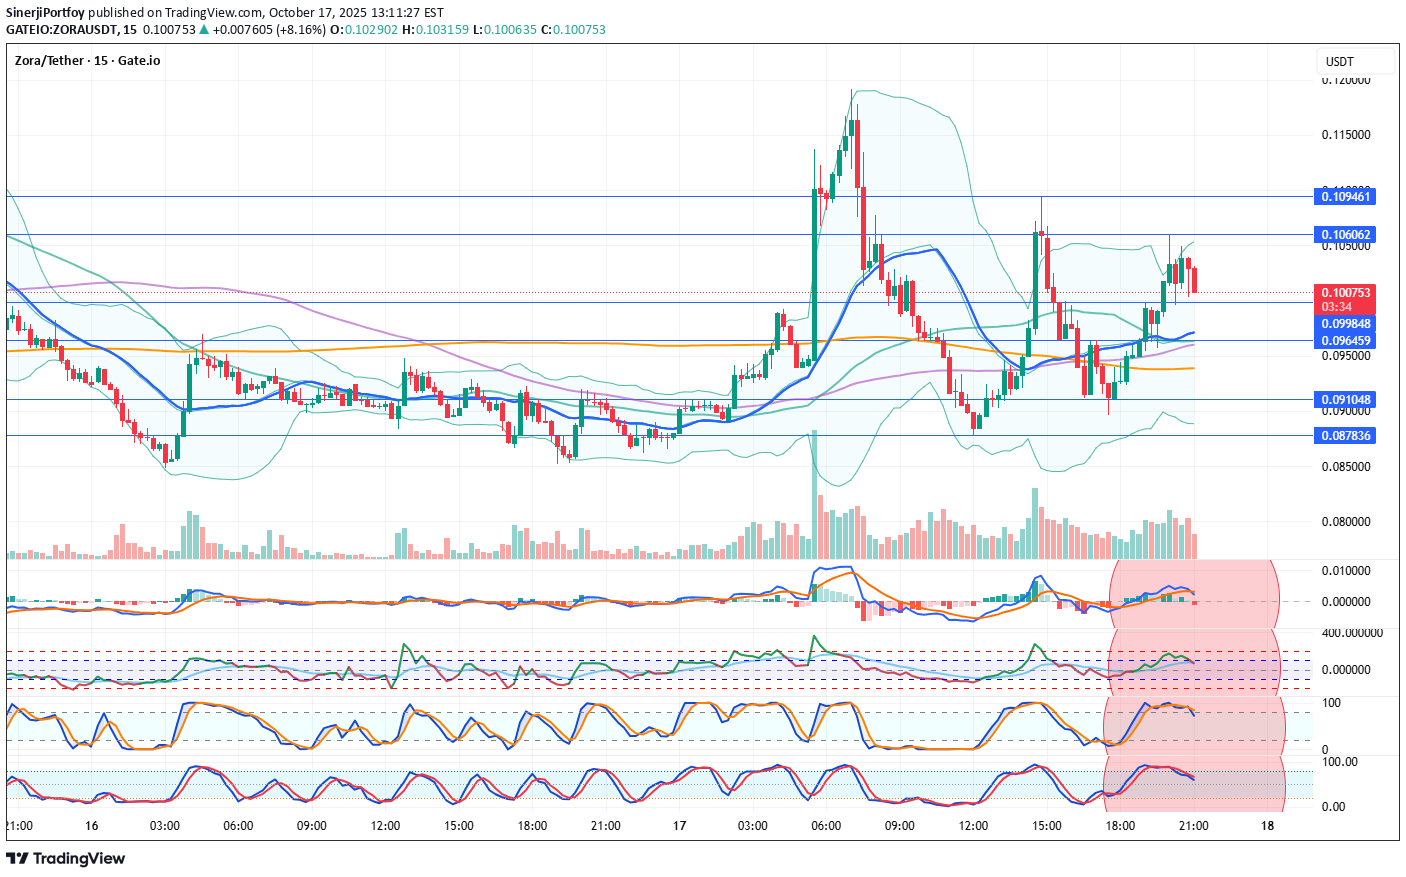
ZORAUSDT Coin Analysis and Commentary Indicators for Zora Coin are currently negative. On the 15-minute technical chart, selling pressure is increasing. The coin has turned downward from the 0.106 resistance level, entering a negative phase. Additional selling may occur in the short term. In this situation, support levels will be closely monitored. Resistances: 0.106062 – 0.109461 Supports: 0.099848 – 0.096459 – 0.091048 – 0.087836 We’d appreciate it if you could boost our posts and share them on your social media. 🚀 Legal Disclaimer: The information, comments, and recommendations contained herein do not constitute investment advice. Investment advisory services are provided only within the framework of an investment advisory agreement to be signed between the investor and authorized institutions such as brokerage firms, portfolio management companies, and non-deposit banks. The opinions expressed here are personal views and may not be suitable for your financial situation, risk profile, or return preferences. Therefore, no investment decisions should be made based solely on the information and opinions presented on this page.Analysis closed because time passed. Analysis moved in the expected direction
SinerjiPortfoy
تحلیل تکنیکال زورا (ZORA/USDT): آیا این ارز آماده صعود است؟ (سطوح حمایت و مقاومت کلیدی)
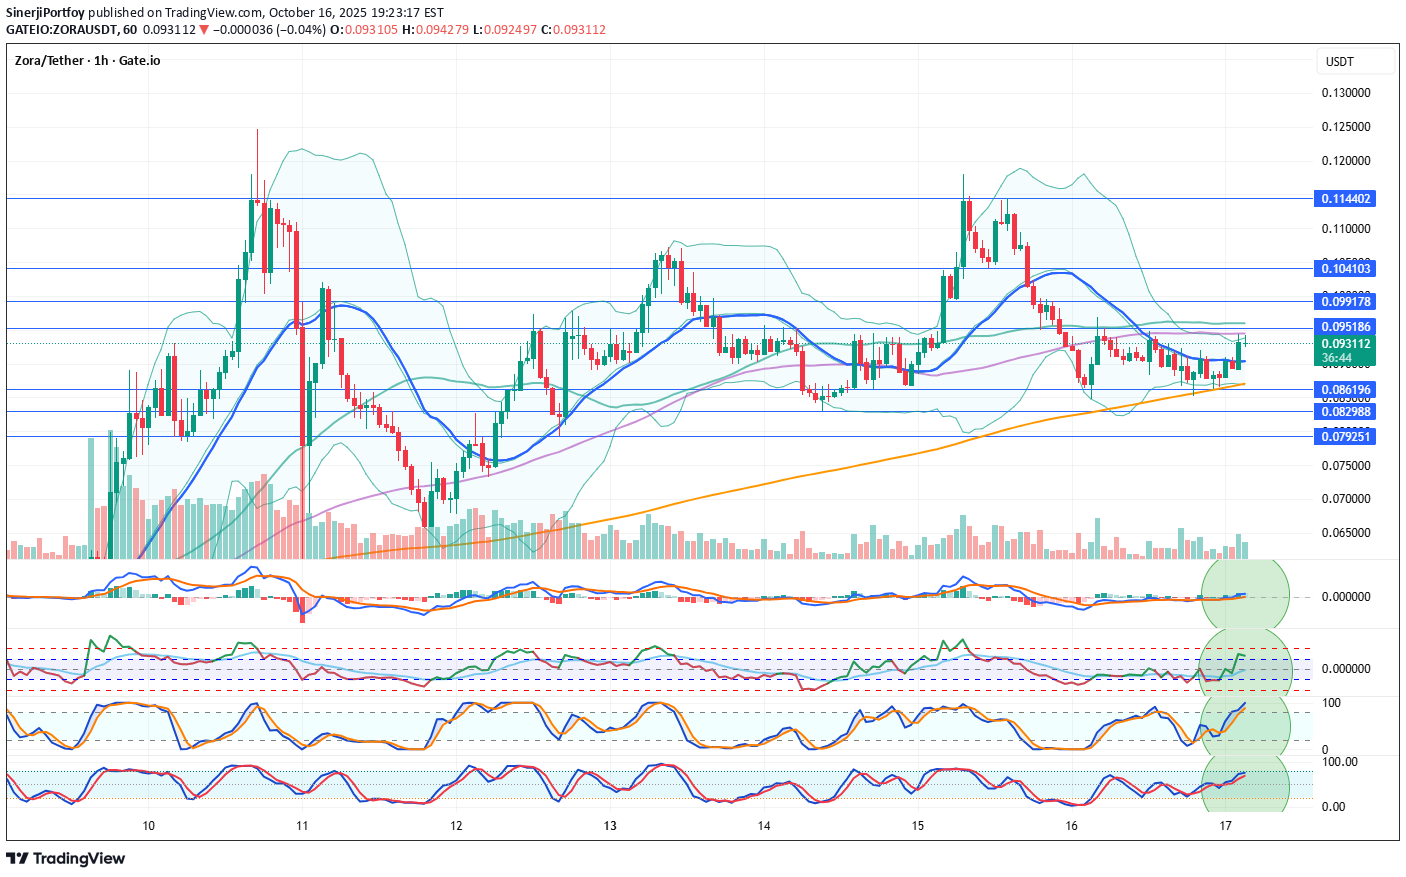
ZONAUSDT Coin Analysis and Commentary ZORA Coin has broken above its 21-hour moving average (0.090380) on the 1-hour technical chart. Indicators appear to have turned positive. If the support holds, upward price movements may occur. Resistance: 0.095186 – 0.099178 – 0.104103 – 0.114402 Support: 0.086196 – 0.082988 – 0.079251 We’d appreciate it if you could boost our posts and share them on your social media. 🚀 Legal Disclaimer: The information, comments, and recommendations contained herein do not constitute investment advice. Investment advisory services are provided only within the framework of an investment advisory agreement to be signed between the investor and authorized institutions such as brokerage firms, portfolio management companies, and non-deposit banks. The opinions expressed here are personal views and may not be suitable for your financial situation, risk profile, or return preferences. Therefore, no investment decisions should be made based solely on the information and opinions presented on this page.
SinerjiPortfoy
تحلیل اونس طلا (XAUUSD): آیا حباب در اوج است؟ هشدار سقوط بزرگ!

XAUUSD Altın Hisse Analiz Yorum Günlük teknik indikatörler tepe seviyesinde Pozitif. Altın onsunda aşırı yükselişler devam ediyor. Bu tarz yükselişler zamanı geldiğinde kâr satışlarıyla sert düşüş yaşanabilmekte. Altın Bollinger bandının en üst seviyesinde. Zirve fiyatında. 200 ve 100 günlük fiyat ortalamalarının (3234 - 34692) çok uzağında. 21 günlük fiyat ortalamasının (3799) bile uzağında. Yükselişlerin ne kadar daha devam edebileceğini bilemeyiz fakat fazla yükselişlerde düşüş riski çok yükselir altında bu riskin içinde teknik olarak. Olası bir düşüş te ise 3791 desteği olan 21 günlük fiyat ortalamasına kadar bir düzeltme ihtimali yaratabilir. Ayrıca dünya geneli ons altın yıl bazında baktığımızda aşırı yükselmiş durumda Geçmiş verilerde 1977 yılına giderek orada yaşanan aşırı yükselme ve uzun vade düşüşleri görebilirsiniz. Dikkat edilmesini öneriyoruz. Herkesin dilinde olan bir yükseliş var. Bu bir yerde doyuma ulaşacak ve yerini hüsrana bırakabilecek bir durum. Kısaca bir hisseye en tepe seviyesinden girmek gibi bir şey Dirençler: 4059 Destekler: 3897 - 3791 - 3707 Paylaşımlarımızı roketlerseniz seviniriz. Sosyal hesaplarınızda da paylaşmayı unutmayın. Yasal Uyarı: Burada yer alan bilgi, yorum ve tavsiyeler yatırım danışmanlığı kapsamında değildir. Yatırım danışmanlığı hizmeti, aracı kurumlar, portföy yönetim şirketleri, mevduat kabul etmeyen bankalar ile müşteri arasında imzalanacak yatırım danışmanlığı sözleşmesi çerçevesinde sunulmaktadır. Bu sayfada yazılanlar sadece kişisel görüşlerdir. Bu görüşler, mali durumunuz ile risk ve getiri tercihlerinize uygun olmayabilir. Bu nedenle bu sayfada yer alan bilgi ve yazılara dayanarak yatırım yapılmamalıdır.Altında şuan indikatörlerini Negatife çevirmiş gözüküyor. Beklentiler dahilinde kâr satış baskısı giderek arttığını görüyoruz. Bu durum Darphane Altın Sertifikası olan ALTIN.S1 de negatiflik daha ağır bastığını görüyoruz. Yatırım tavsiyesi değildir.
SinerjiPortfoy
XAUUSD Spot Altın Analiz Yorum
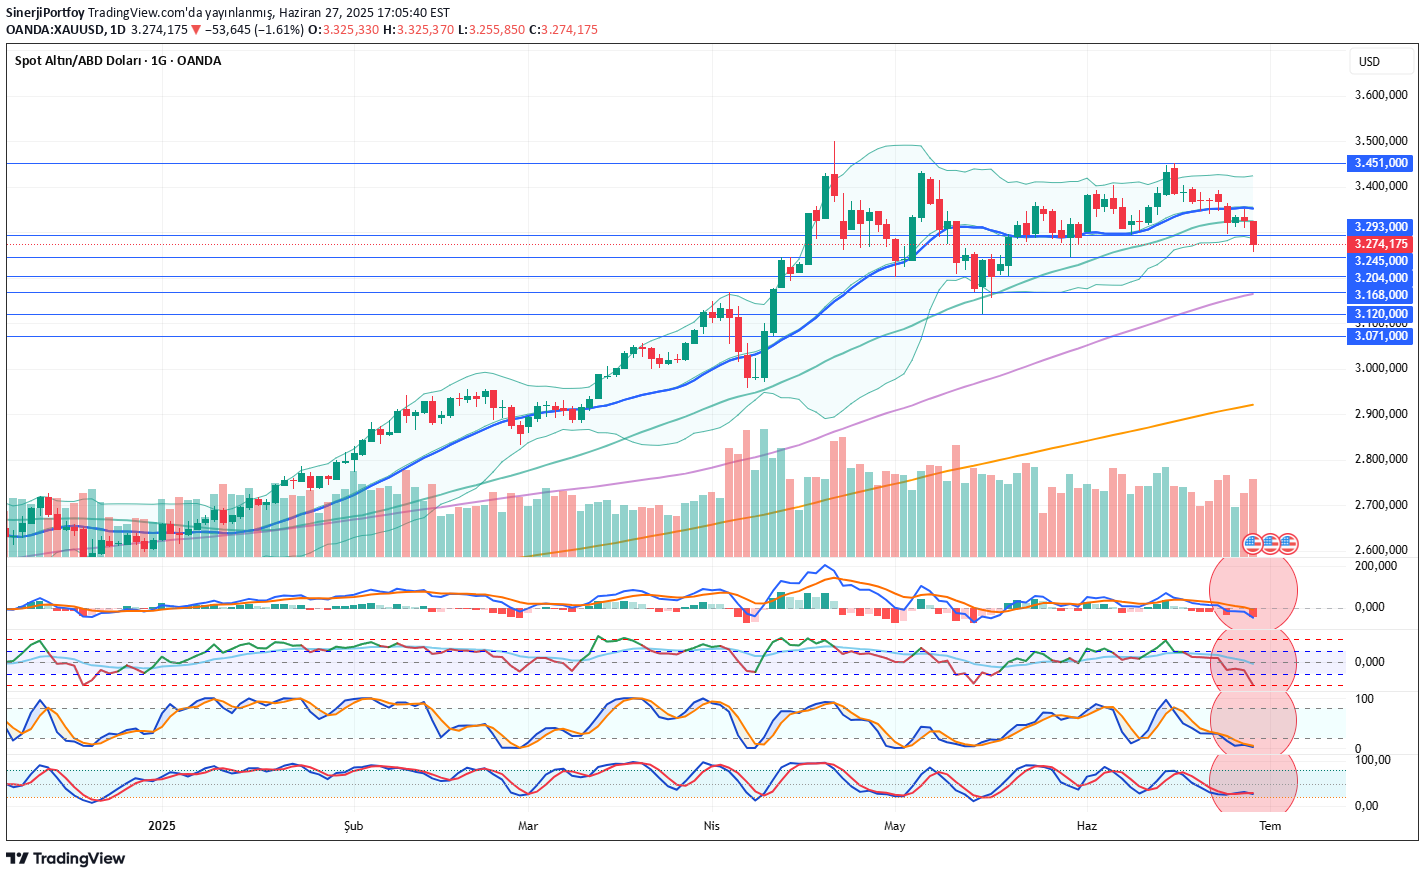
XAUUSD Spot Altın Analiz YorumGünlük teknik indikatörler Negatif. 50 günlük ortalamasını da aşağı kıran Spot Altında satış riski devam ediyor. 100 günlük fiyat ortalamasına kadar inme ihtimalini düşünüyoruz. Uzun süre çıkan altın da 3168 desteğine kadar inme ihtimali olabilir. Haftalık teknikte de durum negatif devam etmektedir.Dirençler: 3293 - 3451Destekler: 3245 - 3204 - 3168 - 3120Paylaşımlarımızı roketlerseniz seviniriz. Sosyal hesaplarınızda da paylaşmayı unutmayın.Yasal Uyarı:Burada yer alan bilgi, yorum ve tavsiyeler yatırım danışmanlığı kapsamında değildir. Yatırım danışmanlığı hizmeti, aracı kurumlar, portföy yönetim şirketleri, mevduat kabul etmeyen bankalar ile müşteri arasında imzalanacak yatırım danışmanlığı sözleşmesi çerçevesinde sunulmaktadır. Bu sayfada yazılanlar sadece kişisel görüşlerdir. Bu görüşler, mali durumunuz ile risk ve getiri tercihlerinize uygun olmayabilir. Bu nedenle bu sayfada yer alan bilgi ve yazılara dayanarak yatırım yapılmamalıdır.
SinerjiPortfoy
PIUSDT Daily Technical Analysis

PIUSDT Daily Technical AnalysisPi Network Coin Indicators Are POSITIVE.The price has broken above the 21-day moving average and successfully held above it. Currently, Pi Network appears to be targeting the $0.905 resistance level. After a wave of profit-taking, its recovery has increased the likelihood of continued positive price action. Resistance levels will be monitored closely. Indicators have turned positive from lower levels and are now pointing upward.Resistance Levels: 0.900 – 0.963 – 0.999Support Levels: 0.830 – 0.810 – 0.787Positive news from the Pi Network team could support further upward price movement. Accumulating Pi Network Coin at these price levels for long-term investment might be considered potentially profitable. However, the decision is entirely yours. This is not financial advice. In the long run, Pi Network Coin may test the $3 levels again — or it might remain at a lower price range.NOT FINANCIAL ADVICEThe information, commentary, and suggestions provided here do not constitute investment advice. Investment advisory services are offered only through a formal agreement with authorized institutions such as brokerage firms, portfolio management companies, or non-deposit banks.The content on this page reflects personal opinions only. These views may not align with your financial situation or your risk and return preferences. Therefore, investment decisions should not be made solely based on the information provided here.If you’d like to stay updated on our technical analyses — whether positive or risky — please follow and like us. We’d really appreciate your support!
SinerjiPortfoy
PIUSDT Günlük Teknik Analiz

PIUSDT Günlük Teknik AnalizPi Network Coin İndikatörler POZİTİF.21 günlük fiyat ortalamasını yukarı kırmış ve üzerinde kalmayı başarmış durumda. Pi Network şuan 0,905 direncine yönelmiş gözüküyor. Kâr satışından sonra tekrar toparlanması Pi Coinde olumlu fiyat hareketlerinin devam etme ihtimalini yükseltmiş durumda. Dirençler takip edilecektir. İndikatörler alt konumdan yukarı yönde pozitif olmuş durumda.Dirençler: 0,900 - 0,963 - 0,999 Destekler: 0,830 - 0,810 - 0,787Pi Netwok coin ekibinden gelecek yeni ve olumlu haberler fiyatın yukarı çıkmasını destekleyebilir. Bu fiyat seviyelerinden uzun vade yatırım için pi network coin toplamak kazançlı olma ihtimalini düşünebiliriz. Karar size aittir. Yatırım tavsiyesi değildir. Uzun vade de pi network coin tekrar 3 $ seviyelerini test etme ihtimali de olabilir. Veya düşük bir fiyatta da kalabilir.YATIRIM TAVSİYESİ DEĞİLDİR.Burada yer alan bilgi, yorum ve tavsiyeler yatırım danışmanlığı kapsamında değildir. Yatırım danışmanlığı hizmeti,aracı kurumlar, portföy yönetim şirketleri, mevduat kabul etmeyen bankalar ile müşteri arasında imzalanacakyatırım danışmanlığı sözleşmesi çerçevesinde sunulmaktadır. Bu sayfada yazılanlar sadece kişisel görüşlerdir.Bu görüşler, mali durumunuz ile risk ve getiri tercihlerinize uygun olmayabilir. Bu nedenle bu sayfada yer alan bilgi ve yazılara dayanarak yatırım yapılmamalıdır.Teknik indikatörleri olumlu veya riskli olan analizlerimizi kaçırmamak için bizi takip eder ve beğenirseniz çok seviniriz.
SinerjiPortfoy
PIUSDT Daily Technical Analysis

PIUSDT Daily Technical AnalysisPi Network Coin indicators are POSITIVE.It has broken above the 21-day moving average and managed to stay above it.The announcement that the Pi Network team will make about its ecosystem on May 14th could significantly benefit the project and increase activity around the cryptocurrency.Resistance: 0.79028 - 0.90433 - 1.05080Support: 0.68164 - 0.57126 - 0.55010New and positive news from the Pi Network team could support a price increase.At these levels, accumulating Pi Network Coin for long-term investment could be considered potentially profitable. The decision is yours. This is not investment advice.In the long run, there is a possibility that Pi Network Coin could retest the $3 levels.For users who use the Pi app and hold locked Pi Network Coins, if there is no urgent need, they may consider re-locking their coins for another 2 weeks. They can continue this strategy by monitoring the price every two weeks.In the long term, the probability of the price reaching much better levels remains high.THIS IS NOT INVESTMENT ADVICE.The information, comments, and suggestions here do not fall under investment advisory services. Investment advisory services are provided under an agreement between clients and authorized institutions such as brokerage firms, portfolio management companies, and non-deposit banks.The content of this page reflects only personal opinions.These views may not be suitable for your financial situation or your risk and return preferences. Therefore, investment decisions should not be made based solely on the information and content on this page.We’d appreciate it if you could follow and like us so you don’t miss our analyses with positive or risky technical indicators.
SinerjiPortfoy
ALPACAUSDT HourlyTechnical Analysis

ALPACAUSDT HourlyTechnical AnalysisAlpaca Finance Coin indicators are POSITIVE.The coin saw a strong upward movement following the news of its delisting from Binance. High returns continue in this cryptocurrency. Alpaca Coin, which experiences periodic price surges, is currently priced near its 21-day moving average. Due to low liquidity, it exhibits sharp price movements, making it a favorite among short-term traders.While it appears calm at the moment, we believe Alpaca Finance may resume its upward trend over time.If it breaks above the 21-day moving average, the 0.254 resistance level will be the next target.In the case of sharp sell-offs, the 0.160 support level will be monitored.Based on 2-week price movements, Alpaca has shown returns of 558% - 285% - 93% - 110% - 106% - 61% at various points.This is a high-risk cryptocurrency. This is not investment advice.Resistances: 0.254 - 0.260 - 0.268 - 0.279 - 0.306 - 0.314 - 0.345 - 0.372 - 0.410Supports: 0.220 - 0.205 - 0.160THIS IS NOT INVESTMENT ADVICE.The information, comments, and suggestions here do not constitute investment advisory services. Investment advisory services are provided under a formal agreement between clients and licensed institutions such as brokerage firms, portfolio management companies, and non-deposit banks.The content on this page reflects only personal opinions. These opinions may not be suitable for your financial situation or your risk and return preferences. Therefore, investment decisions should not be made solely based on the information and commentary provided on this page.We’d appreciate it if you follow and like us so you don’t miss our analyses with positive or risky technical indicators.
Sorumluluk Reddi
Sahmeto'nun web sitesinde ve resmi iletişim kanallarında yer alan herhangi bir içerik ve materyal, kişisel görüşlerin ve analizlerin bir derlemesidir ve bağlayıcı değildir. Borsa ve kripto para piyasasına alım, satım, giriş veya çıkış için herhangi bir tavsiye oluşturmazlar. Ayrıca, web sitesinde ve kanallarda yer alan tüm haberler ve analizler, yalnızca resmi ve gayri resmi yerli ve yabancı kaynaklardan yeniden yayınlanan bilgilerdir ve söz konusu içeriğin kullanıcılarının materyallerin orijinalliğini ve doğruluğunu takip etmekten ve sağlamaktan sorumlu olduğu açıktır. Bu nedenle, sorumluluk reddedilirken, sermaye piyasası ve kripto para piyasasındaki herhangi bir karar verme, eylem ve olası kar ve zarar sorumluluğunun yatırımcıya ait olduğu beyan edilir.