
DOCTOR_PIPS05
@t_DOCTOR_PIPS05

Ne tavsiye etmek istersiniz?
önceki makale
پیام های تریدر
filtre
DOCTOR_PIPS05
تحلیل طلا (XAU/USD): طلای داغ در آستانه صعود به سوی ۴۱۰۰ دلار!
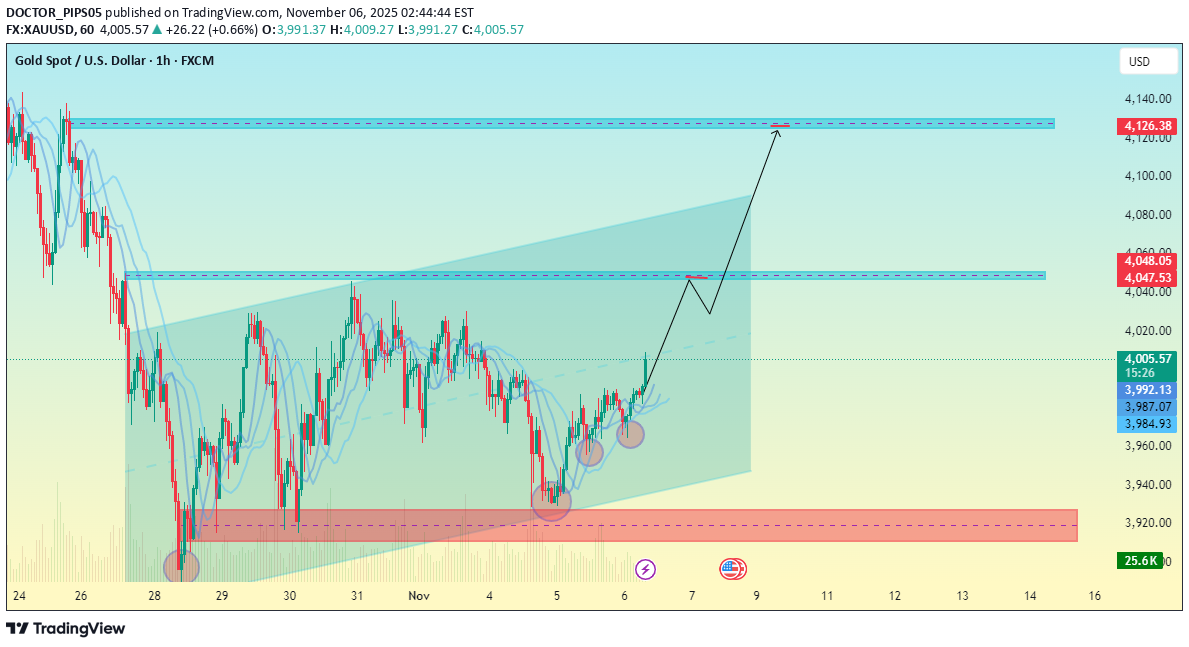
Grafiğe Genel Bakış Güncel Fiyat: Yaklaşık 4.007$ Yapı: Grafik, bir kanalın içinde yatay movement bir süre sonra oluşan yükseliş yönlü bir dönüş modelini göstermektedir. Vurgulanan Temel Seviyeler: Destek Bölgesi: 3.920$ – 3.940$ civarında (altta pembe renkle işaretlenmiştir). Bu alan birçok kez fiyatı korudu ve güçlü bir talep bölgesi oluşturdu. İlk Direnç / Kâr Alma Bölgesi: 4.045-4.050 Dolar civarında (ortadaki mavi kutu). İkinci Direnç / Nihai Hedef Bölge: Yaklaşık 4.125 – 4.130 Dolar (üstteki mavi kutu). 📈 Öngörülen Move Grafik yükseliş yönlü bir kırılma paterni gösteriyor: 1. 3.920$ civarındaki desteğin reddedilmesi. 2. Orta direnç seviyesi olan 4.045 dolara doğru yükseliş devam ediyor. 3. Nihai hedefin 4.125 dolar civarında olması öngörülüyor. Bu move, daha yüksek bir yüksek ve daha yüksek bir düşük yapıyla aynı hizada olup, fiyatın 4.000 doların üzerinde kalması durumunda yükseliş momentumunun potansiyel olarak devam edeceğine işaret ediyor. ⚠️ Seviyeleri İzle Geçersiz Kılma: 3.920 doların altında bir kırılma ve kapanış, yükseliş senaryosunu geçersiz kılabilir ve düşüş baskısını yeniden ortaya çıkarabilir. Teyit: 4.050 doların üzerinde güçlü bir kapanış, 4.125 dolar bölgesine doğru yükselişin devam ettiğini teyit edecek.
DOCTOR_PIPS05
تحلیل DOT/USDT: آیا فرصت خرید در حمایت $2.45 شکل گرفته است؟ (پیشبینی صعود تا $3.00)
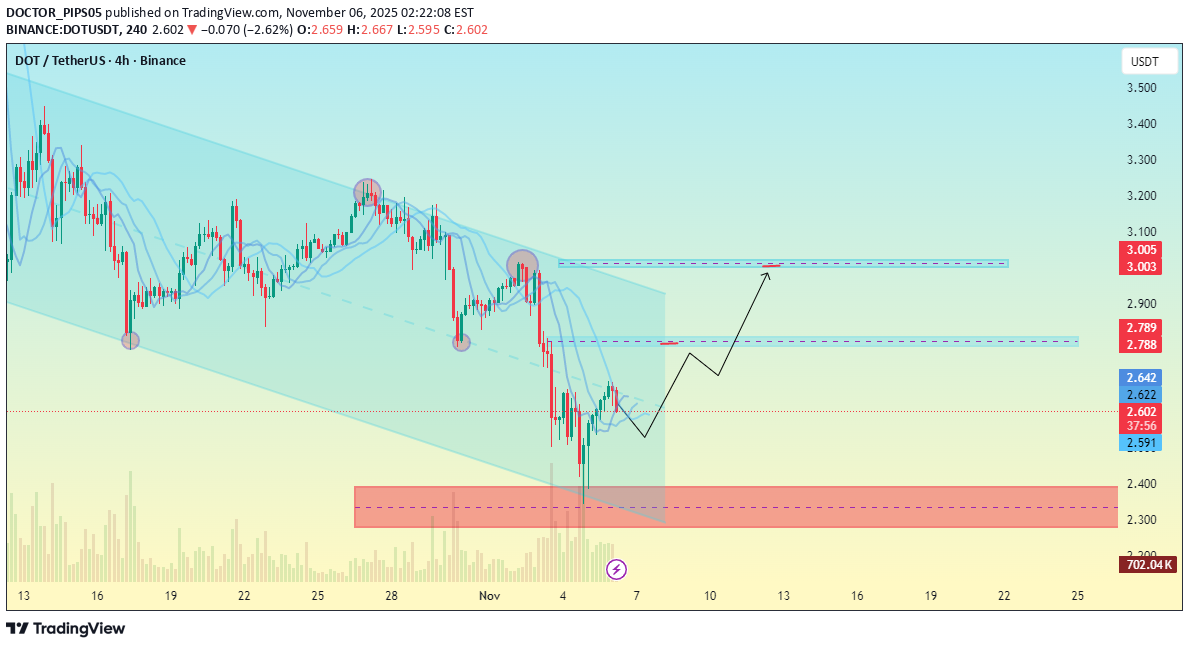
Genel Yapı: Fiyat alçalan bir kanal içinde hareket ediyor, daha düşük yüksekler ve daha düşük dipler oluşturuyor; açık bir düşüş trendi modeli. Güncel Fiyat Bölgesi: 2,60 dolar civarında, yakın zamandaki en düşük seviyenin hemen üzerinde. Destek Bölgesi (Pembe Kutu): Yaklaşık 2,35 – 2,45 $ arası, fiyatın daha önce sıçradığı güçlü bir talep alanına işaret ediyor. Projeksiyon: Grafik, kanalın alt sınırından potansiyel bir yükseliş düzeltmesini veya geri dönüşünü gösteriyor. Çizilen projeksiyon, önce 2,78 – 2,79 Dolar direncine doğru bir move yükselişi, ardından önceki en yüksek ve üst kanal sınırıyla aynı hizada olan 3,00 – 3,01 Dolar’a potansiyel bir genişlemeyi gösteriyor. Temel Direnç Seviyeleri: 2,78 Dolar – 2,79 Dolar: Kısa vadeli direnç, olası reaksiyon bölgesi. 3,00 Dolar – 3,01 Dolar: Güçlü direnç bölgesi; Burada bir kırılma trendin tersine döndüğünü doğrulayabilir. Temel Destek Seviyeleri: 2,59$–2,60$: Anında yerel destek. 2,35 $ – 2,45 $: Daha güçlü destek bölgesi (pembe renkle işaretlenmiştir). 📊 Özet: Analiz, fiyatın 2,50 doların üzerinde kalması koşuluyla destek bölgesinden 2,78 dolara ve muhtemelen 3,00 dolara** doğru potansiyel bir yükseliş toparlanması olduğunu gösteriyor. Eğer 2,45 doların altına düşerse yükseliş görünümü zayıflayacak.
DOCTOR_PIPS05
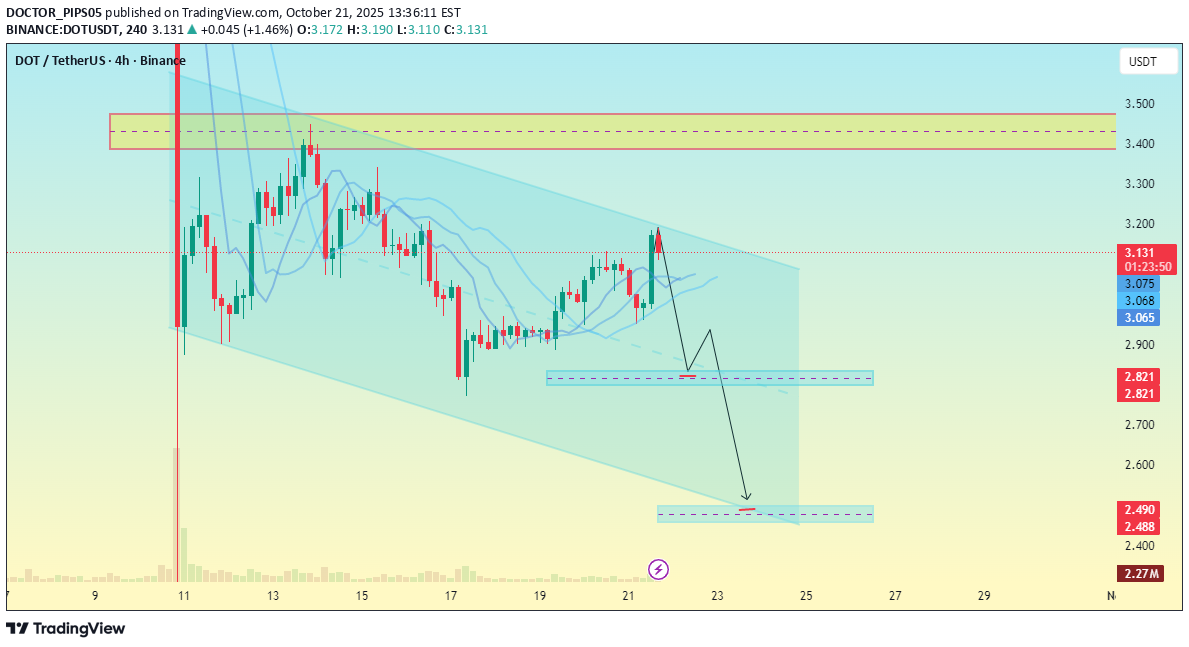
تحلیل تکنیکال DOT/USDT: آماده ریزش به کدام کف قیمتی؟

Genel Yapı Grafik azalan bir kanalı gösteriyor; fiyat hem üst hem de alt trend çizgisi sınırlarına uyuyor. Şu anki fiyat kanalın orta aralığına yakın, 2,79 dolar civarında. 🟣 Anahtar Bölge (Direnç) 3,20-3,30 dolar arasındaki pembe/kırmızı bölge major arz/direnç alanıdır. Fiyat düşmeden önce orada birçok kez tepki gösterdi. Oklar, o bölgeden başka bir ret beklediğinizi gösteriyor. 🔻 Düşüş Senaryosu (Projeksiyonunuz) Yansıtılan move şunu gösterir: 1. 3,00 – 3,20 Dolara doğru bir geri çekilme, muhtemelen dirence doğru. 2. Daha sonra kanal trendini takip ederek aşağıya doğru bir tersine dönüş. 3. İlk hedef: 2,63$ – 2,64$ bölgesi (yerel destek alanı). 4. Genişletilmiş hedef: Kanalın alt sınırına yakın 2,37$ – 2,37$ bölgesi. 📊 Piyasa Bağlamı Fiyat 3,00-3,20 doların altında kaldığı sürece momentum aşağı yönlü hareket ediyor. Güçlü hacimle 3,30 doların üzerine çıkmak, düşüş eğilimini geçersiz kılabilir ve 3,50 doların üzerinde bir alan açabilir. ⚙️ Özet SeviyeTürüBeklenti 3,20$–3,30$Direnç / ArzPotansiyel ret bölgesi 2,63 Dolar – 2,64 Dolar Destek 1İlk düşüş hedefi $2,37Destek 2Son düşüş hedefi 3,30$'ın üzerinde bir çıkışTrendin tersine dönmesi mümkün
DOCTOR_PIPS05
پیشبینی صعودی بیت کوین: آیا BTC به هدف ۱۲۲ هزار دلاری میرسد؟
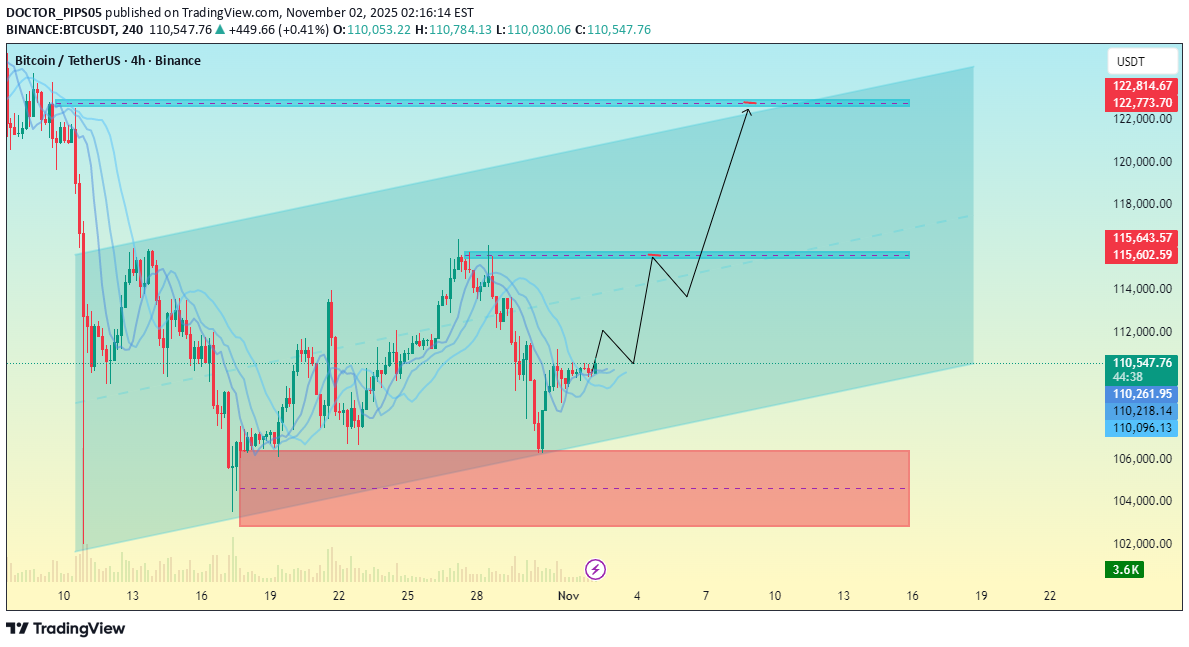
Fiyat: 110.600 dolar civarında, yukarı doğru yükselen bir kanalda işlem görüyor (mavi renkle işaretlenmiş). Destek bölgesi: Pembe kutu kabaca 104.000-106.000 dolar civarında olup, güçlü bir talep alanını veya önceki birikim bölgesini gösterir. Mevcut yapı: Pembe bölgeden son dönemde yaşanan sıçrama, potansiyel olarak daha yüksek bir dip seviyesi olduğunu ve muhtemelen yeni bir yukarı yönlü hareketin başlayacağını gösteriyor. Direnç bölgeleri: Yakın vadeli direnç: Kanal ortası yatay mavi bölge çizdiğiniz 115.000-115.600 dolar civarında. Bu, ilk test alanı olarak act olabilir. Major hedef/direnç: Üst kanal çizgisinde yaklaşık 122.000-124.000$ — muhtemelen nihai yukarı yönlü hedefiniz. Öngörülen yolunuz yükseliş dalgası yapısını gösteriyor ve BTC'nin 115 bin doları yeniden test etmesini, konsolidasyonunu ve ardından 122 bin dolara doğru ilerlemesini bekliyor. Kısaca: ✅ 106 bin dolarlık desteğin üzerindeyken yükseliş eğilimi. ⚠️ 115 bin dolar civarındaki tepkiyi izleyin — oradaki reddedilme, devam etmeden önce kısa vadeli bir geri çekilmeye neden olabilir. 📈 115,6 bin doların üzerinde kırılma ve tutunma, 122 bin dolarlık kanalın zirvesine doğru ivmeyi teyit edecek.
DOCTOR_PIPS05
تحلیل طلای امروز: خیز قدرتمند به سمت ۴۱۵۰ دلار | فرصت خرید طلا (XAU/USD)
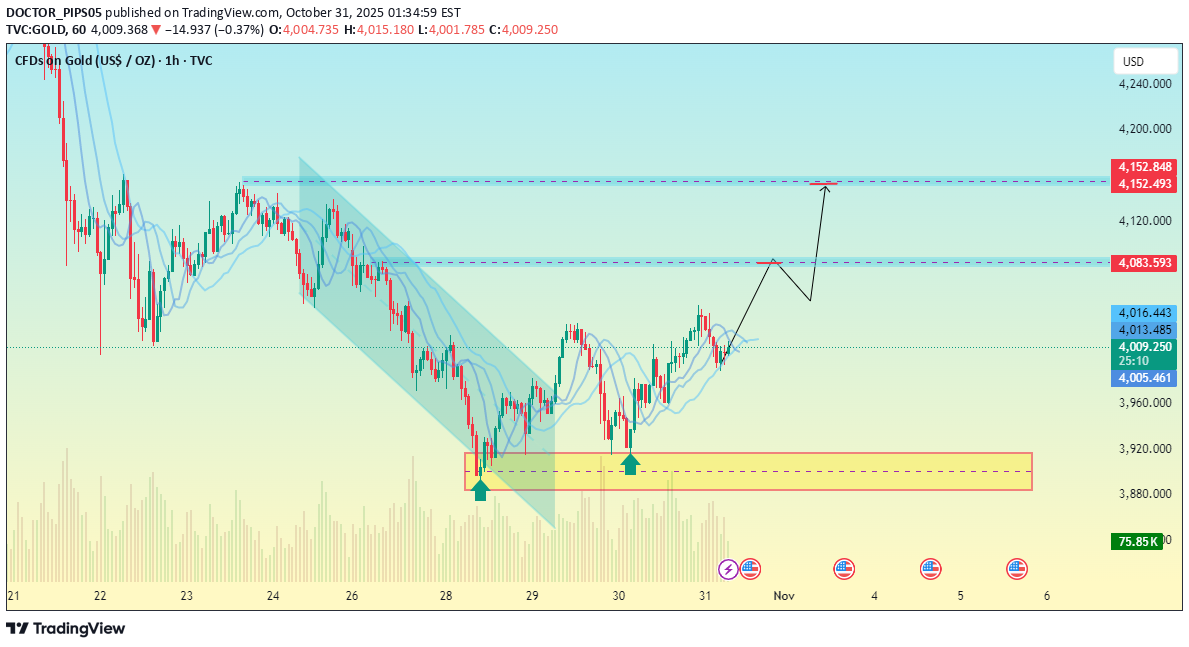
Güncel Genel Bakış Fiyat: Grafiğin hazırlandığı tarihte yaklaşık 4.009$. Grafik, 3.884 dolar (sarı kutu) yakınındaki destek bölgesine dokunduktan sonra yükseliş eğilimi gösteriyor. Yukarıya doğru kırılmış açık bir aşağı yönlü kanal var ve bu potansiyel bir trendin tersine döndüğünü gösteriyor. 🔹 Anahtar Bölgeler Destek Bölgesi: 🟡 3.880 $ – 3.900 $ → Alıcıların devreye girdiği güçlü talep bölgesi. Anında Direnç: 🔵 4.083 $ – 4.100 $ → Fiyat, devam etmeden önce bu alanı yeniden test edebilir. Major Hedef Bölge: 🔵 4.150 $ – 4.160 $ → Bir sonraki yükseliş hedefi alanı olarak işaretlendi. 🔹 Desen ve Yapı Grafik potansiyel bir yükseliş devam formasyonunu gösteriyor: 1. Azalan kanalın kırılması. 2. Yeniden testin 4.083 dolar civarında olması bekleniyor (desteğe dönüşen direnç). 3. 4.150$+'a doğru devam. Bu, yatırımcıların aşağıdakileri aradığını gösteriyor: Satın alma girişleri: Küçük geri çekilmelerin ardından 4.000 ila 4.020 dolar civarında. Hedef: 4.150 Dolar – 4.160 Dolar. Zararı durdur: 3.880 dolarlık destek alanının altında. 🔹 Göstergeler Bollinger Bantları: Fiyat üst band'e doğru ilerliyor — momentum yükselişe benziyor. Hacim: Hafif yükseliş, alım baskısının arttığını gösteriyor. --- 📊 Özet Önyargı: Boğa (kısa vadeli). Bir sonraki temel direnç: 4.083 Dolar → 4.150 Dolar. Kritik destek: 3.880 dolar. Fiyat 4.083 doların üzerinde kapanırsa, 4.150-4.160 dolara doğru devam etmesini bekleyebilirsiniz. 3.880 doların altında bir kırılma, yükseliş eğilimini geçersiz kılacak ve odağı tekrar düşüş hedeflerine kaydıracaktır.
DOCTOR_PIPS05
تحلیل طلا (XAU/USD) در تایم فریم ۱ ساعته: آیا کانال نزولی شکسته میشود یا حمایت ۳۹۵۰ حفظ میشود؟
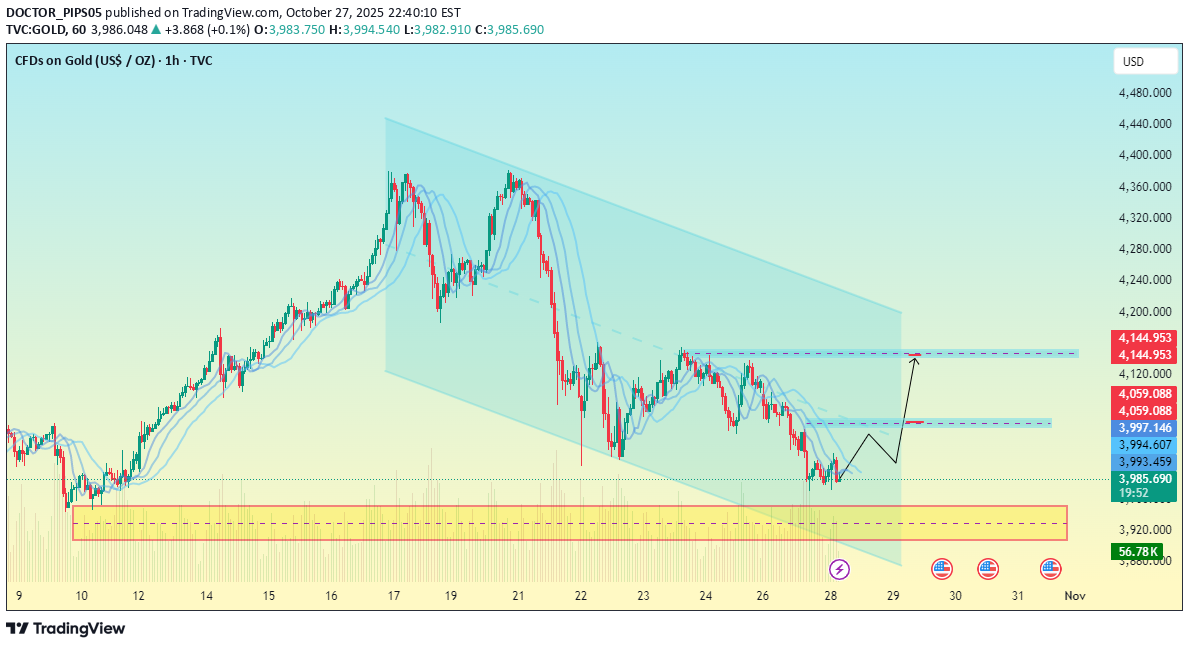
zaman çerçevesi: 1 saat Güncel Fiyat: Yaklaşık 3.991$ Genel Yapı: Azalan bir kanal modeli (fiyatın daha düşük yüksekler ve daha düşük dipler oluşturması). Vurgulanan Bölgeler: Sarı Bölge (altta): Güçlü destek alanı — alıcıların daha önce devreye girdiği önceki birikim bölgesi. Mavi Bölgeler: Potansiyel kar alma veya geri çekilme noktalarını işaret eden kısa vadeli direnç seviyeleri. 📊 Teknik Yorum 1. Destek Bölgesi (3.950 – 3.980): Fiyat bu bölgeden sıçrayarak potansiyel bir çift dip veya ters yapı oluşturdu. Bu bölgeyi savunan alıcılar talebin güçlü olduğunu gösteriyor. 2. İlk Hedef / Direnç: İlk mavi çizgiyle gösterilen 4.080 – 4.100 civarında. Momentum zayıflarsa burada bir miktar geri çekilme görülebilir. 3. İkinci Hedef: Kanalın üst sınırına yakın 4.140 – 4.160 civarında. Bu, öngörülen yolunuzla (grafikteki "V şekilli" move) hizalanır. 4. Kanal Dinamikleri: Alçalan kanal sağlam olduğundan üst trend çizgisinin üzerinde bir kırılma meydana gelmediği sürece genel trend düşüş yönlü olmaya devam edecek. 4.160 seviyesinin üzerinde bir kırılma, trendin yükselişe doğru potansiyel olarak tersine döndüğünü gösterebilir. 🧭 Olası Senaryolar Yükseliş Durumu: Destekten sıçrama → 4.100'ü yeniden test edin → konsolidasyon → 4.160'a doğru devam. Düşüş Durumu: 3.980'in üzerinde tutunamama → 3.920-3.900 destek bölgesine doğru kırılma. ⚙️ Ticaret Perspektifi Satın Alma Bölgesi: 3.970 – 3.990 (destek devam ederse) Hedefler: 4.100 / 4.160 Zararı Durdur: Daha derin düşüşlerden korunmak için 3.950'nin altında.
DOCTOR_PIPS05
تحلیل DOT/USDT: سقوط به کدام سطح حمایتی در کانال نزولی؟
Grafik alçalan bir kanal modelini (düşüş yapısı) göstermektedir. Şu anki fiyat 3,14 USDT civarında. Kanalın üst sınırıyla aynı hizada, 3,40-3,45 USDT yakınında (sarı renkle vurgulanmış) bir direnç bölgesi var. İki potansiyel talep bölgesini çizdiniz: İlk olarak 2,85–2,80 USDT civarında İkinci (daha derin destek) 2,50-2,45 USDT civarında Öngörülen fiyat yolu, üst kanaldan olası bir reddedilmeyi, alt kanaldan devamı ve bu talep bölgelerine doğru bir düşüşü gösteriyor. Teknik özet: 🔹 Önyargı: Kısa vadeli düşüş eğilimi 🔹 Yapı: Azalan bir kanala göre fiyat 🔹 Teyit: ~3,00'ün altında bir kırılma move'ı 2,85 veya 2,50'ye hızlandırabilir 🔹 Geçersiz Kılma: 3,45'in üzerinde bir kırılma ve kapanış, düşüş eğilimini geçersiz kılabilir ve trendin tersine dönmesini başlatabilir.
DOCTOR_PIPS05
تحلیل تکنیکال اتریوم (ETH/USD): مسیر صعودی تا ۴۶۶۰ دلار یا سقوط زیر ۳۷۵۰ دلار؟
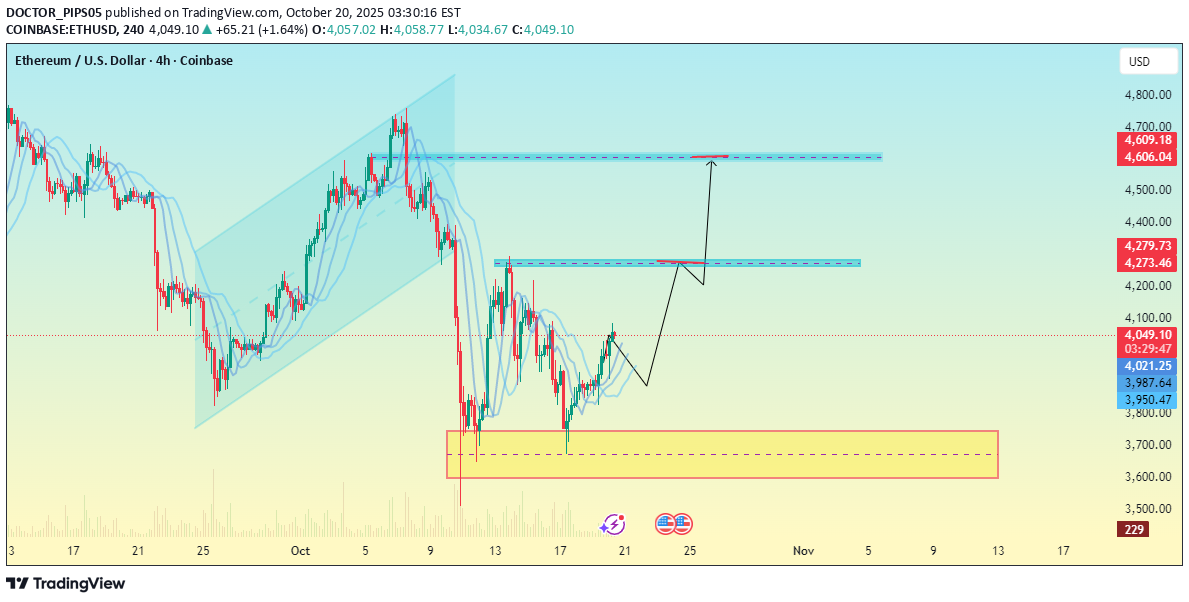
Güncel Fiyat Bölgesi: Küçük bir yukarı doğru move görünür halde 3.997 dolar civarında. Destek Alanı (sarı bölge): Yaklaşık 3.600 – 3.750 $, fiyatın daha önce tersine döndüğü son güçlü talep bölgesini gösteriyor. İlk Direnç Bölgesi (mavi kutu): 4.270 – 4.280 Dolar civarında, burada fiyat ilk satış baskısıyla karşı karşıya kalabilir. İkinci Hedef Bölge (üstteki mavi kutu): 4.600 – 4.660 dolar civarında, bu sizin ana yükseliş hedefiniz gibi görünüyor. Öngörülen Yol: Çizilen oklar, yukarı doğru devam etmeden önce mevcut seviyelerden kısa bir geri çekilmenin beklendiği yükseliş yapısını gösteriyor; bu da yapıda olası bir kırılma ve yeniden test kurulumu anlamına geliyor. Teknik Görünüm: Grafik sarı destek bölgesinde potansiyel bir yükseliş eğilimine işaret ediyor. ETH 3.900-3.950 doların üzerinde tutunursa, bir sonraki mantıksal yükseliş hedefleri 4.270 dolar ve 4.660 dolar olacaktır. 3.750 doların altına bir düşüş, bu yükseliş senaryosunu geçersiz kılacak ve daha fazla düşüşe kapıyı yeniden açacaktır.
DOCTOR_PIPS05
تحلیل طلا (XAU/USD) روی نمودار ۴ ساعته: آمادهسازی برای ریزش یا ادامه صعود؟ (سطوح کلیدی)
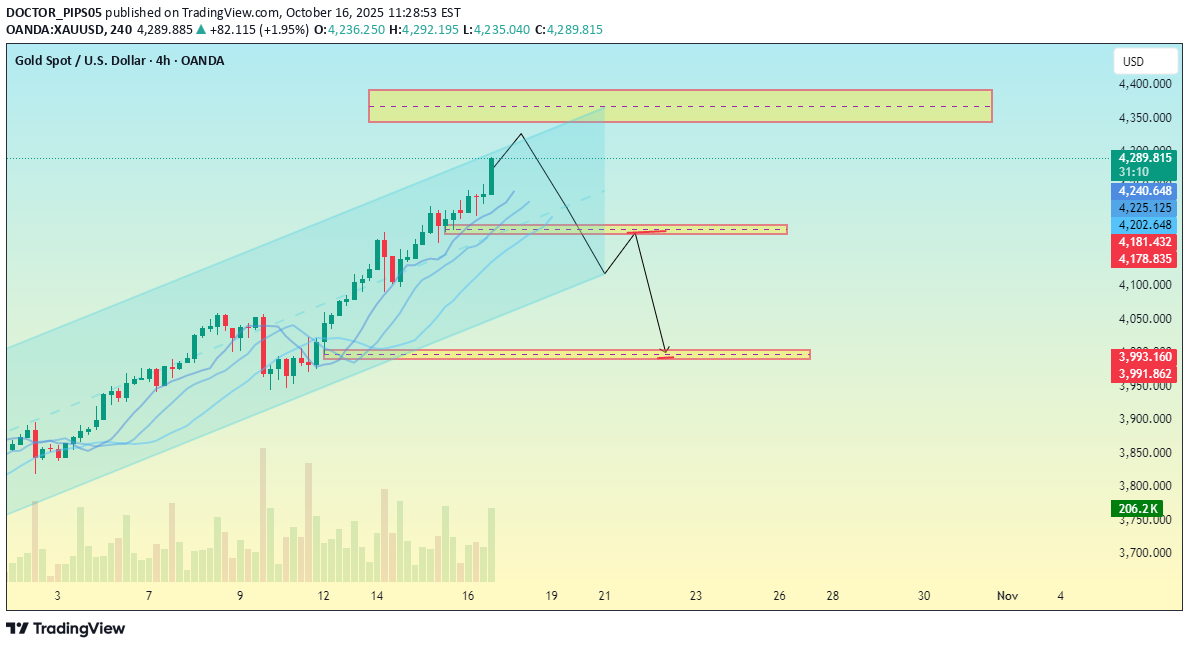
Grafik Yapısı Grafik güçlü bir yukarı yönlü kanal gösteriyor; fiyat açıkça tanımlanmış bir paralel kanal içerisinde yükseliş eğiliminde. Fiyat şu anda bu yükselen kanalın üst sınırına yakın, bu da potansiyel aşırı genişleme veya olası bir geri çekilme bölgesine işaret ediyor. 🟨 Vurgulanan Bölgeler 1. Üstteki sarı kutu (yaklaşık 4.389 – 4.360): Muhtemelen bir direnç bölgesi/potansiyel geri dönüş alanı. Bu bölgedeki projeksiyon oku, bu seviyeden olası bir geri çekilmeye işaret ediyor. 2. Ortadaki sarı kutu (yaklaşık 4.178): Bir destek veya yeniden test bölgesi gibi görünüyor; muhtemelen fiyatın üst kanalı reddettikten sonra geri çekilebileceği yer. 3. Alttaki sarı kutu (yaklaşık 3.991): Düzeltme devam ederse daha derin bir destek hedefini gösterir; orta desteğin başarısız olması durumunda muhtemelen düşüş yönlü bir devam hedefi. 📉 Senaryo Resimli Grafik, mevcut yükseliş rallisinden sonra olası bir düşüş eğiliminin ana hatlarını çiziyor gibi görünüyor: 1. Fiyat üstteki sarı direnç bölgesine ulaşır. 2. Geri çekilme orta desteğe doğru başlıyor (4.178). 3. Momentum düşmeye devam ederse alt hedefe (3.991 civarı) ulaşabilir. ⚙️ Analiz Özeti Trend: Genel olarak yükseliş eğilimi (hala yükselen kanalın içinde). Kısa Vadeli Görünüm: Üst direncin test edilmesinin ardından olası geri çekilme veya düzeltme. Anahtar Seviyeler: Direnç: ~4.389 Destek 1: ~4.178 Destek 2: ~3.991
DOCTOR_PIPS05
تحلیل تکنیکال طلا (XAU/USD): پیشبینی صعود قوی و اهداف قیمتی کلیدی در نمودار 5 دقیقهای
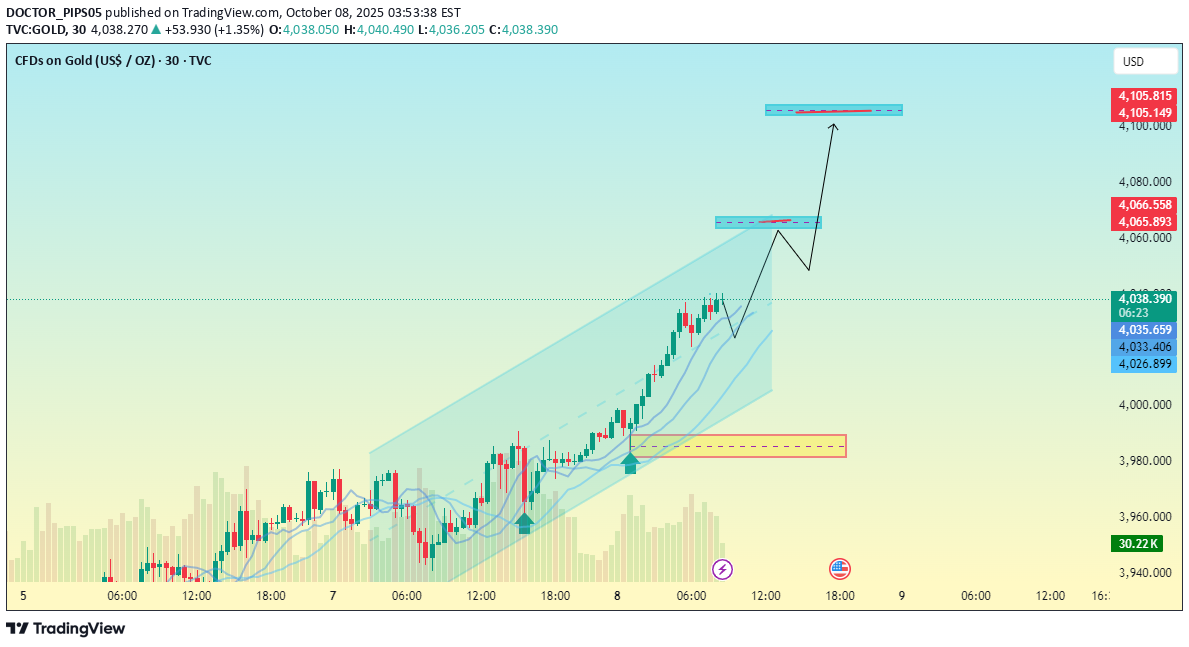
Güncel Fiyat: Yaklaşık 4.035$ (ekran görüntüsü itibariyle). Trend: Açıkça güçlü bir yükseliş trendinde, daha yüksek en yüksekler ve daha yüksek en düşük seviyeler oluşuyor. İşaretli Bölgeler: Talep bölgesi (destek) 3.986 – 4.000 dolar civarında, altta sarı renkle gösteriliyor; muhtemelen yükseliş tabanınız. İlk hedef/tedarik bölgesi 4.057 – 4.058 dolar civarında (ortadaki mavi kutu). İkinci hedef/tedarik bölgesi 4.101 – 4.102 dolar civarında (üstteki mavi kutu). Projeksiyon: Çizim, ilk hedef bölgeye (4.057 $) ve ardından potansiyel olarak ikinci hedefe (4.101 $) doğru yukarı doğru devam etmeden önce beklenen bir geri çekilmeyi (4.020 $ – 4.025 $ alanına doğru küçük bir düşüş) gösteriyor. Kurulum Özeti: Önyargı: Yükselişin devamı Olası Giriş: Yaklaşık 4.020 – 4.025 Dolar (geri çekilmeden sonra) Hedefler: TP1: 4.057$ TP2: 4.101$ Geçersiz kılma (zararı durdurma fikri): 4.000 Dolar – 3.986 Dolar bölgesinin altında
Sorumluluk Reddi
Sahmeto'nun web sitesinde ve resmi iletişim kanallarında yer alan herhangi bir içerik ve materyal, kişisel görüşlerin ve analizlerin bir derlemesidir ve bağlayıcı değildir. Borsa ve kripto para piyasasına alım, satım, giriş veya çıkış için herhangi bir tavsiye oluşturmazlar. Ayrıca, web sitesinde ve kanallarda yer alan tüm haberler ve analizler, yalnızca resmi ve gayri resmi yerli ve yabancı kaynaklardan yeniden yayınlanan bilgilerdir ve söz konusu içeriğin kullanıcılarının materyallerin orijinalliğini ve doğruluğunu takip etmekten ve sağlamaktan sorumlu olduğu açıktır. Bu nedenle, sorumluluk reddedilirken, sermaye piyasası ve kripto para piyasasındaki herhangi bir karar verme, eylem ve olası kar ve zarar sorumluluğunun yatırımcıya ait olduğu beyan edilir.