sembol PAXG hakkında analiz Teknik Xayah_trading: Satın al (15.12.2025) önerilir

Xayah_trading
"A super week" of employment data
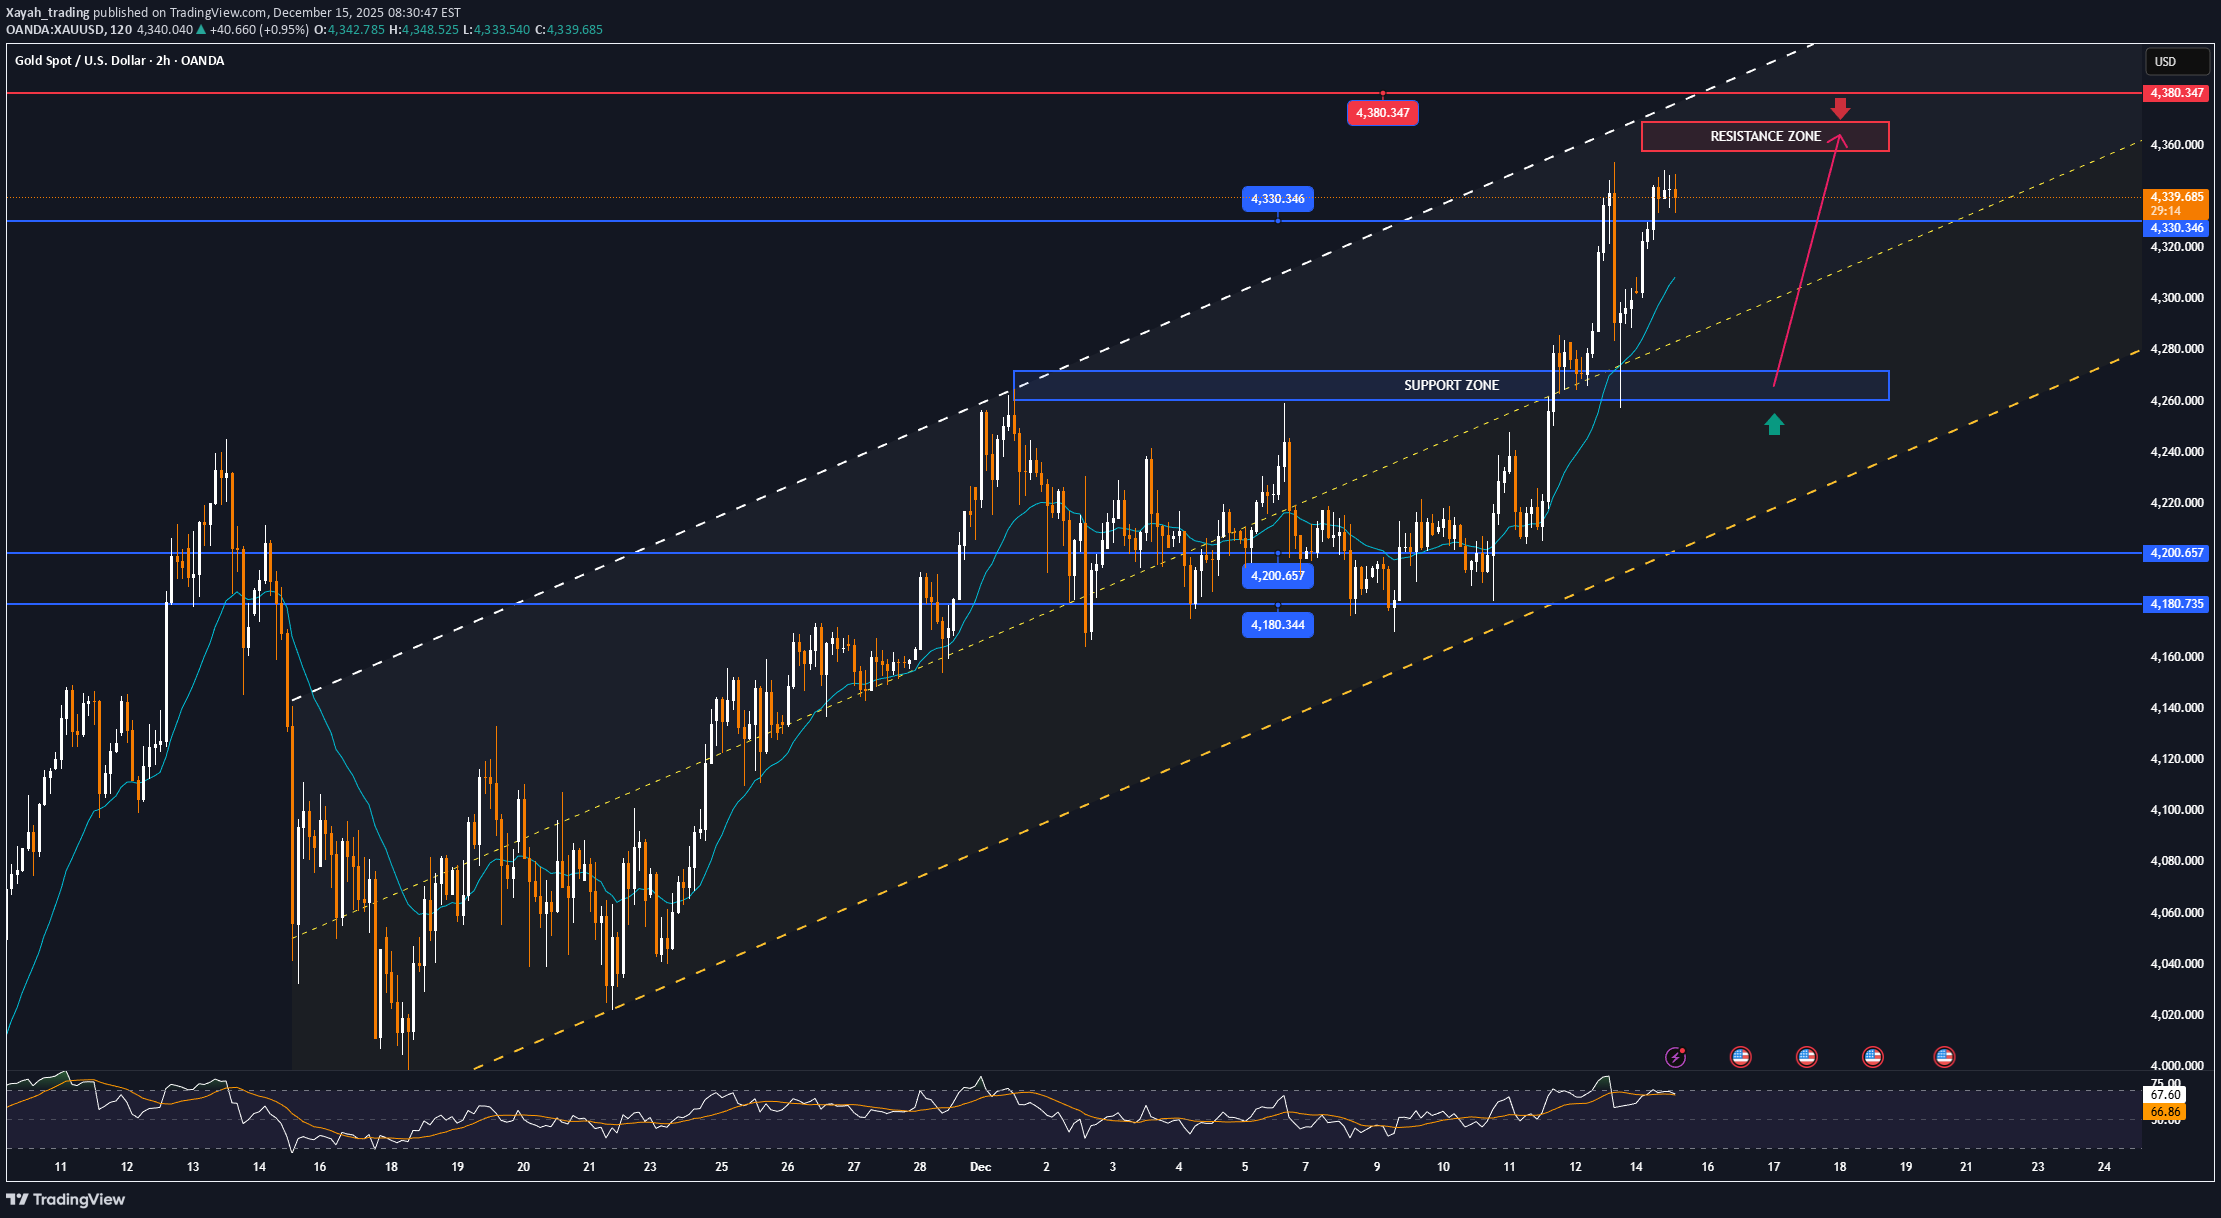
Next week will not be a normal trading week. This is the time when the market is forced to answer a big question: will the Federal Reserve's policy pivot be sustainable, or merely a tactical adjustment in a cycle still fraught with uncertainty? Following its December interest rate decision, the Fed officially cut rates by 25 basis points as expected. However, the market reaction showed that the key wasn't the number, but the underlying message. The dotplot chart indicated very limited, even cautious, room for further rate cuts in 2026. Nevertheless, the less hawkish statements from Chairman Jerome Powell, coupled with the Fed resuming short-term Treasury bond purchases to stabilize liquidity, produced a clear consequence: the US dollar weakened faster and more deeply than anticipated. Against this backdrop, the upcoming trading week is seen as a "test of resilience" for the USD, as key employment and inflation data are released simultaneously, and the three major central banks in Europe and Asia also come into the spotlight. Fed: Not overly dovish, but enough to change market expectations On the surface, the Fed's decision resembles a "soft hawk": cutting interest rates, but the dotplot for 2026 is quite limited. However, the structure of the dotplot reveals a less-noticed fact: no single viewpoint clearly dominates. Four members are against cutting interest rates in 2026, four support another cut, and four others lean towards two cuts. Overall, this is not a policy consensus. More importantly, the Fed has proactively restarted short-term Treasury bond purchases as a reserve management tool. While not explicitly called quantitative easing, this move sends a clear signal: the Fed is willing to sacrifice "formal hawkishness" to ensure real financial stability. Powell's remarks at the press conference, emphasizing the risks of a weakening labor market and viewing inflationary pressures from tariffs as temporary, reinforced the belief that the Fed would prioritize jobs over continuing to push inflation at all costs. This quickly led the market to reassess the likelihood of interest rate cuts next year, with the dollar becoming the first to face pressure. This week shapes expectations, leaving no room for complacency. Next week marks a period where global monetary policy expectations begin to diverge significantly. The Fed has taken a step back, but not quite surrendered. The BoE is at a crossroads of easing. The ECB maintains a balanced stance with controlled confidence. The BOJ, meanwhile, is trying to break free from its own shadow. Against this backdrop, volatility in the foreign exchange, gold, and risk assets markets in general is likely to increase. This is not a time for emotional trading, but rather a time that demands discipline, selectivity, and the ability to correctly interpret the policy message behind the numbers. The upcoming data week will not only answer the question of “what happened,” but more importantly, it will reveal who is truly controlling the global monetary policy narrative in 2026. Technical Analysis and Suggestions XAUUSD The daily chart of gold prices shows a new uptrend being relatively fully confirmed, both in terms of price structure and momentum. After a sharp correction from the previous peak, gold did not break the long-term uptrend structure, but only retreated to test important dynamic support zones. The price quickly held firm at the 0.236 Fibonacci level around $4,120–$4,130 per ounce, while continuing to move within the medium-term uptrend channel. This indicates that active buying pressure remains in control of the market, and selling pressure is more profit-taking than a trend reversal. Short- and medium-term moving averages maintain an upward slope, acting as a "price cushion" during corrections. After a cooling-off period, the RSI has returned to equilibrium, leaning toward an uptrend, reflecting that upward momentum is being re-accumulated rather than weakening. Structurally, the continuous formation of higher lows, accompanied by shallow corrections, is a typical sign of a strong uptrend. If the resistance zone around $4,330/ounce is decisively broken, the market could enter a new phase of extended upward movement. The next technical targets are identified at: • $4,380–$4,400/ounce: an extension zone within the ascending price channel and Fibonacci extension. • In a scenario with stronger momentum, the price could head towards the $4,500/ounce region in the medium term. The risk of a downward correction lies in the scenario where the price fails to break above $4,330/ounce and reverses to break the support zone of $4,200–$4,180/ounce. In that case, gold could retreat further to the $3,970–$3,850/ounce area (Fibonacci 0.382–0.5). However, as long as the price remains above this zone, the major uptrend is not yet invalidated. Given the overall upward trend, current corrections should be viewed as opportunities for repositioning, rather than hasty reversal signals. SELL XAUUSD PRICE 4366 - 4364⚡️ ↠↠ Stop Loss 4370 →Take Profit 1 4358 ↨ →Take Profit 2 4352 BUY XAUUSD PRICE 4168 - 4270⚡️ ↠↠ Stop Loss 4264 →Take Profit 1 4276 ↨ →Take Profit 2 4282