
SOON
SOON
| تریدر | نوع سیگنال | حد سود/ضرر | زمان انتشار | مشاهده پیام |
|---|---|---|---|---|
Sonuç bulunamadı. | ||||
SOON Fiyat Grafiği
سود Üç Ay :
سیگنالهای SOON
filtre
Mesajı şuna göre sırala
Tüccar Türü
timeframe

khalidalmutairi1
سقوط آزاد تمام شد: وقت ورود به بازار و اهداف صعودی بزرگ!
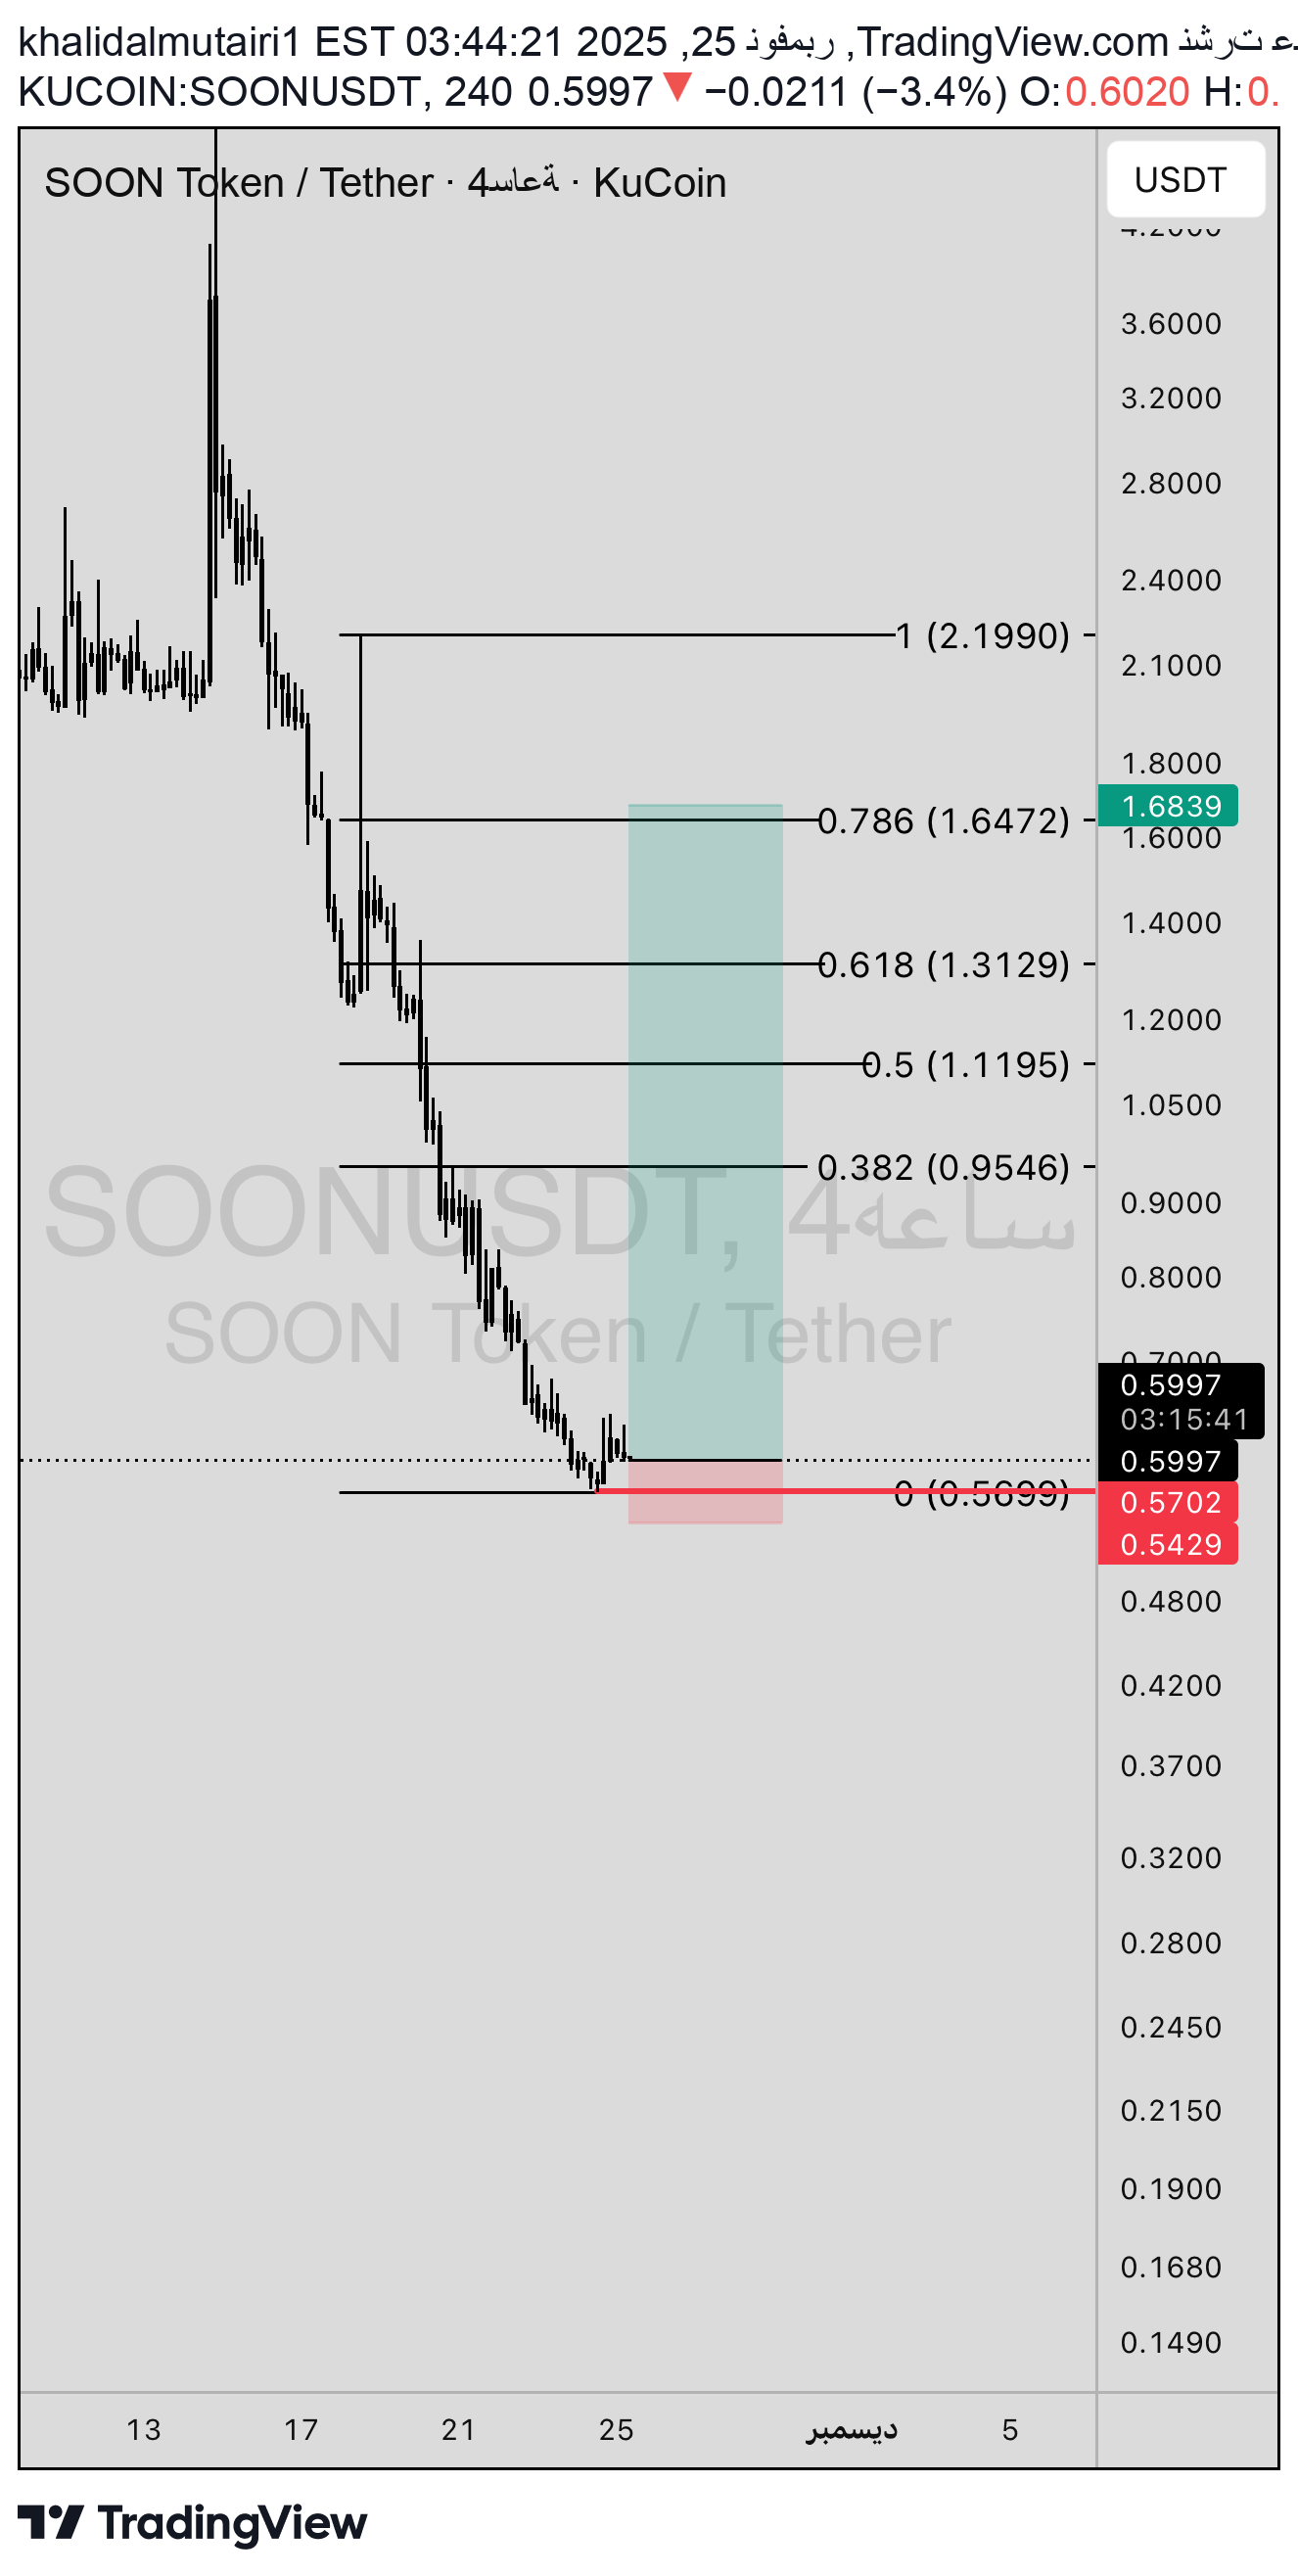
Çok güçlü bir düşüşün ardından blok emrimiz var ve önünüzde gösterilen hedefler yükseliş sırasında değerli hedefler olduğundan artık giriş zamanıdır. Önemli olan iki mumu dört saat boyunca durdurup kapatmaktır.

SevenStarBuySell
بازار به زودی خنک میشود؟ تحلیل تکنیکال و اهداف قیمتی جدید!
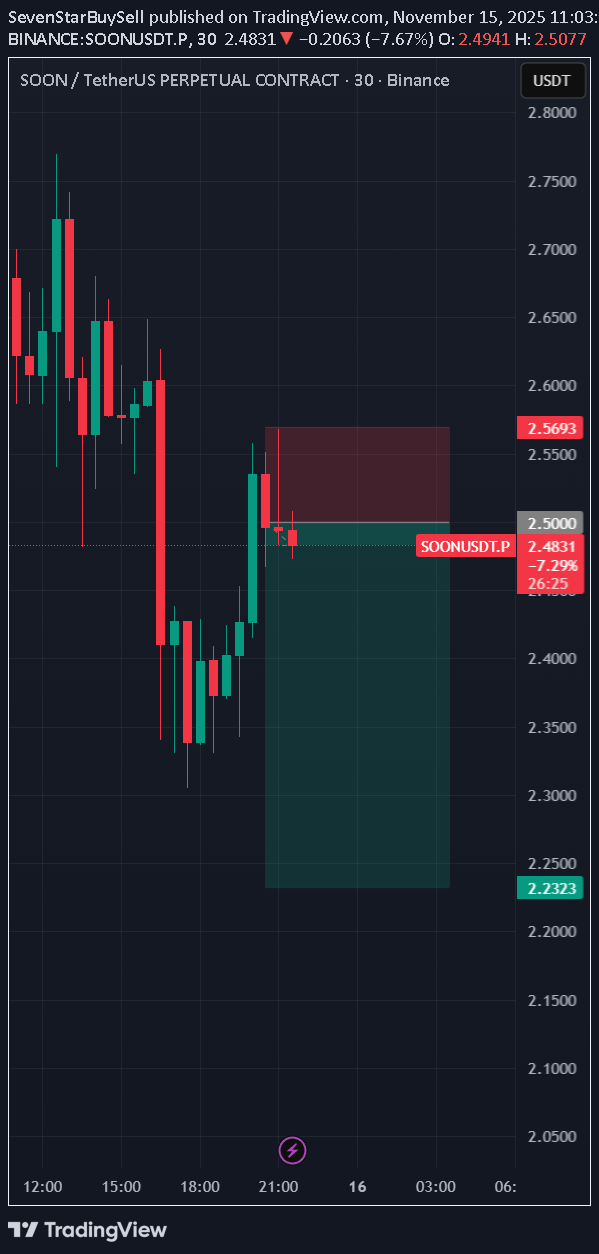
Bence soon boğa koşusundan bıktı. Artık soğuma zamanı. Grafiklerdeki hedefler. DYOR

WaveRiders2
تحلیل فوری: چرا مقاومت قرمز SOON شکسته نشد و قیمت دوباره سقوط کرد؟
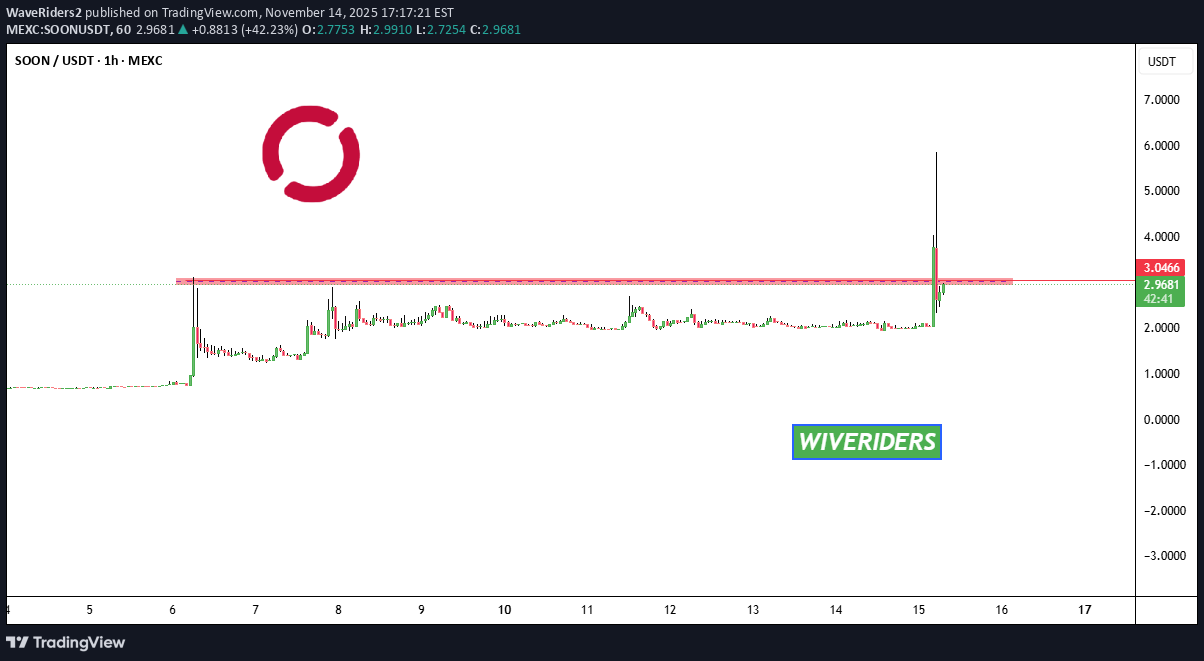
📊 SOON Güncelleme SOON bir red direnç bölgesi 🔴 oluşturmuştu. Fiyat bu seviyenin üzerine çıktıktan sonra move başarısız oldu, ve şimdi fiyat yeniden direnç bölgesinin altına geri döndü. Bu, kırılmanın yeterince güçlü olmadığını gösteriyor. ve red bölgesi yükselişin devamı için önemli bir bariyer olmaya devam ediyor.

The_Traders_House
تحلیل تکنیکال SOON/USDT: فرصت فروش در کمین نزدیک حمایت کلیدی!
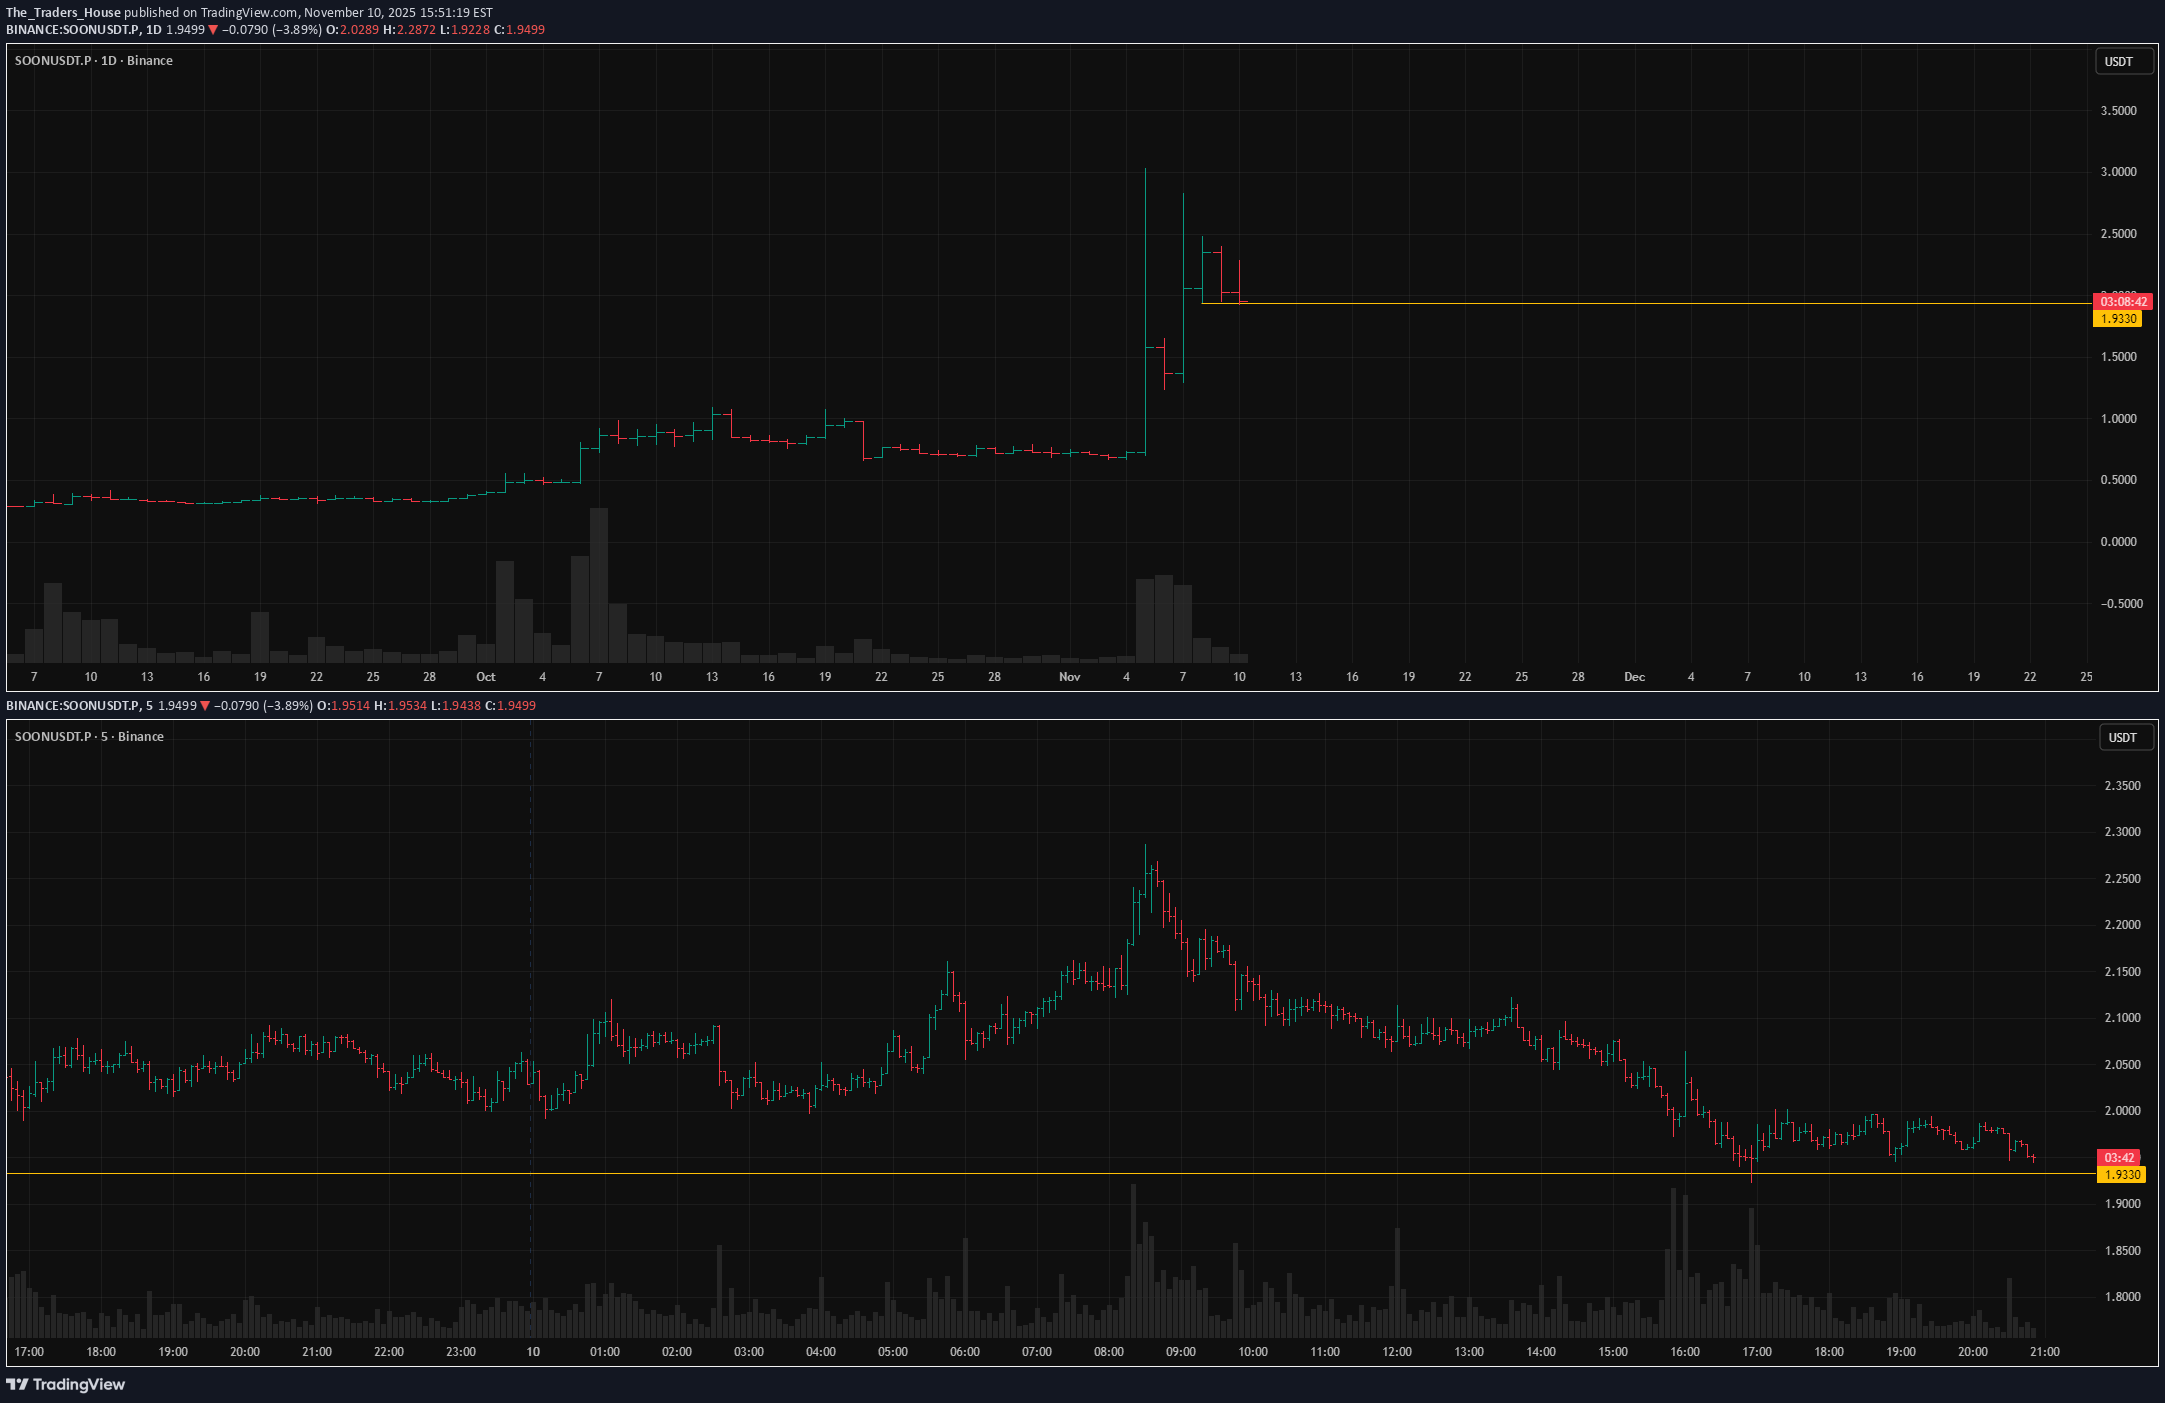
YAKINDAUSDT.P pump'ın ardından şu anda düşüşte. Ben buna düzeltme diyemem; genellikle keskin yukarı yönlü hareketleri takip eden tipik bir düşüş olması daha muhtemel. Açıkça onaylanmış bir destek seviyesi ve bunun hemen üzerinde birkaç saatlik konsolidasyon oluşuyor. Bu, her yerel yüksek seviyenin bir öncekinden daha düşük olması nedeniyle uzun pozisyonlardan çıkıldığını gösterir. Yakın vadede kısa bir süre devam etmesini bekliyoruz. Bu senaryo için temel faktörler: Piyasadan ayrılan varlık (göreceli güç/zayıflık ve BTC) Likidite kapma (trend karşısında yanlış move) Yaklaştıkça volatilite daralması Derhal yeniden test Yanlış bir aradan sonra tepki yok Barın en uç noktasına yakın kapanış Bu analiz faydalı oldu mu? Düşüncelerinizi yorumlara bırakın ve daha fazlasını görmek için takip edin.

Mousanoo
آیا سولانا (SOON) به زودی منفجر میشود؟ سطوح کلیدی برای سودهای نجومی!
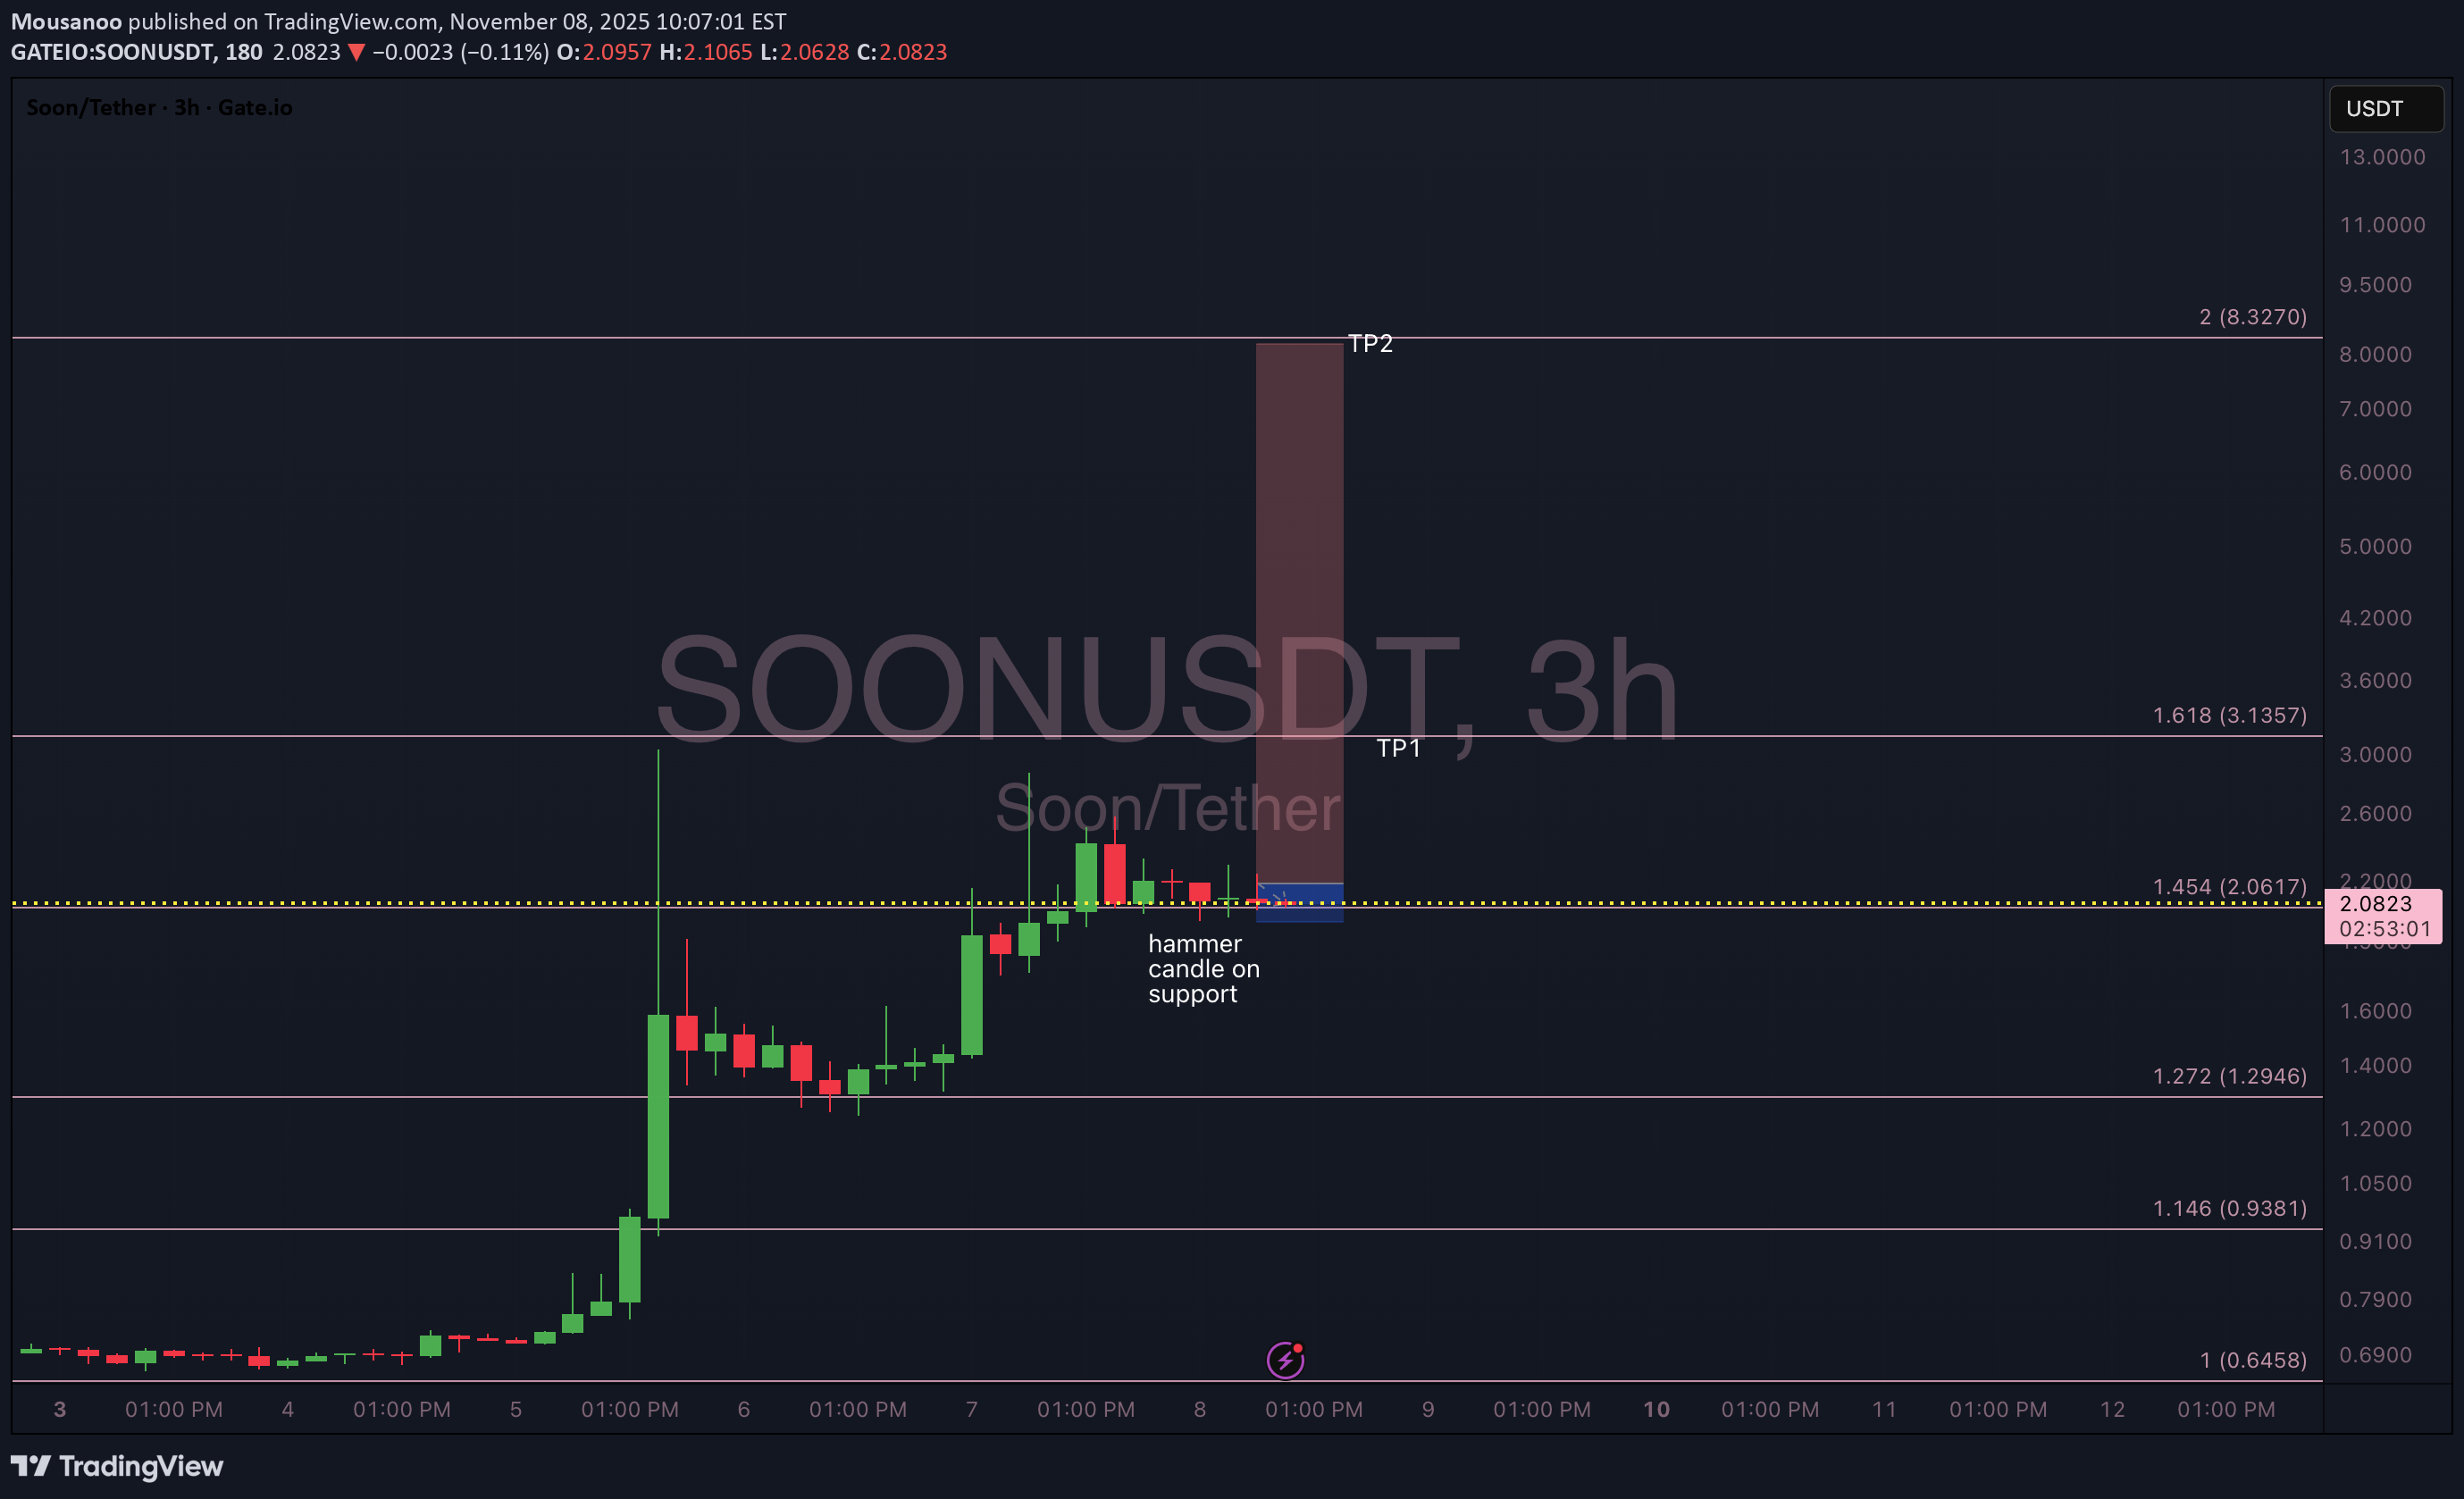
SOONUSDT desteğe dayanıyor ve momentum birçok zaman diliminde hala yükseliş eğiliminde. BTC.D düşüş eğilimi gösteriyor ve bu da paranın BTC'den Altcoin'lere döndüğünü gösteriyor. Hareket halindeki bir cisim, dışarıdan bir kuvvet etki edene kadar hareket halinde kalacaktır. Yaklaşık 3,13 dolar olan TP1, direncin fiyatın durmasına neden olabileceği alandır. Eğer bu oranın üzerinde kabul görürse, fiyatın bir sonraki aşamada ulaşmaya çalışacağı yer olan TP2, yani 8,32 dolar olacaktır. Çapraz Oran: 4,6:1 @ TP1, 30:1 @ TP2

sladkamala123
آینده سکه جدید: آیا این ارز دیجیتال متحول خواهد شد؟

Madeni para yeni, belki gelecek için ilginç. Nereye gideceğini göreceğiz.

P_S_trade
تحلیل قیمت SOON: آیا این ارز پتانسیل دو برابر شدن دارد؟ (مراقب باشید!)

Son zamanlarda #SOON konusundaki dikkat cazip görünebilir, ancak dikkatli olabilir. Günlük zaman diliminde Soonusdt.p , bir ters çevirme deseni oluşuyor gibi görünüyor. Önümüzdeki 7-10 gün boyunca, alıcıların fiyatı 0,48-0.57 $ arasında tutup koruyamayacaklarını göreceğiz. Bu aralık geçerlise-orta vadede potansiyel bir 2x büyüme fırsatı ortaya çıkabilir. Girmeden önce her zaman riski değerlendirin. ______________ ◆ Günlük kripto içgörüler ve güncellemeler için bizi takip edin ❤️! 🚀 Önemli piyasa hareketlerini kaçırmayın 🧠 dyor | Bu finansal tavsiye değil, sadece yüksek sesle düşünüyorum

Ren_MomentumTrader
SOON/USDT
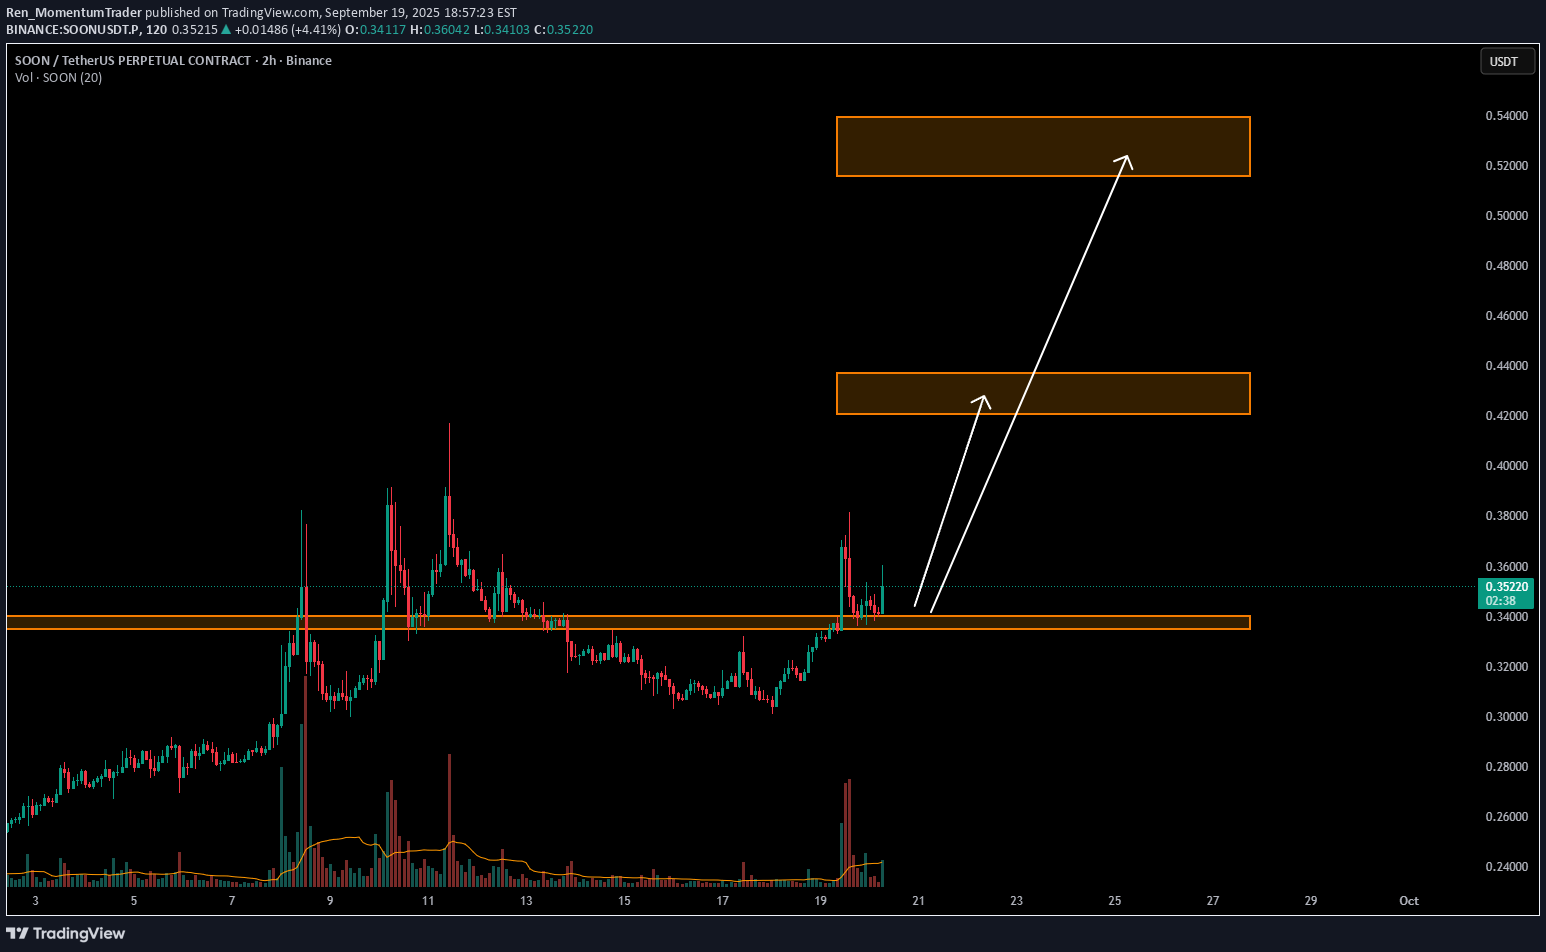
Key Level Zone: 0.33500 - 0.34000 LMT v2.0 detected. The setup looks promising—price previously trended upward with rising volume and momentum, then retested this zone cleanly. This presents an excellent reward-to-risk opportunity if momentum continues to align. Introducing LMT (Levels & Momentum Trading) - Over the past 3 years, I’ve refined my approach to focus more sharply on the single most important element in any trade: the KEY LEVEL. - While HMT (High Momentum Trading) served me well—combining trend, momentum, volume, and structure across multiple timeframes—I realized that consistently identifying and respecting these critical price zones is what truly separates good trades from great ones. - That insight led to the evolution of HMT into LMT – Levels & Momentum Trading. Why the Change? (From HMT to LMT) Switching from High Momentum Trading (HMT) to Levels & Momentum Trading (LMT) improves precision, risk control, and confidence by: - Clearer Entries & Stops: Defined key levels make it easier to plan entries, stop-losses, and position sizing—no more guesswork. - Better Signal Quality: Momentum is now always checked against a support or resistance zone—if it aligns, it's a stronger setup. - Improved Reward-to-Risk: All trades are anchored to key levels, making it easier to calculate and manage risk effectively. - Stronger Confidence: With clear invalidation points beyond key levels, it's easier to trust the plan and stay disciplined—even in tough markets. Whenever I share a signal, it’s because: - A high‐probability key level has been identified on a higher timeframe. - Lower‐timeframe momentum, market structure and volume suggest continuation or reversal is imminent. - The reward‐to‐risk (based on that key level) meets my criteria for a disciplined entry. ***Please note that conducting a comprehensive analysis on a single timeframe chart can be quite challenging and sometimes confusing. I appreciate your understanding of the effort involved. Important Note: The Role of Key Levels - Holding a key level zone: If price respects the key level zone, momentum often carries the trend in the expected direction. That’s when we look to enter, with stop-loss placed just beyond the zone with some buffer. - Breaking a key level zone: A definitive break signals a potential stop‐out for trend traders. For reversal traders, it’s a cue to consider switching direction—price often retests broken zones as new support or resistance. My Trading Rules (Unchanged) Risk Management - Maximum risk per trade: 2.5% - Leverage: 5x Exit Strategy / Profit Taking - Sell at least 70% on the 3rd wave up (LTF Wave 5). - Typically sell 50% during a high‐volume spike. - Move stop‐loss to breakeven once the trade achieves a 1.5:1 R:R. - Exit at breakeven if momentum fades or divergence appears. The market is highly dynamic and constantly changing. LMT signals and target profit (TP) levels are based on the current price and movement, but market conditions can shift instantly, so it is crucial to remain adaptable and follow the market's movement. If you find this signal/analysis meaningful, kindly like and share it. Thank you for your support~ Sharing this with love! From HMT to LMT: A Brief Version History HM Signal : Date: 17/08/2023 - Early concept identifying high momentum pullbacks within strong uptrends - Triggered after a prior wave up with rising volume and momentum - Focused on healthy retracements into support for optimal reward-to-risk setups HMT v1.0: Date: 18/10/2024 - Initial release of the High Momentum Trading framework - Combined multi-timeframe trend, volume, and momentum analysis. - Focused on identifying strong trending moves high momentum HMT v2.0: Date: 17/12/2024 - Major update to the Momentum indicator - Reduced false signals from inaccurate momentum detection - New screener with improved accuracy and fewer signals HMT v3.0: Date: 23/12/2024 - Added liquidity factor to enhance trend continuation - Improved potential for momentum-based plays - Increased winning probability by reducing entries during peaks HMT v3.1: Date: 31/12/2024 - Enhanced entry confirmation for improved reward-to-risk ratios HMT v4.0: Date: 05/01/2025 - Incorporated buying and selling pressure in lower timeframes to enhance the probability of trending moves while optimizing entry timing and scaling HMT v4.1: Date: 06/01/2025 - Enhanced take-profit (TP) target by incorporating market structure analysis HMT v5 : Date: 23/01/2025 - Refined wave analysis for trending conditions - Incorporated lower timeframe (LTF) momentum to strengthen trend reliability - Re-aligned and re-balanced entry conditions for improved accuracy HMT v6 : Date : 15/02/2025 - Integrated strong accumulation activity into in-depth wave analysis HMT v7 : Date : 20/03/2025 - Refined wave analysis along with accumulation and market sentiment HMT v8 : Date : 16/04/2025 - Fully restructured strategy logic HMT v8.1 : Date : 18/04/2025 - Refined Take Profit (TP) logic to be more conservative for improved win consistency LMT v1.0 : Date : 06/06/2025 - Rebranded to emphasize key levels + momentum as the core framework LMT v2.0 Date: 11/06/2025 - Fully restructured lower timeframe (LTF) momentum logic

Captain-MAO
SOON/USDT - back to 0.5$ zone
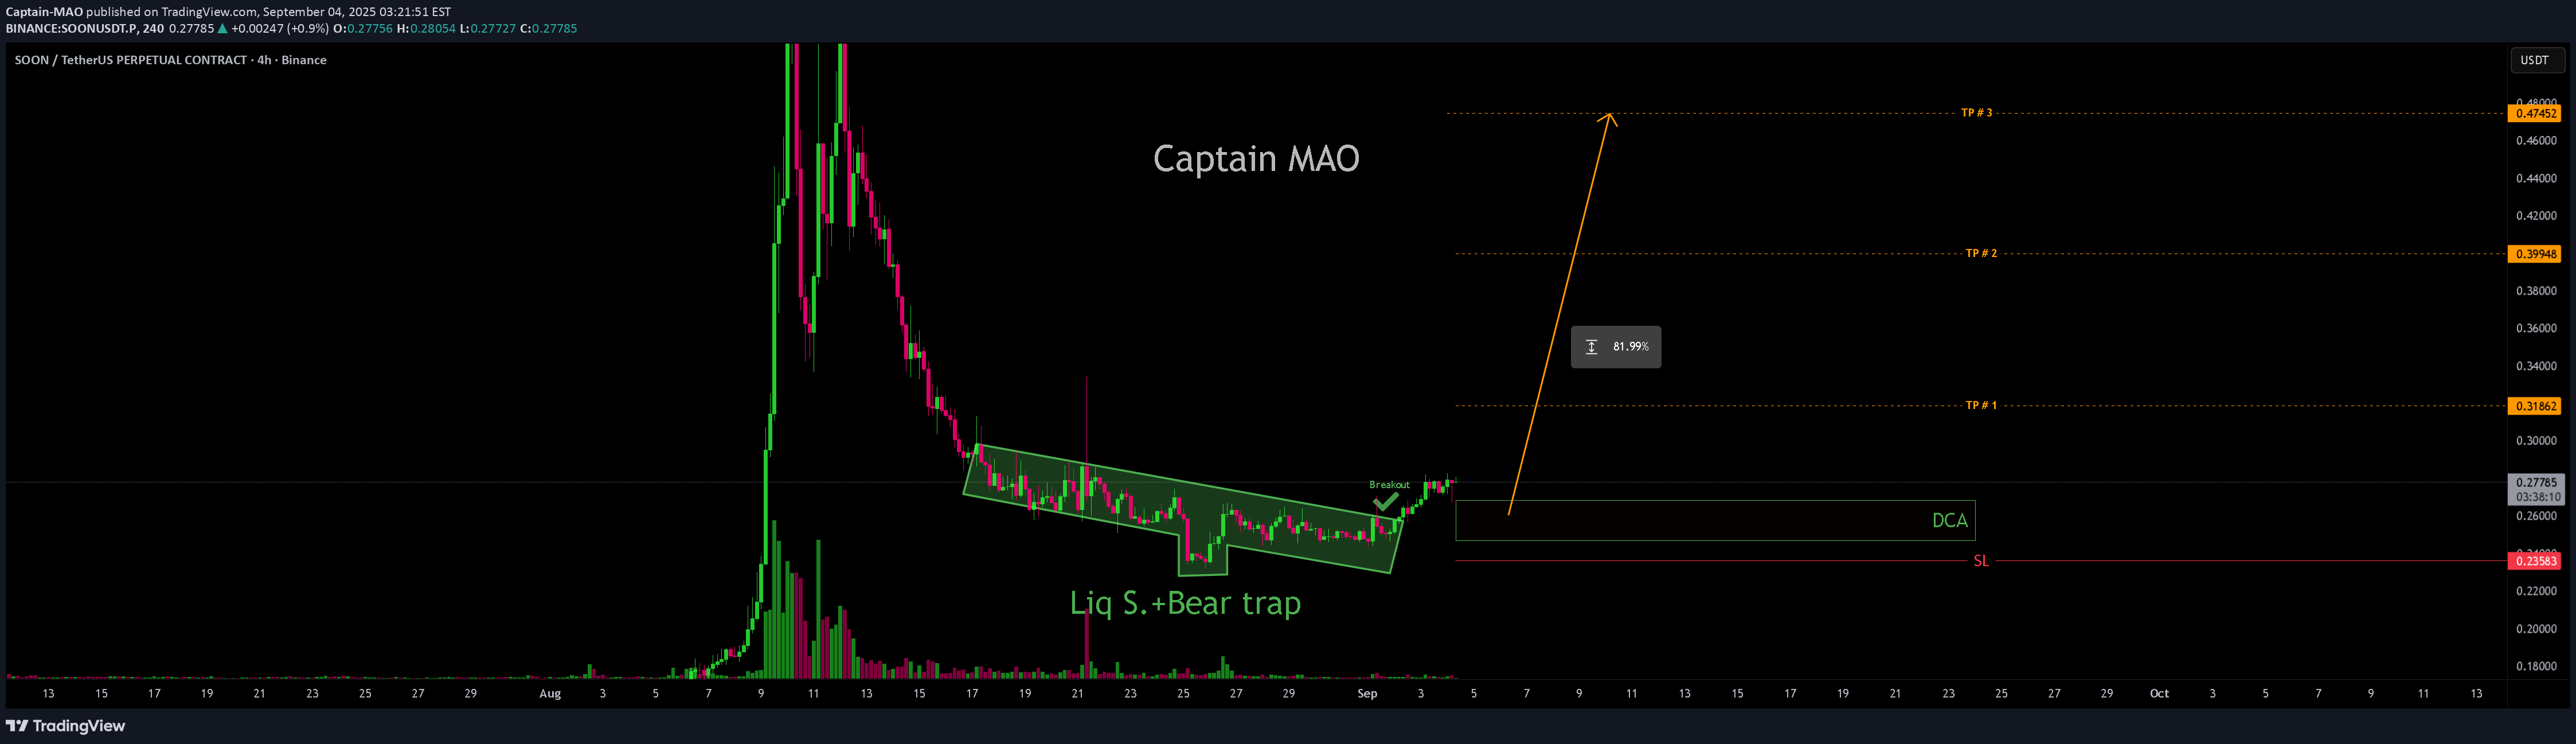
Son iki hafta boyunca, yakında/USDT, sıkı bir aralıkta özensiz bir düşüş trendi içinde birleştiriyordu, bir likidite taraması ve ayı tuzağından zayıf eller salladı. Bu tuzak şimdi onaylandı ve fiyat menzilden başarılı bir kopuş sağladı. Şimdi plan, en uygun risk/ödül konumlandırmasını sunan yeşil kutunun içinde DCA girişlerini aramaktır. Oradan, üst potansiyel 0,47 $ - 0.50 $ bölgeyi, bir anahtar major direnç seviyesini hedefliyor.

Shorting SOON/USDT at Major Supply Zone

Fiyat, geçmişte güçlü reddetmeleri tetikleyen bir alan olan 0.5296-0.5336 arasında a iyi tanımlanmış tedarik bölgesine girdi. Ichimoku bulutunun üzerindeki mevcut yükseliş momentumuna rağmen, bu kurulum, geç alıcılar tuzağa düştükçe a karşı eğilim tersine dönme arar. Durdurma, a kırılmaya karşı korumak için tedarik bölgesinin hemen üzerine yerleştirilirken, hedef 0.4673-0.4869 talep bölgesinde ayarlanır ve kabaca a 2: 1 risse riski sunar. Bu ticaret bankaları tedarik tutma ve momentumun olumsuz yönüne geri dönmesi.
Sorumluluk Reddi
Sahmeto'nun web sitesinde ve resmi iletişim kanallarında yer alan herhangi bir içerik ve materyal, kişisel görüşlerin ve analizlerin bir derlemesidir ve bağlayıcı değildir. Borsa ve kripto para piyasasına alım, satım, giriş veya çıkış için herhangi bir tavsiye oluşturmazlar. Ayrıca, web sitesinde ve kanallarda yer alan tüm haberler ve analizler, yalnızca resmi ve gayri resmi yerli ve yabancı kaynaklardan yeniden yayınlanan bilgilerdir ve söz konusu içeriğin kullanıcılarının materyallerin orijinalliğini ve doğruluğunu takip etmekten ve sağlamaktan sorumlu olduğu açıktır. Bu nedenle, sorumluluk reddedilirken, sermaye piyasası ve kripto para piyasasındaki herhangi bir karar verme, eylem ve olası kar ve zarar sorumluluğunun yatırımcıya ait olduğu beyan edilir.