
MOCA
Moca Network
| تریدر | نوع سیگنال | حد سود/ضرر | زمان انتشار | مشاهده پیام |
|---|---|---|---|---|
Sonuç bulunamadı. | ||||
Moca Network Fiyat Grafiği
سود Üç Ay :
سیگنالهای Moca Network
filtre
Mesajı şuna göre sırala
Tüccar Türü
timeframe

DefiWolf
MOCA Trade Setup – Eyeing 0.16–0.17 Target Zone
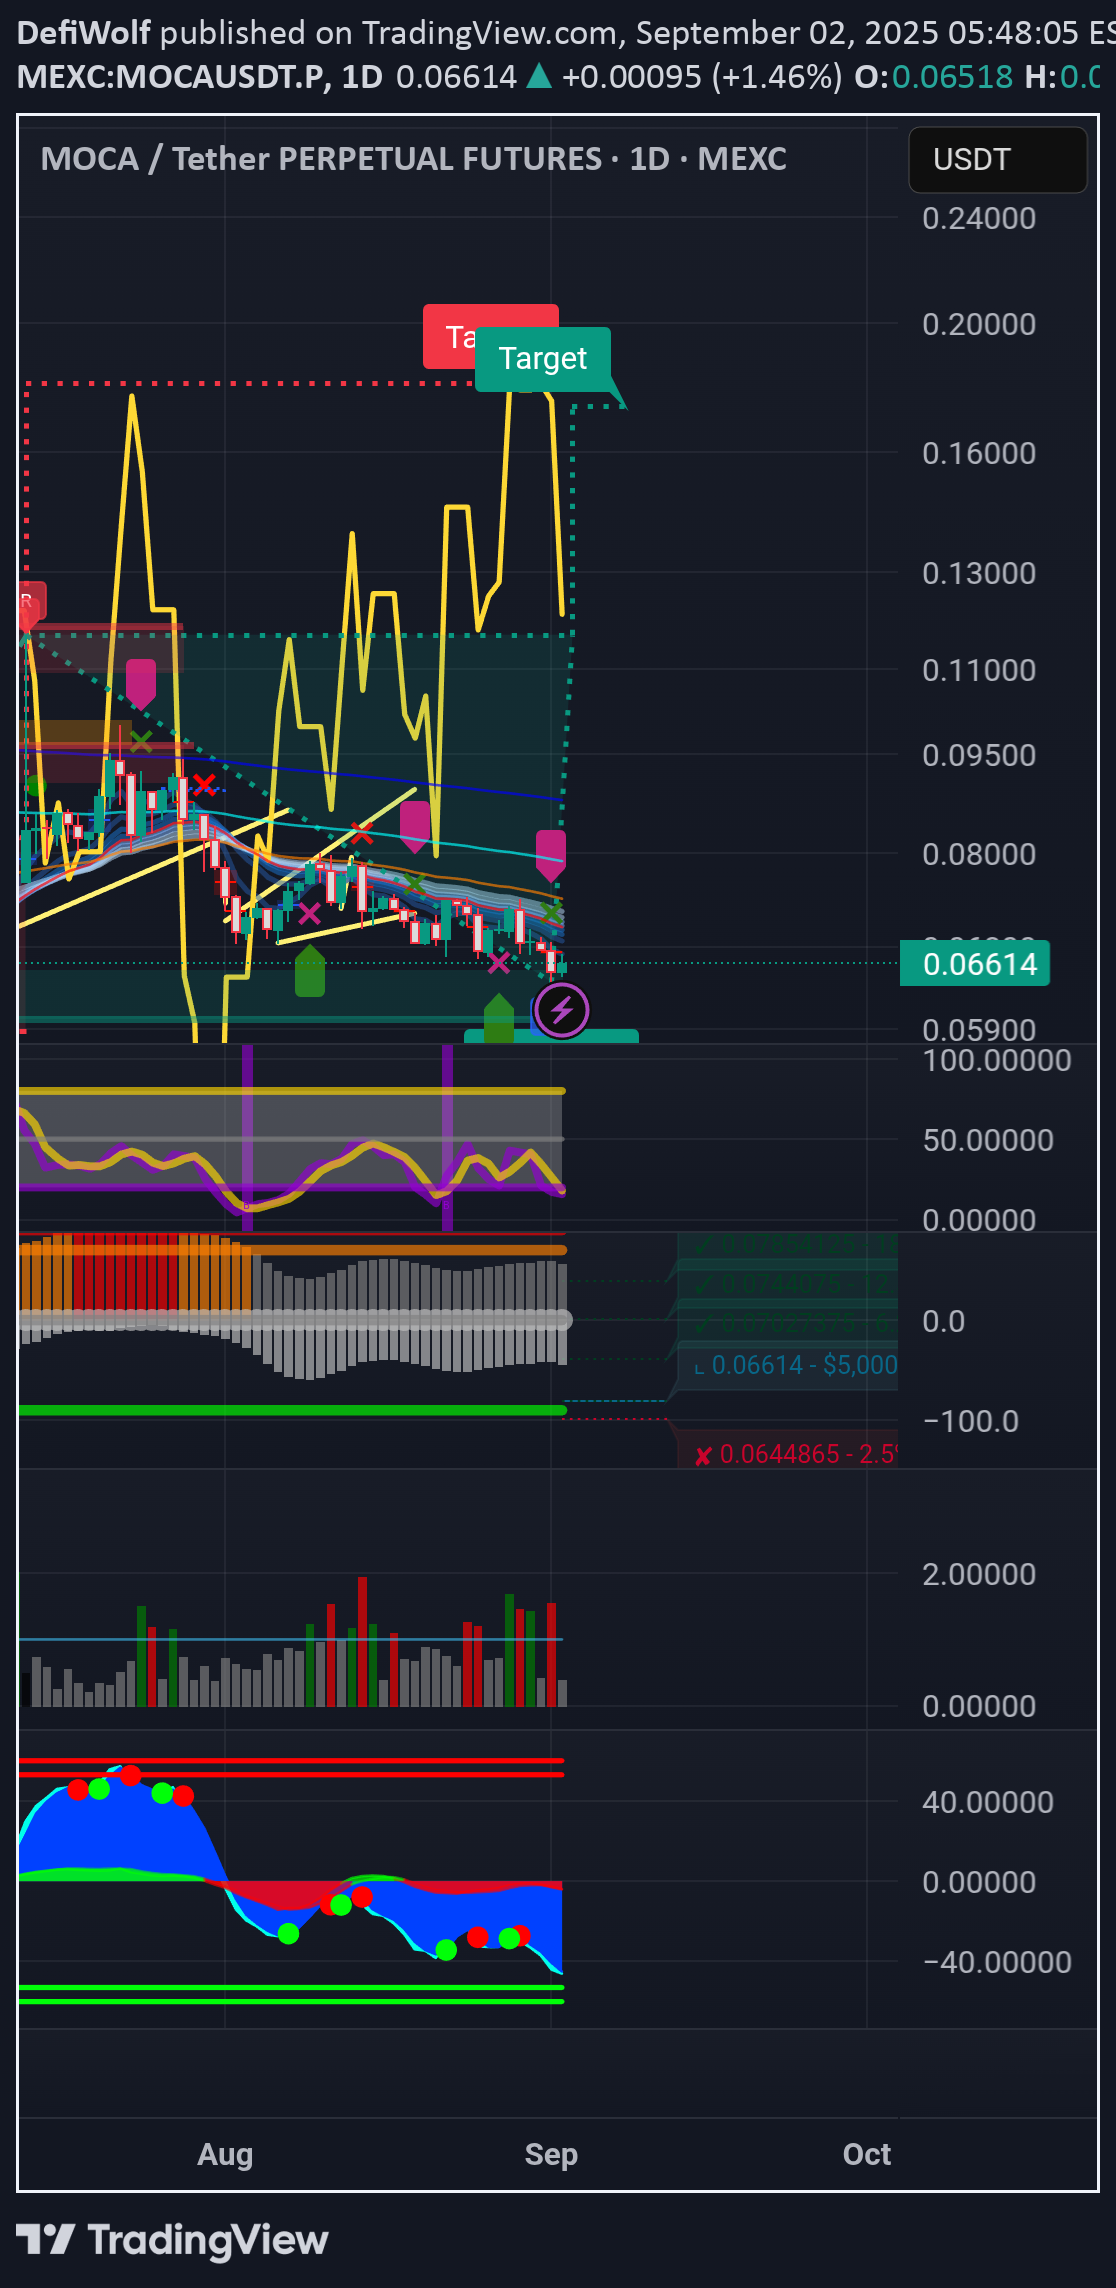
MOCA/USDT Sürekli Vadeli Günlük Grafiğine bakıldığında, yapı hala mevcut aralığa odaklanan birçok kişiyi şaşırtabilecek potansiyel bir orta vadeli move için kuruluyor. 🔍 Teknik Arıza 1. Destek ve birikim bölgesi Fiyat, hacimde görülebilen güçlü birikim işaretleri ile 0,066 dolar civarında stabilize ediyor. Alt fitiller yaklaşık 0.064-0.066 $ 'lık alıcıların bu bölgeyi savunmak için adım attığını öne sürüyor. 2. Göstergeler yanıp sönen geri dönüş Stoch RSI, genellikle patlayıcı hareketlerin bir öncüsü olan aşırı katlı bölgeden kıvrılıyor. Momentum osilatörleri yükselirken, fiyat destek olarak birleştirilir. Günlük histogram ve dalga göstergeleri düzleştirilir, satıcıların tükenmesini sinyal verir. 3. İzlenecek Anahtar Seviyeler Acil Direnç: 0.075-0.09 $ (kısa süreli sıkma bölgesi). Orta menzilli hedef: 0.11-0.13 $ (tarihsel arz). Major Hedef: 0,16-0.17 $ (move projeksiyon ve önceki direnç kümesi ölçülür). 📈 yükseliş senaryosu MOCA 0.075-0.08 $ aralığının üzerinde kararlı bir şekilde kapanabilirse, momentum tüccarları ve algos 0.11-0.13 $ 'lık bölgeye doğru bir kopuşa neden olabilir. 0,13 doların üzerinde bir kez, yol 0.16-0.17 makro hedef bölgesine açılır ve mevcut seviyelerden 2,5 x 'dan fazla yukarı doğru temsil eder. ⚠ood Risk Yönetimi MOCA kırılırsa ve 0,064 $ desteğinin altında kalırsa geçersiz kılınır. Kaldıraç tüccarları finansman oranlarını izlemelidir, çünkü ani sivri uçlar aşırı kalabalıklaşmaya işaret edebilir. Kârların 0.11, 0.13 ve nihai hedef 0.16-0.17'de ölçeklendirilmesi ihtiyatlıdır. 🧭 Final Take MOCA çok önemli bir noktadadır: tekniklerin yükselişini destekleyen düşüklerin yakınında birikim. Sabır anahtar olacaktır, ancak momentum değişirse, bu kurulum önümüzdeki seanslarda 0.16-0.17'ye kadar güçlü bir dalga sürme potansiyeline sahiptir.

AkinC
#Moca usdt $Moca
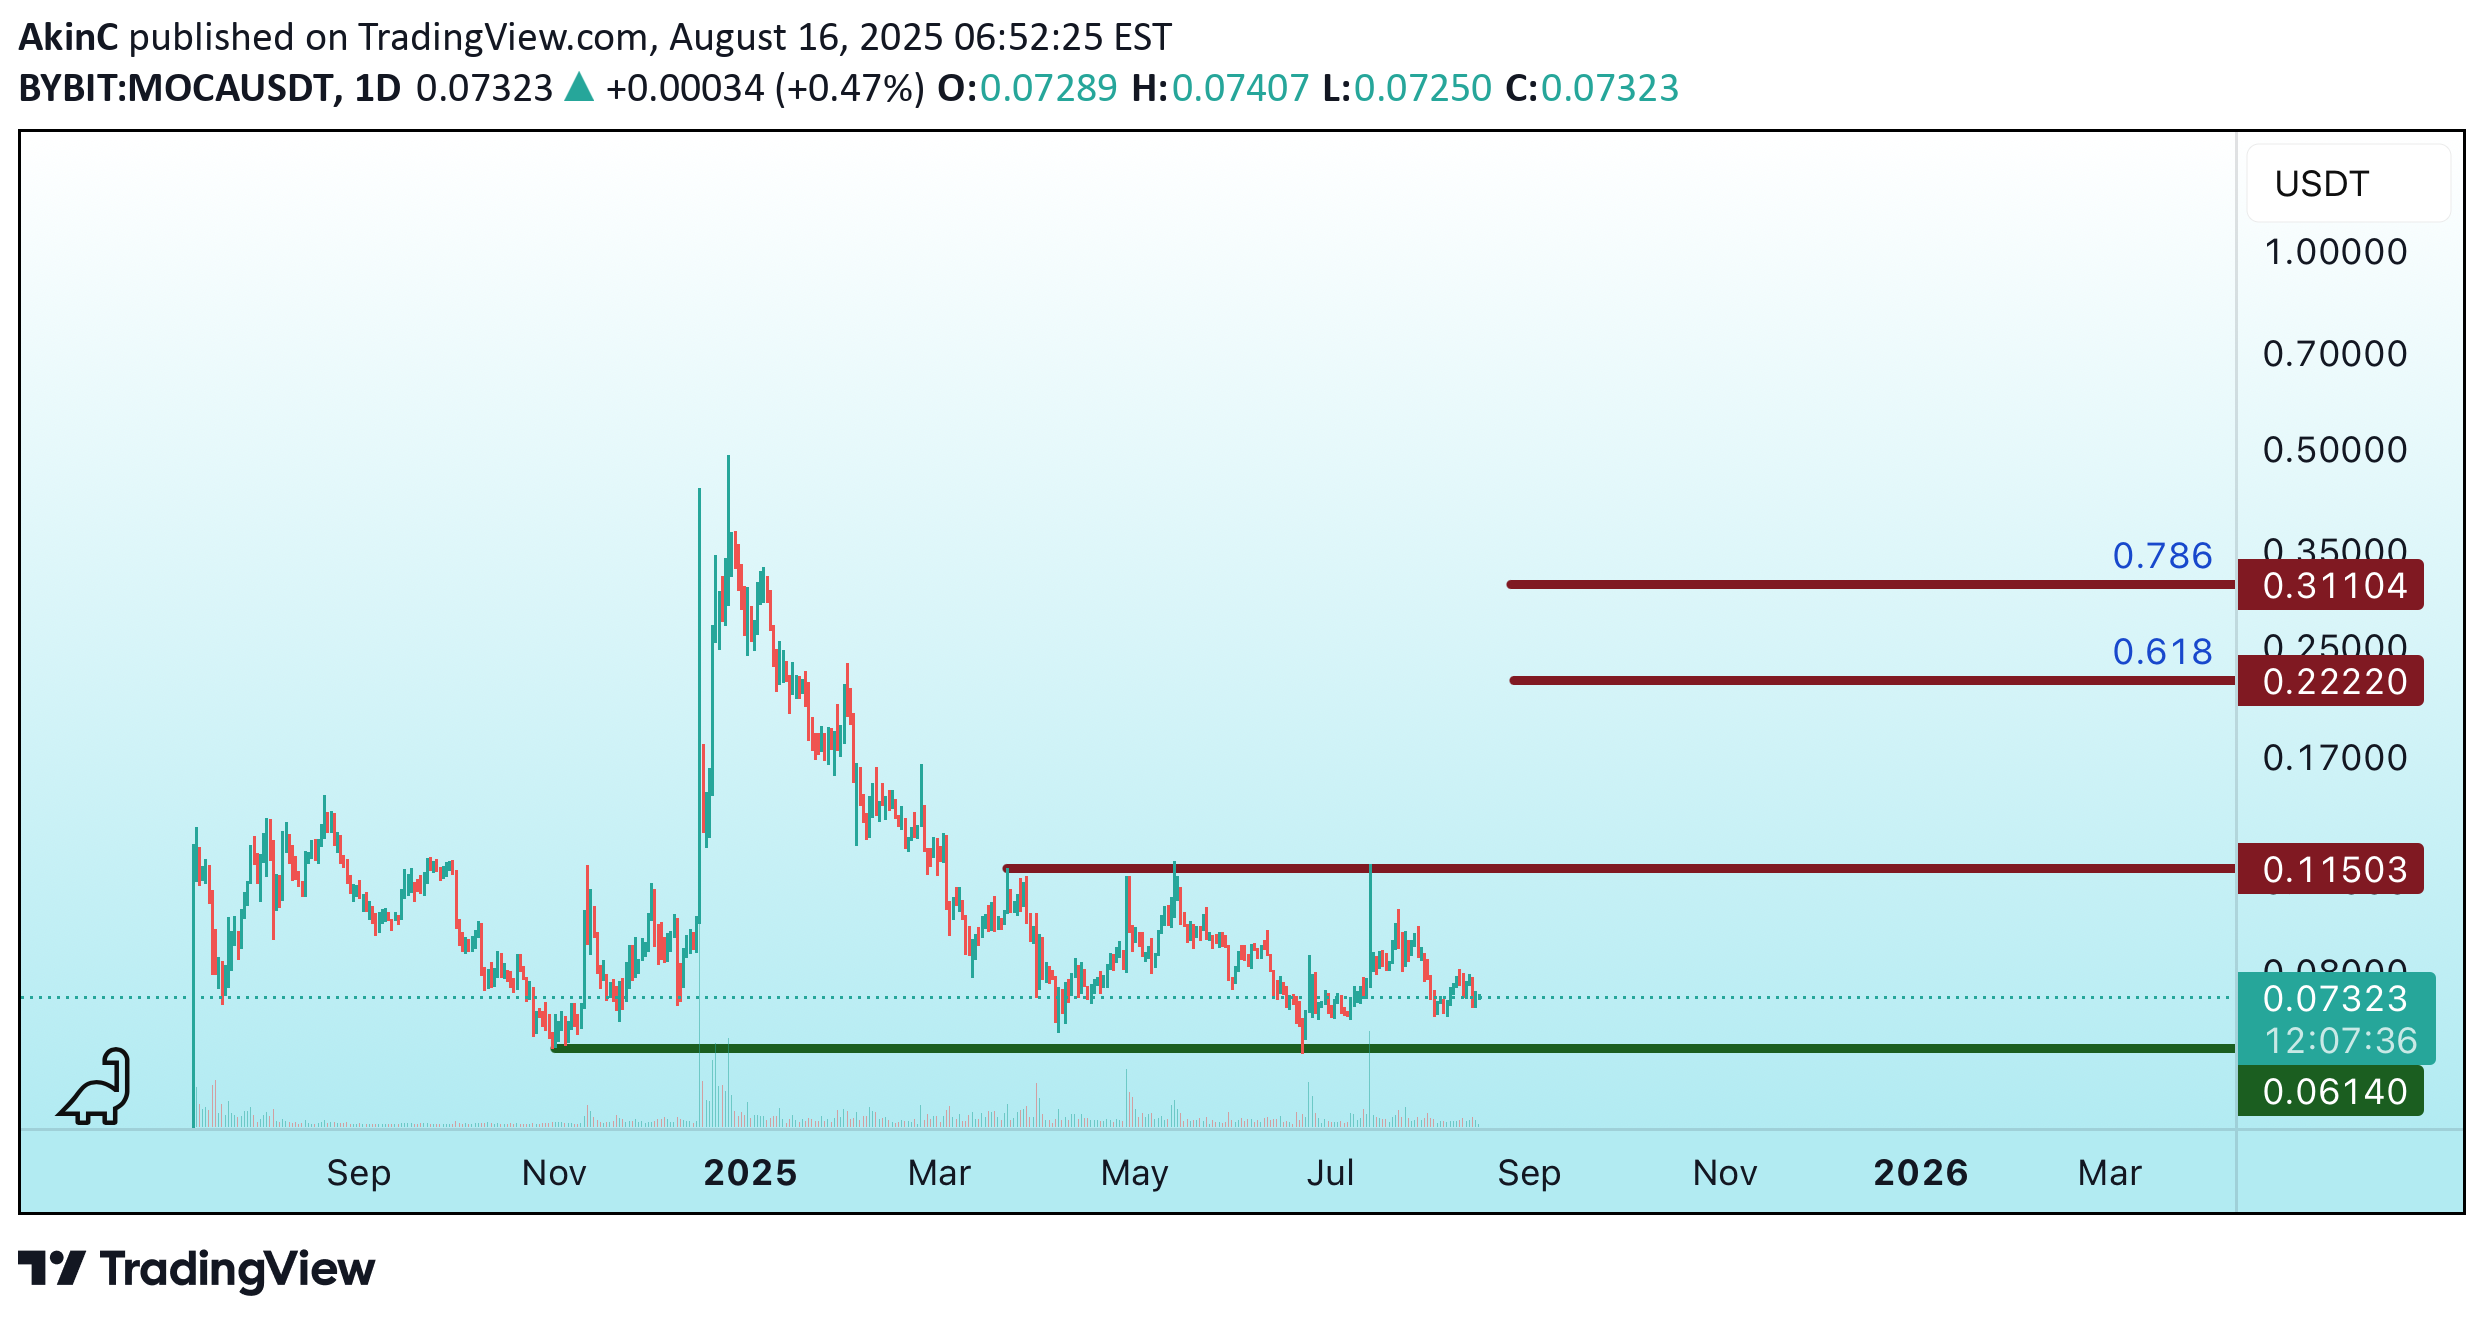
Önemli Destek: $ 0.0614 Önemli Direniş: 0.115 $ Mum önemli direncin üzerinde kapanırsa, sıralı hedefler: Hedef 1: $ 0.222 Hedef 2: $ 0.311

brandlabelden
MOCAUSDT: Oversold, Yet Ready to Explode? The Market Decides!

Is the Bottom In? MOCAUSDT Flashes Buy Signals! The crypto market never sleeps, and neither do opportunities. MOCAUSDT is currently hovering at $0.18582, down a staggering 62% from its all-time high of $0.48845 recorded just 39 days ago. But is this decline setting the stage for a major comeback? Technical indicators suggest we are at a make-or-break moment. The RSI14 is at 33.2, approaching oversold territory, while MFI60 sits at 43.8, indicating potential buying momentum. Moreover, the price is struggling near the 200 MA (0.18844), a critical level that could dictate the next major move. Interestingly, a series of VSA Buy Patterns have emerged over the past 48 hours, hinting at accumulation by smart money. Will this trigger the much-anticipated breakout, or is another dip inevitable? One thing is certain—the next move will be decisive. Are you ready to take advantage of it? MOCAUSDT Roadmap: Smart Money Moves and Key Market Reversals Understanding the market is all about catching the right waves at the right time. Let’s break down how MOCAUSDT moved recently, which patterns played out, and what traders can learn from these price shifts. * January 29: VSA Buy Pattern 3 – The market showed signs of a manipulation buy, signaling the start of an upward move from $0.17241 to $0.1772. This pattern was validated as price continued rising, confirming the bulls were stepping in. * January 30: Buy Volumes Max → Sell Volumes – A massive buying volume spike from $0.17809 pushed the price up to $0.19745, but sellers quickly took control, leading to a sharp reversal. This switch from buy to sell dominance marked a critical liquidity grab before the next wave. * January 31: VSA Sell Pattern 1 & 3 – A textbook manipulation sell setup, where price hit $0.22752 before retracing. This was the first major rejection confirming that the bullish move had peaked. Following this, VSA Buy Pattern Extra 2nd appeared at a lower price point, signaling accumulation near $0.20923. * February 1: VSA Manipulation Buy Pattern 4th – Smart money stepped back in, sending the price higher from $0.19388 to $0.19525, reinforcing the long bias. The key takeaway? Every strong dip in this cycle was met with aggressive buybacks. * February 2: VSA Buy Pattern Extra 2nd – The latest signal showed another attempt at accumulation, with price stabilizing around $0.18867. However, the move lacked the aggressive momentum seen in previous buy setups, meaning traders should watch for confirmations before jumping in. Conclusion: Reading the Tape MOCAUSDT has been in a highly reactive accumulation-distribution cycle, where every liquidity grab led to a strong price reaction. The roadmap suggests smart money is accumulating, but not in a rush to push the price up aggressively. For traders, the key levels to watch are whether buyers step in at the recent $0.185 range, or if we see another liquidity grab before the real move. Are we gearing up for a breakout, or is another shakeout on the horizon? Stay sharp, and trade smart. Technical & Price Action Analysis: Key Levels to Watch MOCAUSDT is playing the range game, bouncing between key levels. Here’s what traders need to keep on their radar: Support Levels: * 0.17241 – If buyers don’t defend this level, expect it to flip into resistance, trapping late longs. * 0.16567 – A critical retest zone; failure to hold means lower bids will get tested. * 0.16455 – The last line of defense before deeper corrections. Resistance Levels: * 0.25966 – The first real battle for bulls; if price rejects, expect a fade back into the range. * 0.2951 – Major liquidity zone; breaking above could trigger a trend shift. * 0.31409 – If bulls clear this, game on for the next leg up. Powerful Support Levels: * 0.2371 – Big money has been watching this level. If it doesn’t hold, sellers will start dictating the trend. Powerful Resistance Levels: * 0.08949 & 0.06603 – Levels that could cap any weak breakouts. If price stalls here, expect consolidation or a fakeout before the next real move. Trade Logic: If support levels don’t hold, they flip into resistance, and every failed breakout becomes a new short opportunity. The market isn’t giving out free money—trade smart, wait for confirmations, and don’t get caught chasing weak moves. Trading Strategies Using Rays: Navigating MOCAUSDT Moves with Precision The market moves in waves, but instead of relying on static levels, we focus on Fibonacci Rays—dynamic price structures that outline the natural rhythm of movements. These rays, based on mathematical and geometric principles, give us a predictive roadmap where price reacts, either bouncing or breaking through. Key takeaway? Trade after price interacts with a ray and confirms direction. The movement will continue from one ray to the next, forming the key targets of our trade. Optimistic Scenario: Bulls Take Control If buyers step in at key Fibonacci ray intersections, we can expect a continuation to higher levels. The first confirmation will be the price breaking above MA200 (0.18844) and staying above. Entry: Buy after price interacts with a ray at 0.17241, forming a reversal. First target: 0.2371 – The next ray and powerful support turned resistance. Second target: 0.25966 – A strong resistance level where a pullback could occur. Final bullish target: 0.2951 – If momentum stays strong, this is the next major liquidity grab zone. Pessimistic Scenario: Sellers in Control If the price fails to hold MA200 (0.18844) and breaks below Fibonacci rays, expect a move lower to the next liquidity zone. Entry: Sell after rejection at 0.18844 if price fails to reclaim it. First target: 0.17241 – The closest ray where buyers might step in. Second target: 0.16567 – If weakness persists, this is the next stop. Final bearish target: 0.16455 – The ultimate support before deeper losses. Trade Ideas: Key Setups to Watch Ray-to-Ray Bullish Breakout: Buy above 0.18844, target 0.2371, stop-loss below 0.17241. Ray-to-Ray Bearish Breakdown: Sell below 0.18844, target 0.17241, stop-loss above 0.19525. Range Rebound Trade: Buy near 0.17241, take profits at 0.18844, stop-loss below 0.16567. Momentum Scalping: If price bounces at 0.2371, buy and target 0.25966, stop-loss below 0.225. All these setups are backed by VSA rays, which are already plotted on the chart—so stay patient, wait for interaction, and ride the move from ray to ray. Your Move, Traders! 🚀 That’s the full breakdown—now it’s your turn! Got questions? Drop them right in the comments below, and let’s discuss the best trading setups together. If you found this analysis useful, hit Boost and save this idea—you’ll want to check back and see how price respects these rays. Trading isn’t about guessing, it’s about understanding key reaction points, and now you have them. My private strategy automatically plots all rays and levels, making trade setups clear and structured. If you’re interested in using it, shoot me a private message—it’s exclusive, but we can discuss how you can get access. Need analysis on a different asset? I can chart any market with precision. Some ideas I share for free, while others can be done privately—depends on what you need. Let me know in the comments which asset you want covered next, and if there’s enough interest, I’ll make it happen! And of course, if you’re serious about trading—follow me on TradingView. That’s where all the real-time updates and insights go first. See you in the next one! 🔥

kozalakfirat
Mocausdt
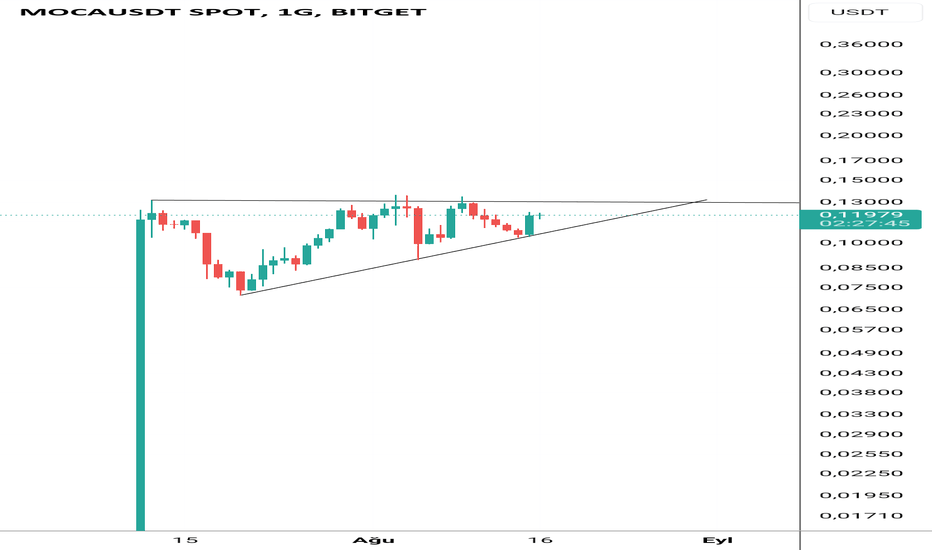
Hersey hazir kirilimi bekliyoruz. Yatirim tavsiyesi degildir illa alim yapilacaksa sahsi fikrim kirilim olmasi ve gun kapanisi olmasidir.
Sorumluluk Reddi
Sahmeto'nun web sitesinde ve resmi iletişim kanallarında yer alan herhangi bir içerik ve materyal, kişisel görüşlerin ve analizlerin bir derlemesidir ve bağlayıcı değildir. Borsa ve kripto para piyasasına alım, satım, giriş veya çıkış için herhangi bir tavsiye oluşturmazlar. Ayrıca, web sitesinde ve kanallarda yer alan tüm haberler ve analizler, yalnızca resmi ve gayri resmi yerli ve yabancı kaynaklardan yeniden yayınlanan bilgilerdir ve söz konusu içeriğin kullanıcılarının materyallerin orijinalliğini ve doğruluğunu takip etmekten ve sağlamaktan sorumlu olduğu açıktır. Bu nedenle, sorumluluk reddedilirken, sermaye piyasası ve kripto para piyasasındaki herhangi bir karar verme, eylem ve olası kar ve zarar sorumluluğunun yatırımcıya ait olduğu beyan edilir.