
DOT
Polkadot
| تریدر | نوع سیگنال | حد سود/ضرر | زمان انتشار | مشاهده پیام |
|---|---|---|---|---|
 AAK_Sıralama: 3936 | خرید | حد سود: تعیین نشده حد ضرر: تعیین نشده | 19.12.2025 | |
خرید | حد سود: تعیین نشده حد ضرر: تعیین نشده | 18.12.2025 | ||
 ULYSSESTRADERSıralama: 32197 | خرید | حد سود: تعیین نشده حد ضرر: تعیین نشده | 29.11.2025 |

Polkadot Fiyat Grafiği
سود Üç Ay :
خلاصه سیگنالهای Polkadot
سیگنالهای Polkadot
filtre
Mesajı şuna göre sırala
Tüccar Türü
timeframe
AAK_
DOT/USD
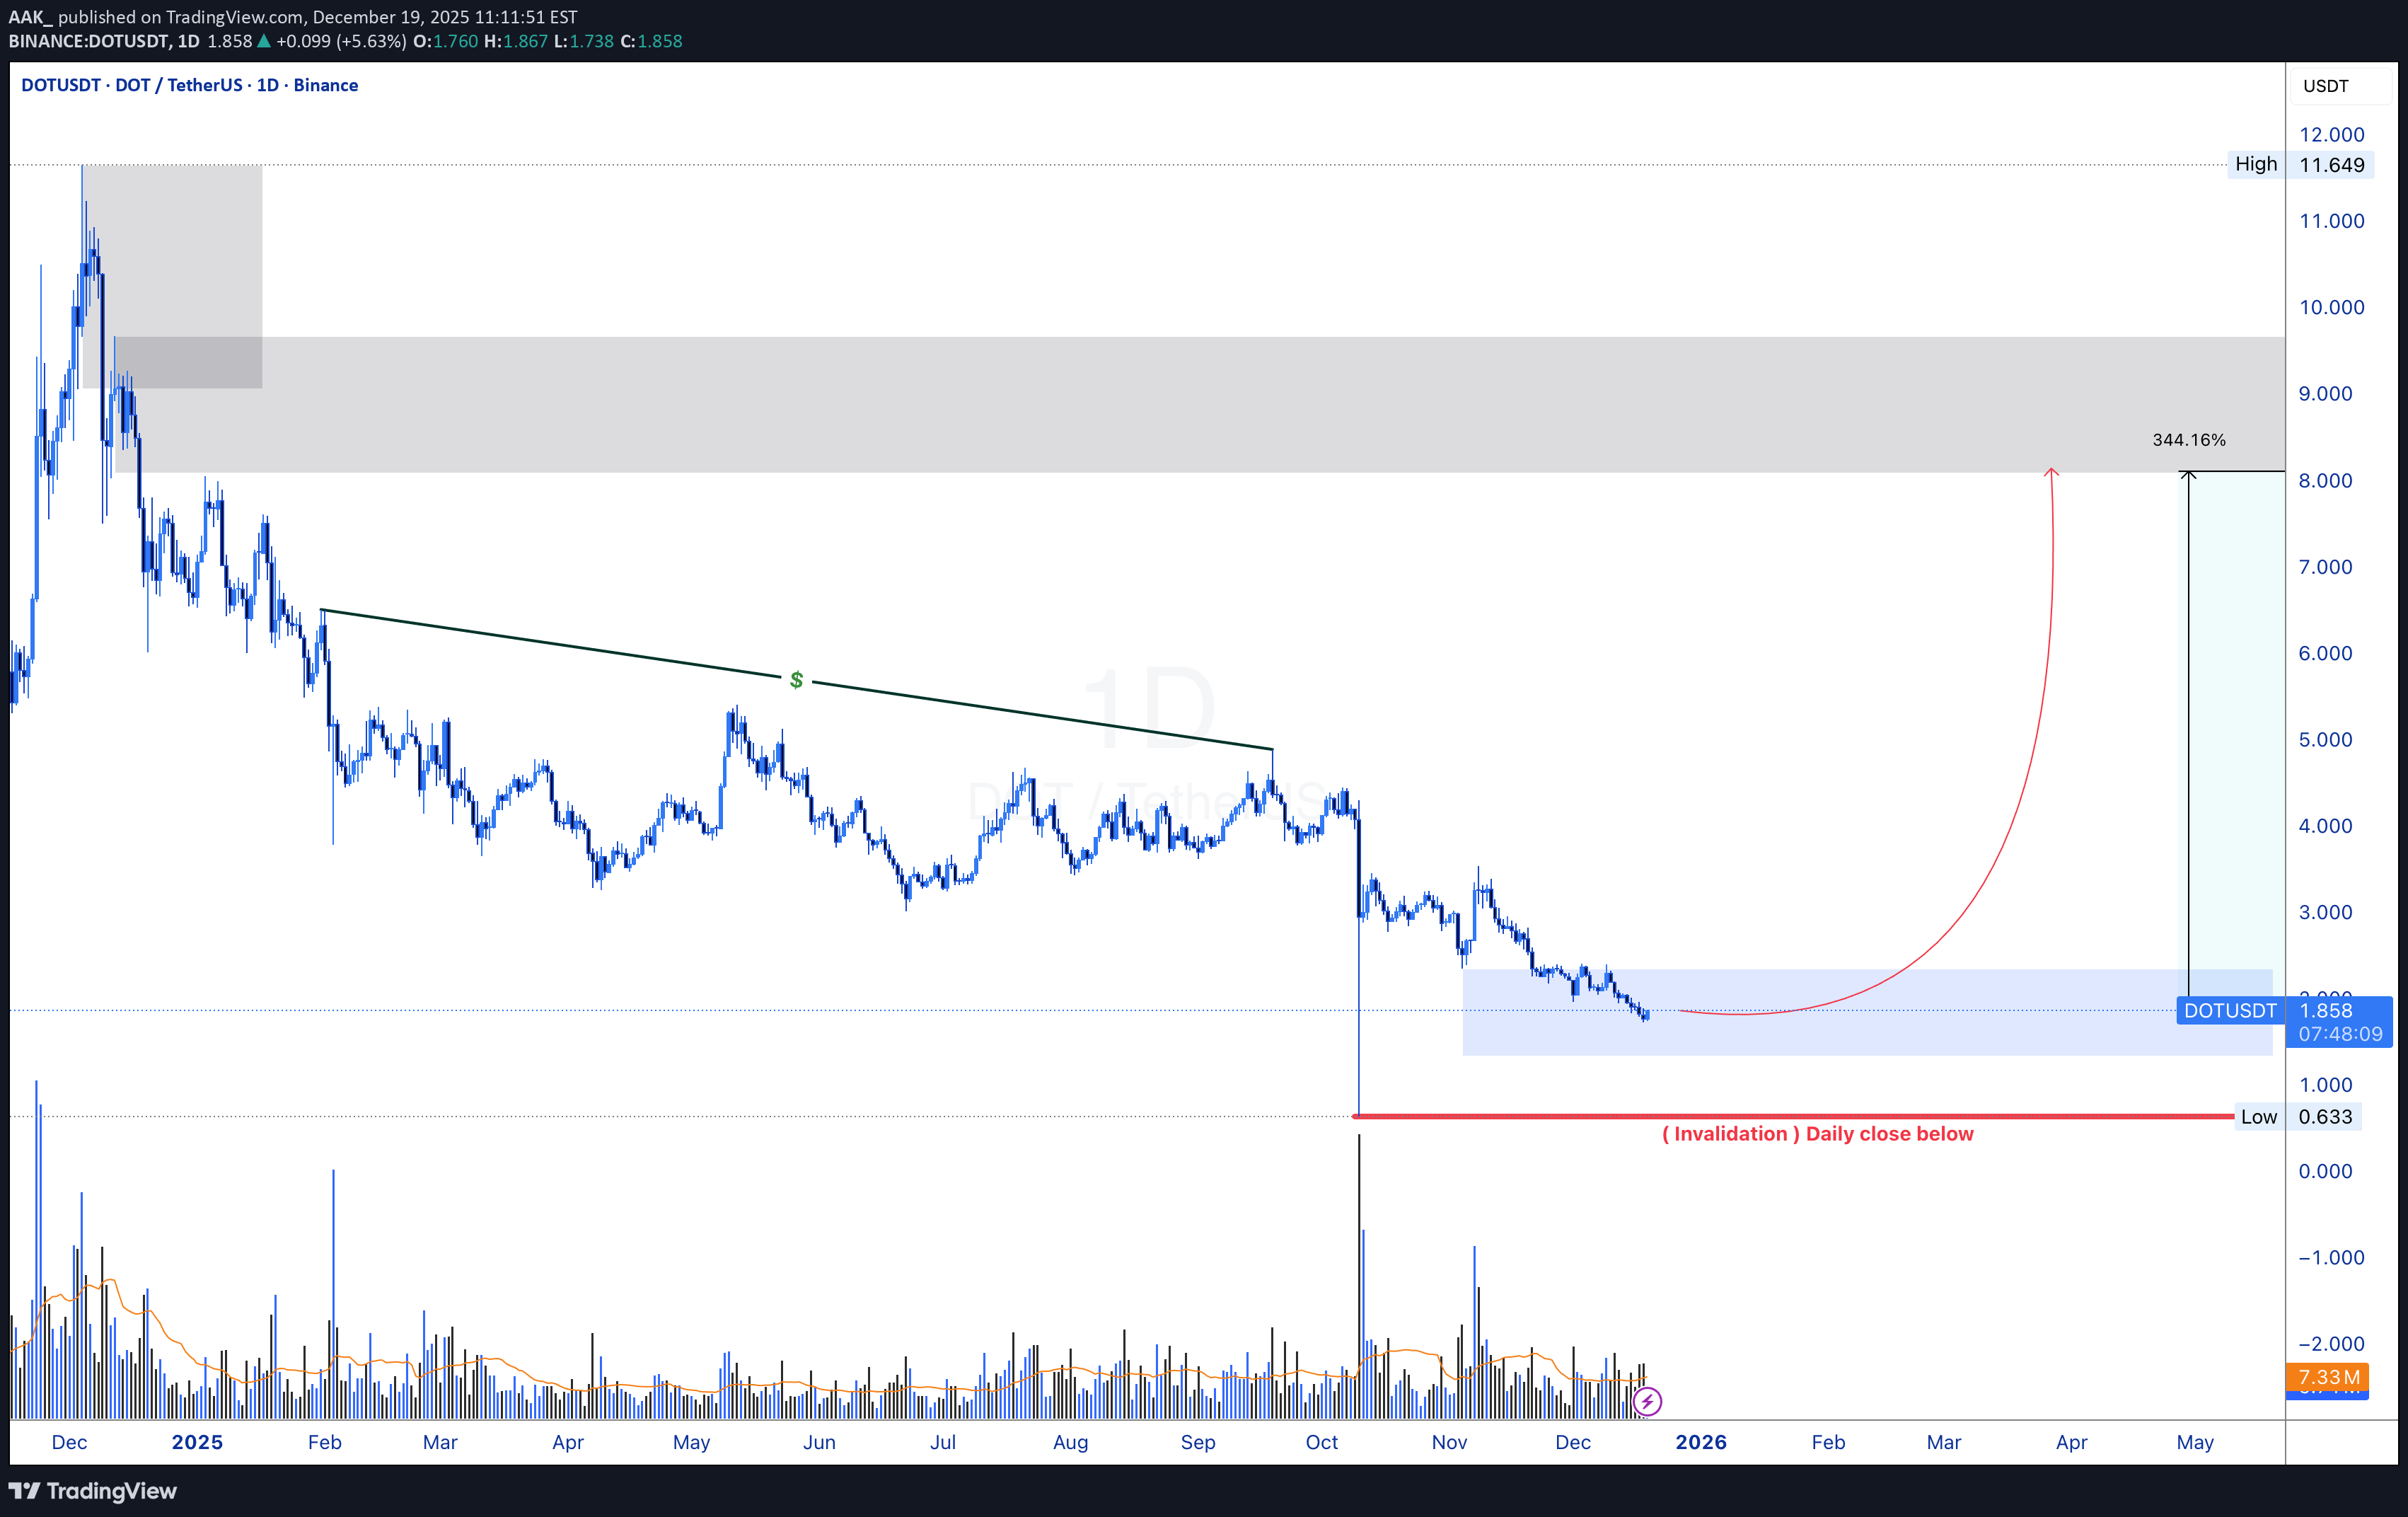
SSL alındı → (yukarı yönlü)Potansiyel yükseliş eğilimi Azaltma amacıyla arzın geri çekilmesi bekleniyor Bu uzun vadeli bir beklentidir ve 2026'nın başlarında (1. Çeyrek) öngörülmektedir. (Bu finansal tavsiye değildir. Riski size ait olmak üzere işlem yapın)
تحلیل تکنیکال DOTUSDT: سیگنال صعودی قوی با واگرایی مثبت! (اهداف و حد ضرر)
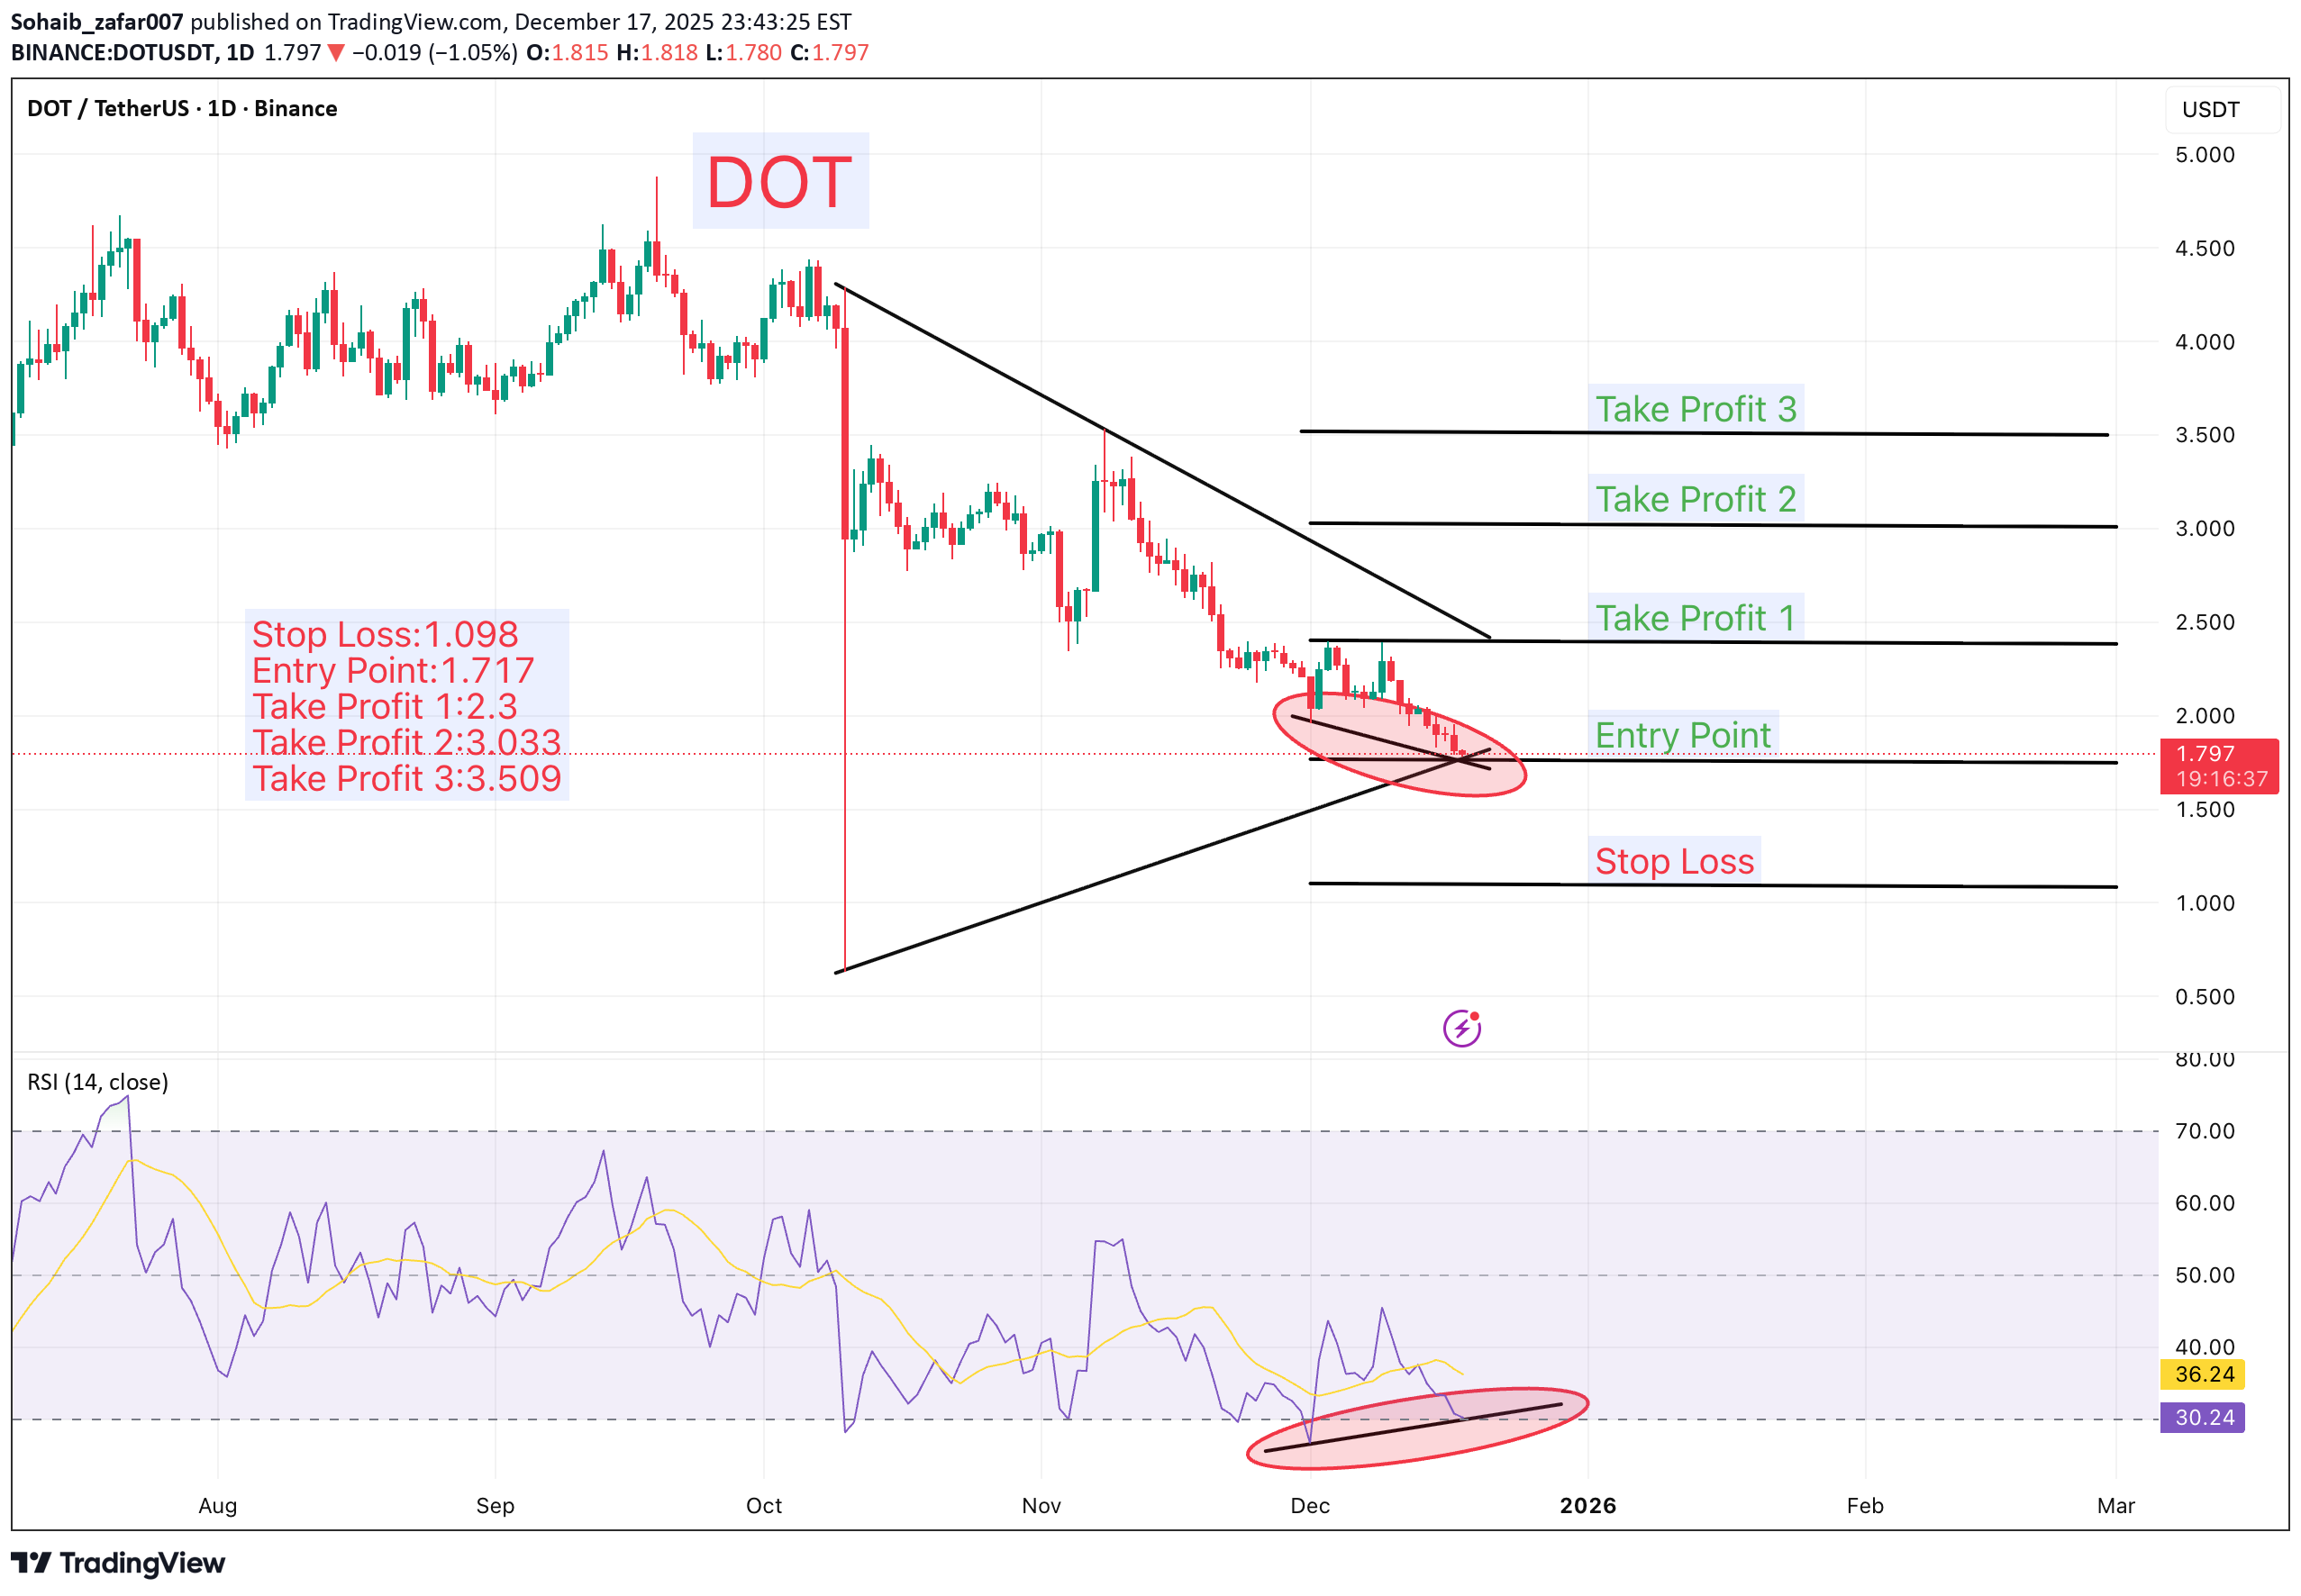
Zararı Durdur: 1.098 Giriş Noktası: 1.717 Kâr Al 1: 2.300 Kâr Al 2: 3.033 Kâr Al 3: 3.509 1G, 4H ve 1H zaman dilimlerinde yükseliş eğilimi oluştu ve bu durum düşüş eğiliminden yükseliş eğilimine potansiyel bir dönüşe işaret ediyor. Önerilen giriş 1,717 civarında olup, fiyatın 2,300, 3,033 ve 3,509 olarak öngörülen hedeflere doğru move olması bekleniyor. ⚠️ Doğru stop-loss ve disiplinli risk yönetimi ile sermayenizi korumayı her zaman unutmayın.

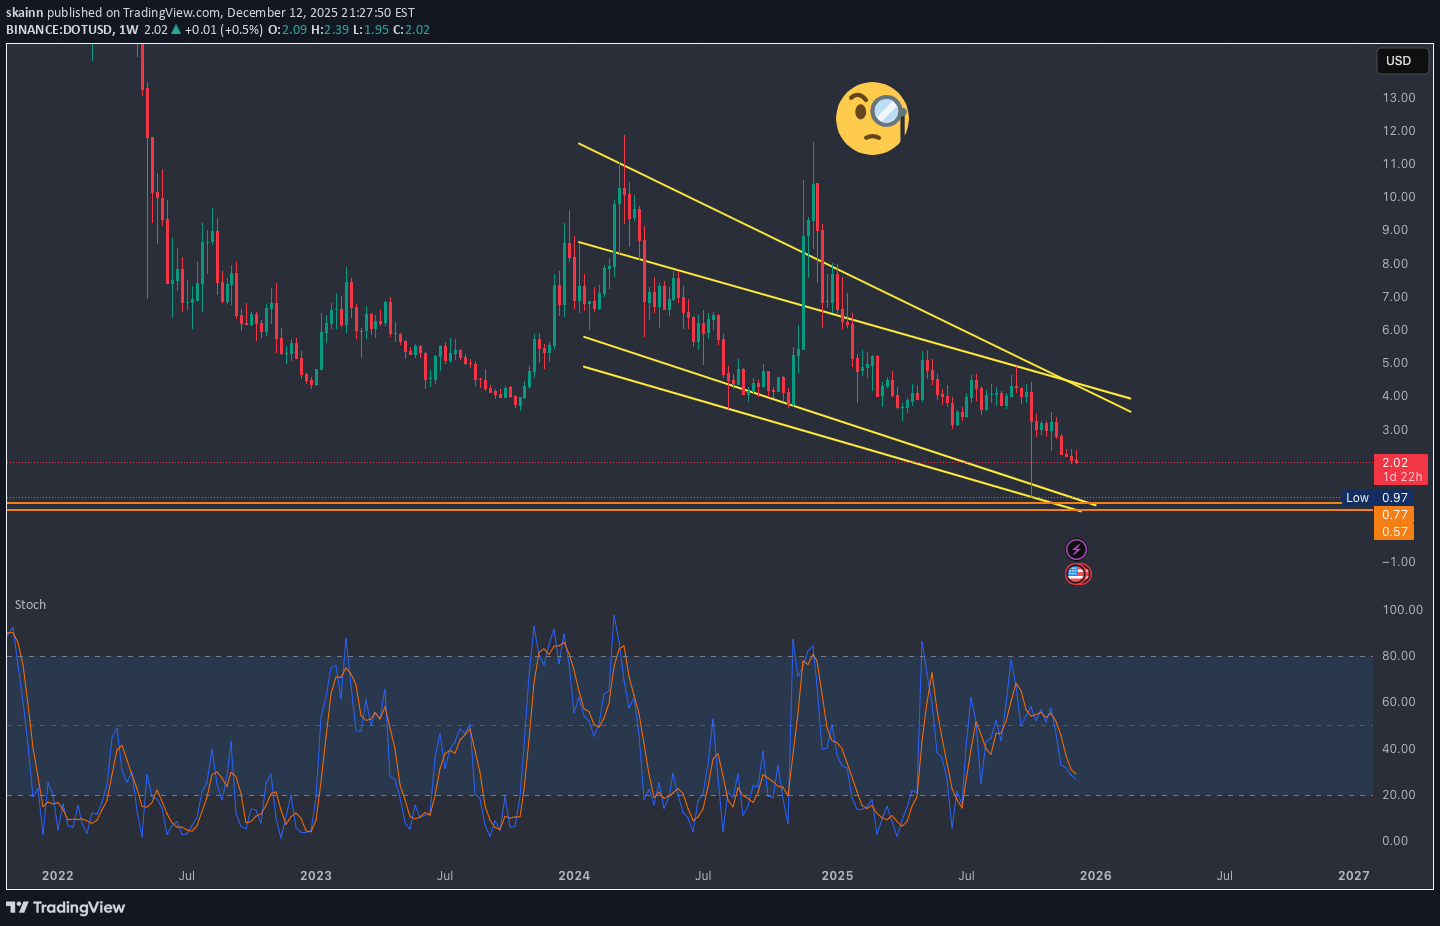
skainn


OpenYourMind1318
POLKADOT DOT DOTUSD 1W TF
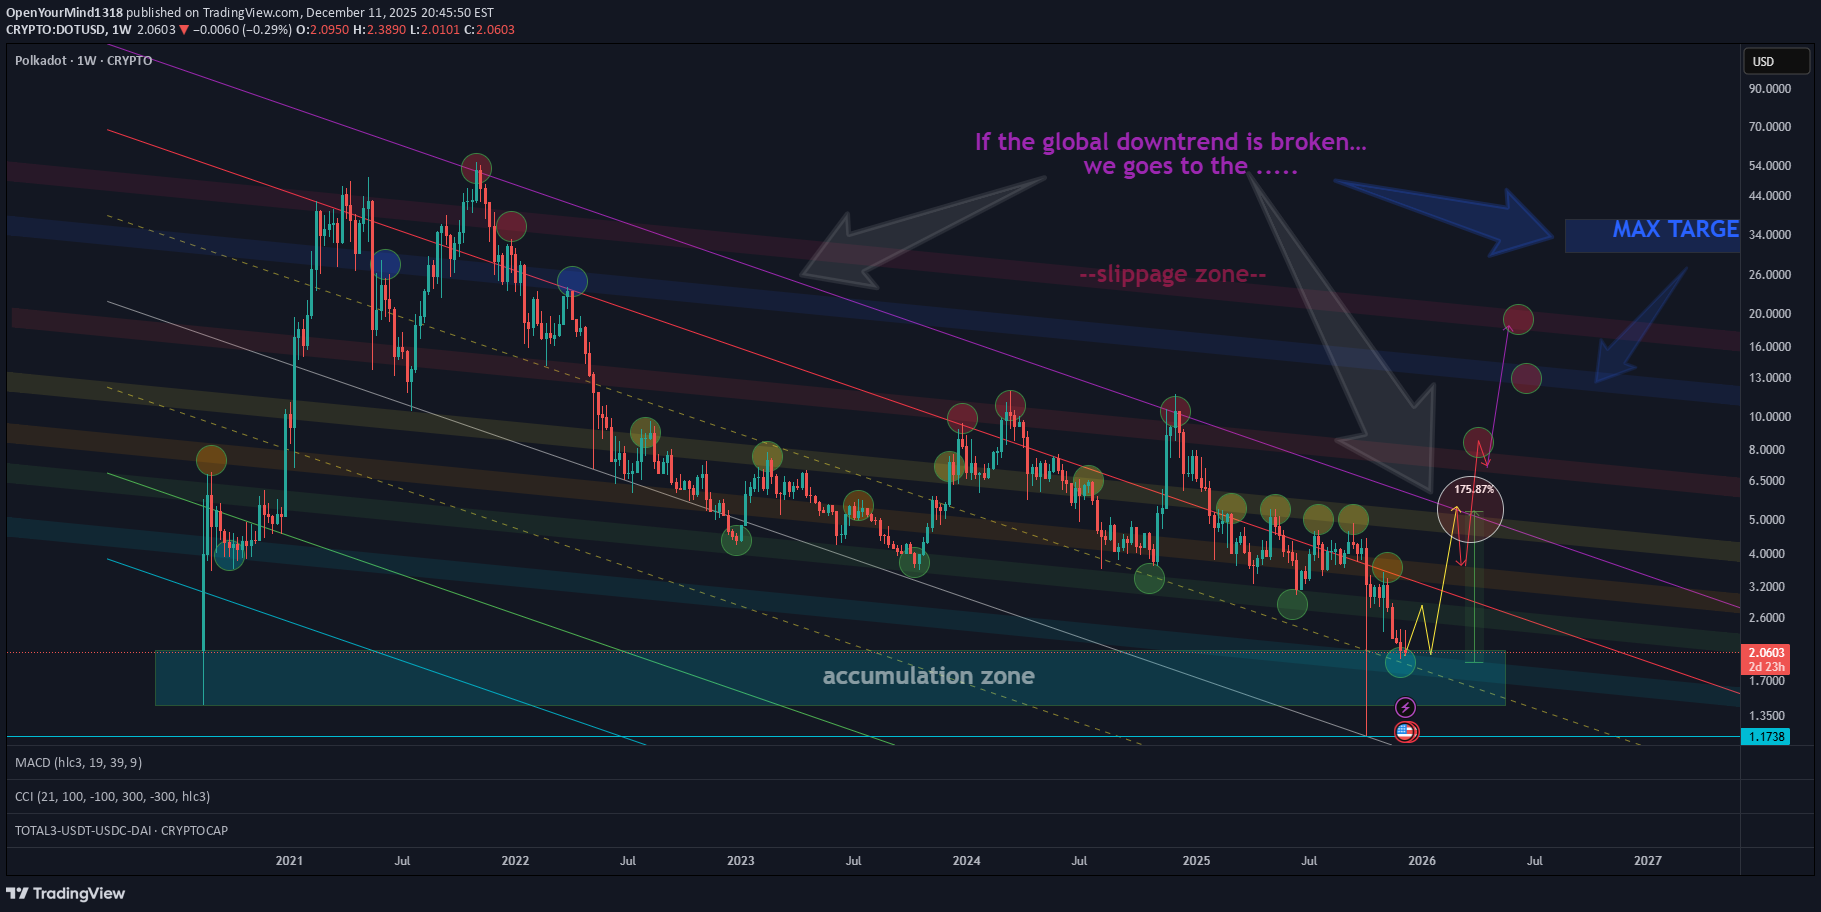
Grafik, destek ve direnç seviyelerinin yanı sıra küresel alçalan kanala kadar olan hedefleri de gösteriyor. Küresel düşüş trendi kırılırsa maksimum hedef mavi bölgedir. red bölgesi, mavi bölgeden kaynaklanan kısa süreli sıkışma alanını temsil eder; bu meydana gelebilir veya gelmeyebilir ve sıkışma daha önce de meydana gelebilir. Şu anda varlığın birikim bölgesindeyiz.
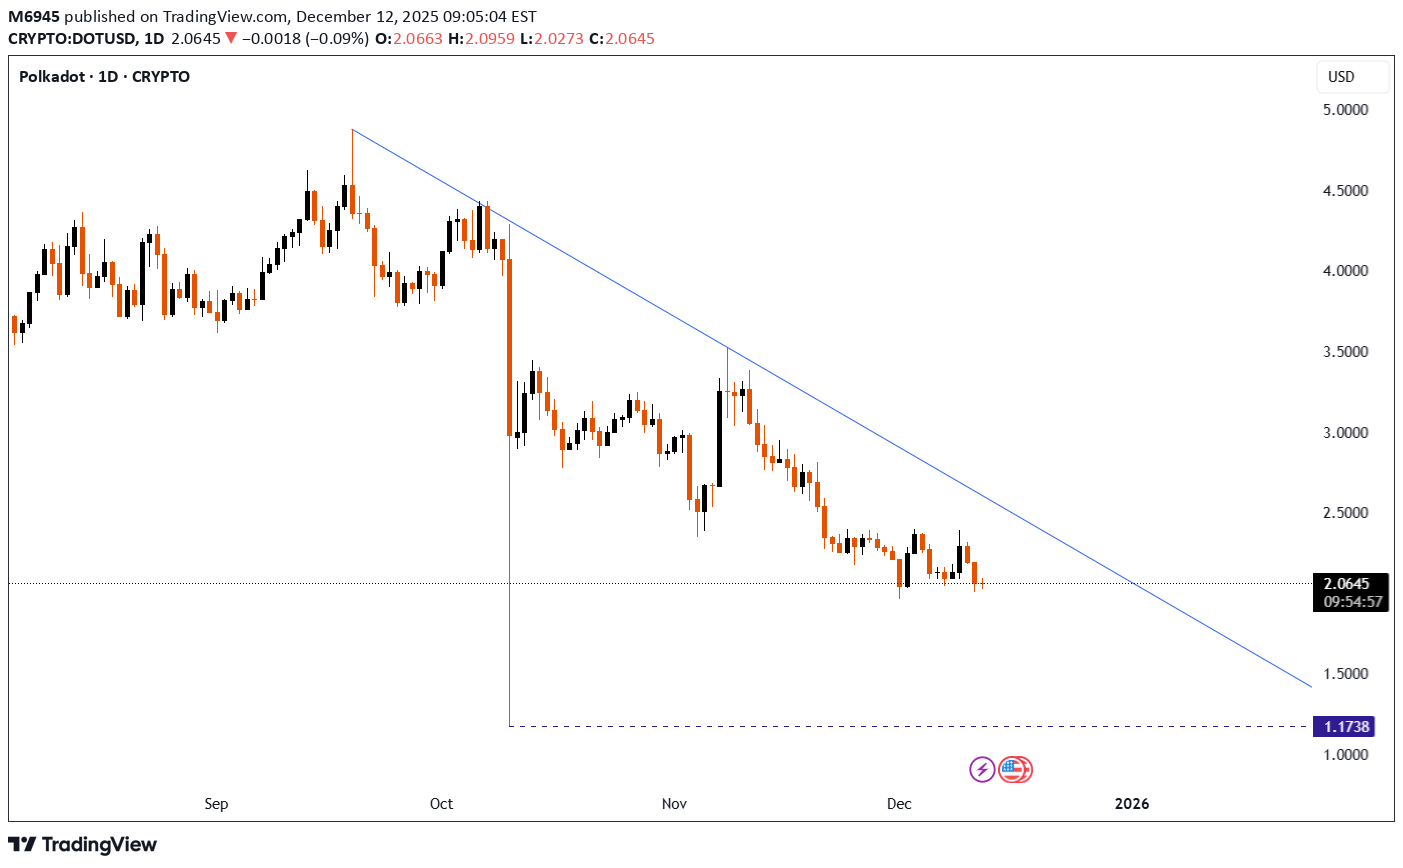
پولکادات (DOT) در آستانه جهش بزرگ؟ منتظر واکنش از ناحیه کلیدی بمانید!
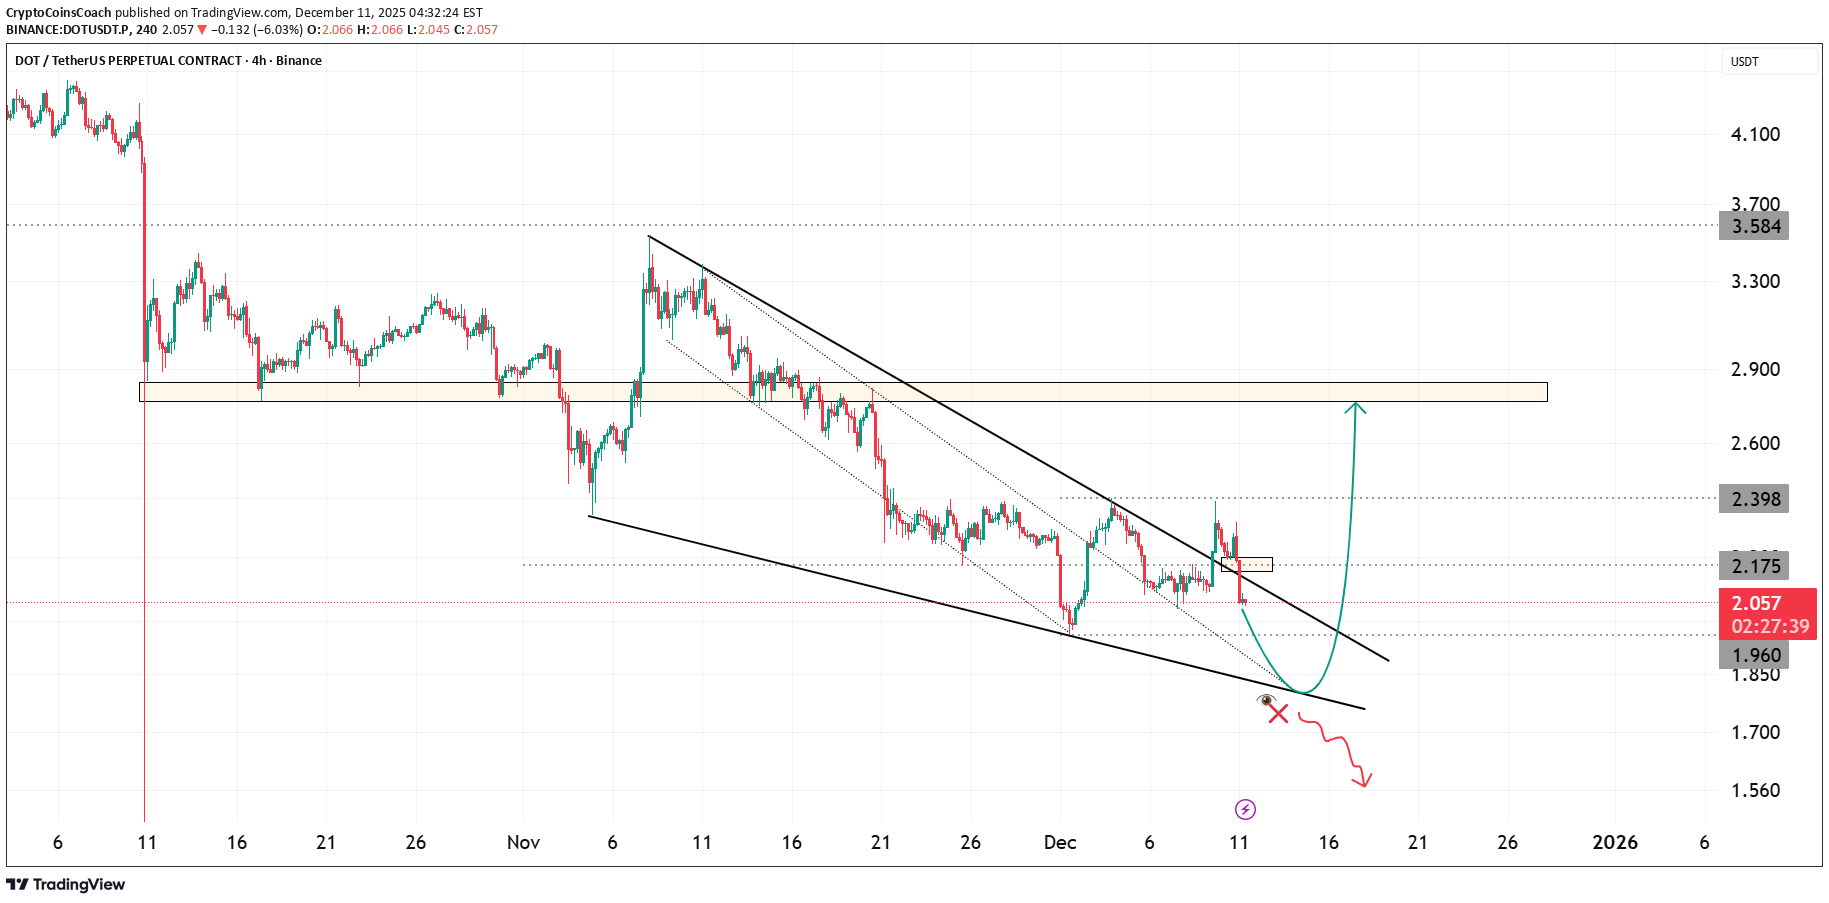
DOT, Kasım başından bu yana piyasaya yön veren, iyi tanımlanmış bir düşen takoz içinde işlem görmeye devam ediyor. Fiyat yakın zamanda orta aralığı reddetti ve şimdi takozun alt sınırına doğru ilerliyor. Bu alan geçmişte birçok kez likidite cebi ve reaksiyon bölgesi olarak görev yaptı. Fiyat alt trend çizgisine ulaşır ve istikrarlı bir reaksiyon gösterirse bu noktadan itibaren temiz bir rahatlama dalgası başlayabilir. Sonraki major hedefleri iki bölgede yer alır. Birincisi, iki virgül bir yediye yakın kanal ortası direnci. İkincisi, fiyatın önceki denemelerde birçok kez başarısız olduğu, iki virgül dokuz civarındaki daha geniş düşüş red bölgesidir. Alt kanal desteğinin kırılması bu yükseliş senaryosunu geçersiz kılacak ve daha derin diplere doğru alan açabilir. Kama zeminine yakın reaksiyon bir sonraki yön ayağını belirleyecek. Bu kurulum piyasa yapısına, trend çizgisi davranışına, kanal dinamiklerine ve likidite taramalarına odaklanır. Bir tahminden ziyade reaksiyona dayalı bir bakış açısı olmaya devam ediyor. Bu ortamda ticaret yönetimi ve risk kontrolü hayati önem taşıyor.

mastercrypto2020
سیگنال خرید فوری DOT/USDT: فرصت سود ۳ برابری با اهداف مشخص!
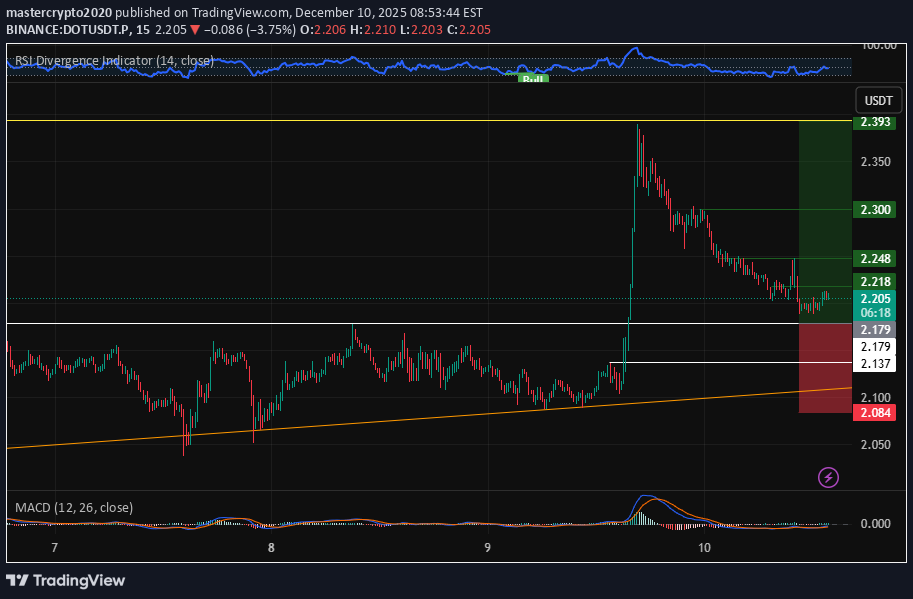
--- 📢 Resmi Ticaret Sinyali – DOT/USDT 📈 Pozisyon Türü: UZUN 💰 Giriş Fiyatı: 2.179 (Limitli Emir) --- 🎯 Kâr Alma Hedefleri (Kısmi Çıkışlar): • TP1: 2,218 • TP2: 2,248 • TP3: 2.300 • TP4: 2,393 • TP5: — --- 🛑Zarar Durdurma: 2.084 📊 Zaman aralığı: 15m ⚖️ Risk/Ödül Oranı: ≈ 2,25 (TP4'e göre) 💥 Önerilen Kaldıraç: 3× – 5× --- 🧠 Teknik Analiz Özeti DOT, 2,179 civarındaki önemli bir destek bölgesinin yakınında istikrar kazandıktan sonra potansiyel yükseliş momentumunu gösteriyor. Anlık direncin üzerinde başarılı bir kırılma, daha yüksek zaman dilimi likidite alanlarına doğru bir move tetikleyebilir. 15m grafik yapısı, önceki yüksek seviyelere ve sipariş defteri likidite seviyelerine uygun net hedeflerle olası bir yukarı doğru kaymayı işaret ediyor. Kritik yukarı hedefler: 2,218 → 2,248 → 2,300 → 2,393 TP1'in (2,218) üzerinde sürdürülebilir bir move, momentumu 2,300 ve 2,393'e doğru hızlandırabilir. --- ⚙️ Ticaret Yönetim Kuralları ✔ Her TP seviyesinde kısmi kar elde edin ✔ Move TP1'e ulaşıldığında giriş noktasına zararı durdurma ✔ Fiyat daha yüksek hedeflere doğru ilerledikçe zararı durdurmanın izini sürün ✔ Zararı durdur (2.084) tetiklenirse yeniden giriş olmaz ✔ Girmeden önce 15m grafiğindeki yükseliş yapısını onaylayın --- 📌 TradingView Hashtagleri #DOTUSDT #DOT #CryptoSignal #LongTrade #TradingView #Vadeli İşlemlerTrading #TeknikAnaliz --- Bunun Farsçaya çevrilmesini veya herhangi bir şekilde düzeltilmesini istiyorsanız bana bildirin.

House-of-Technicals
Double bottom
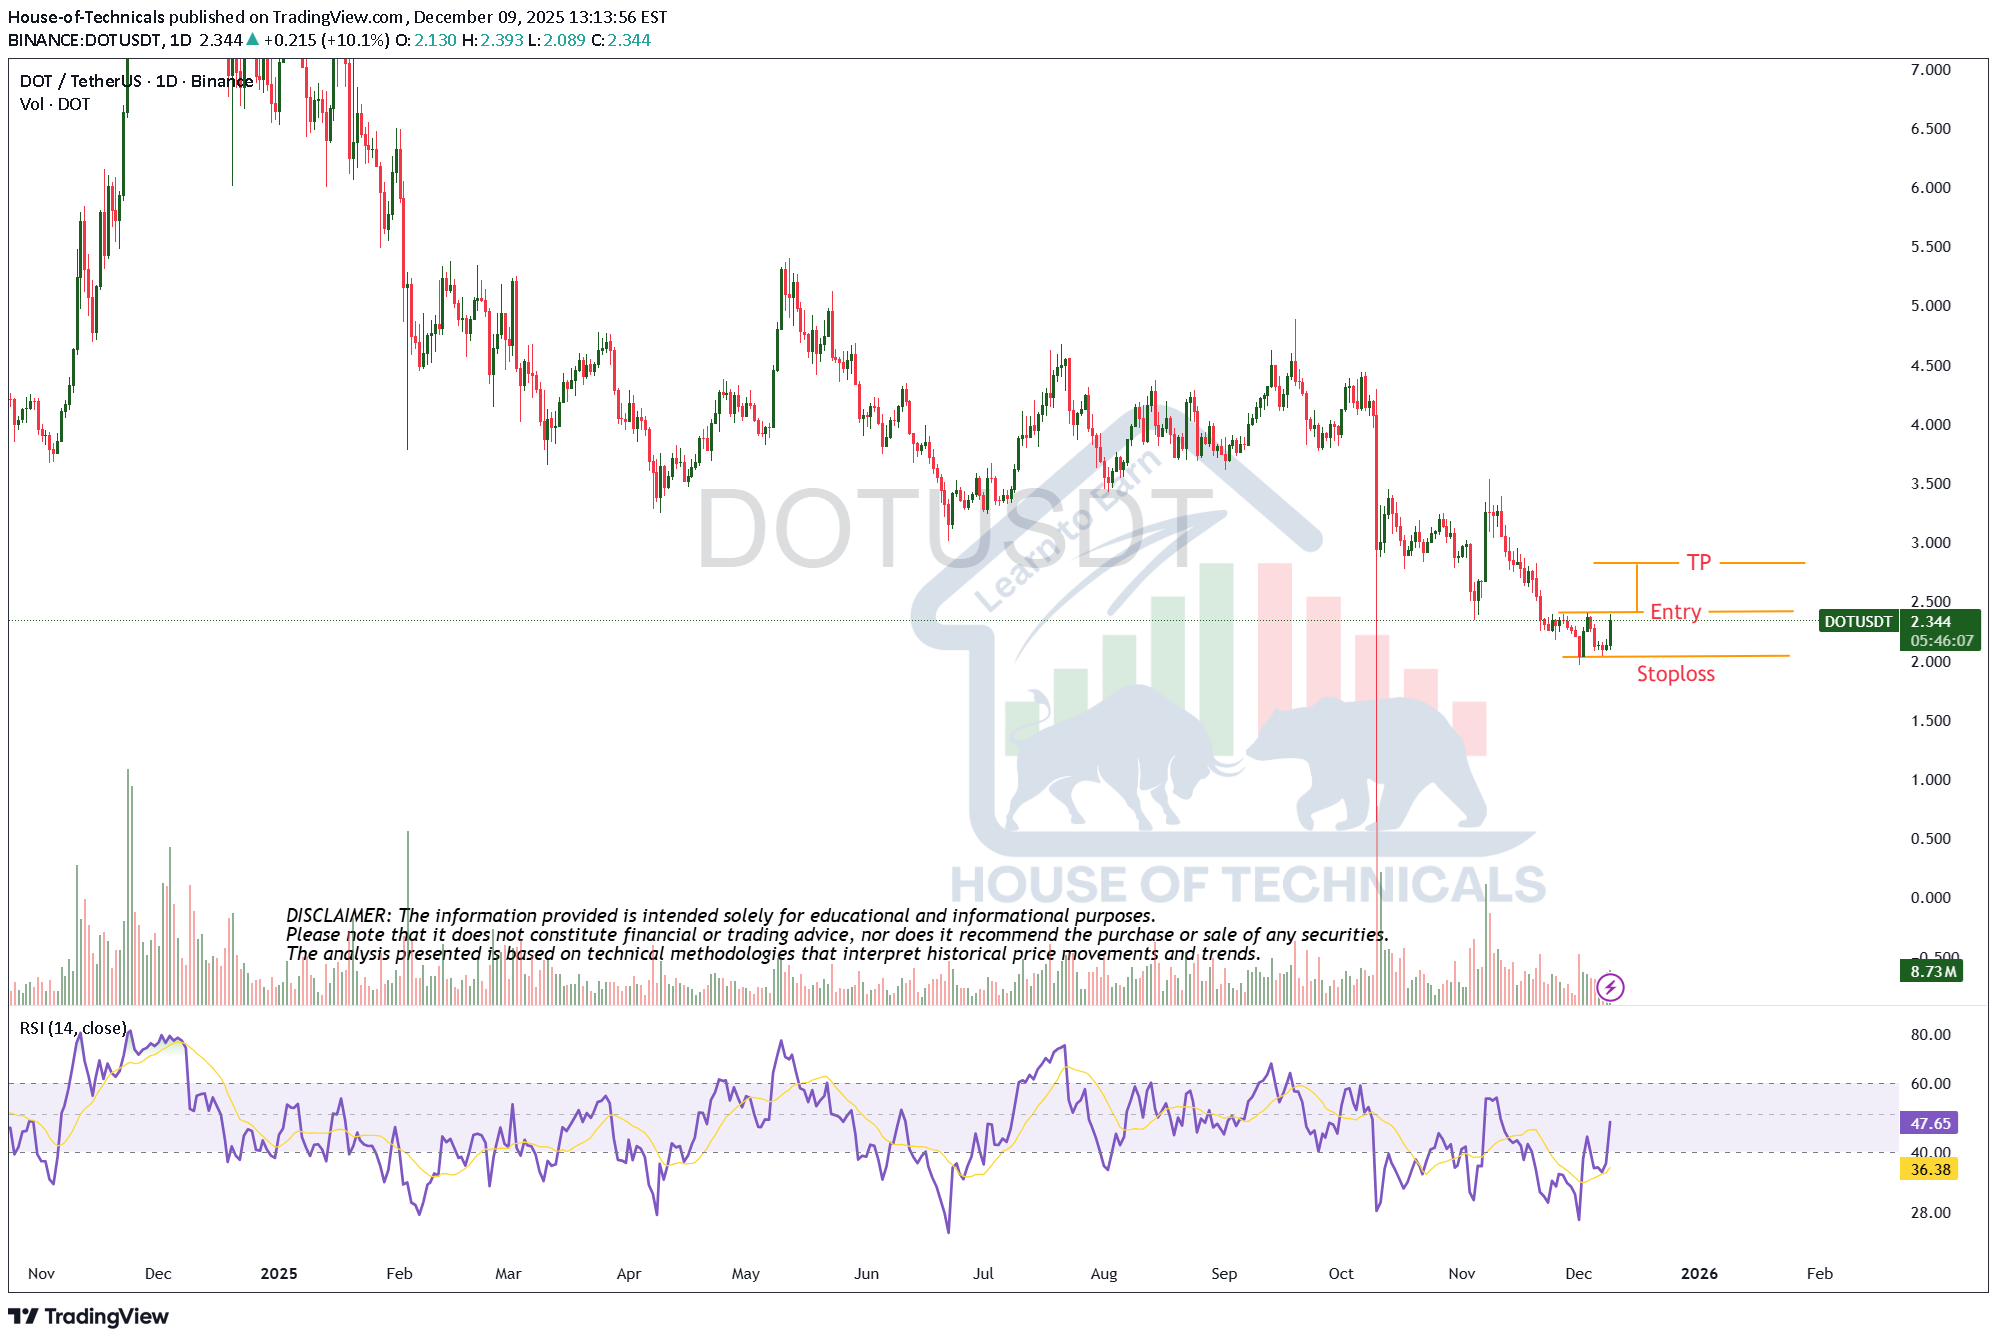
09-12-2025 Çift dip ve yükseliş eğilimi fiyatı yukarıya taşıyabilir.

SwallowAcademy
Polkadot (DOT): Looking For Bullish Movement | Unfilled Zone
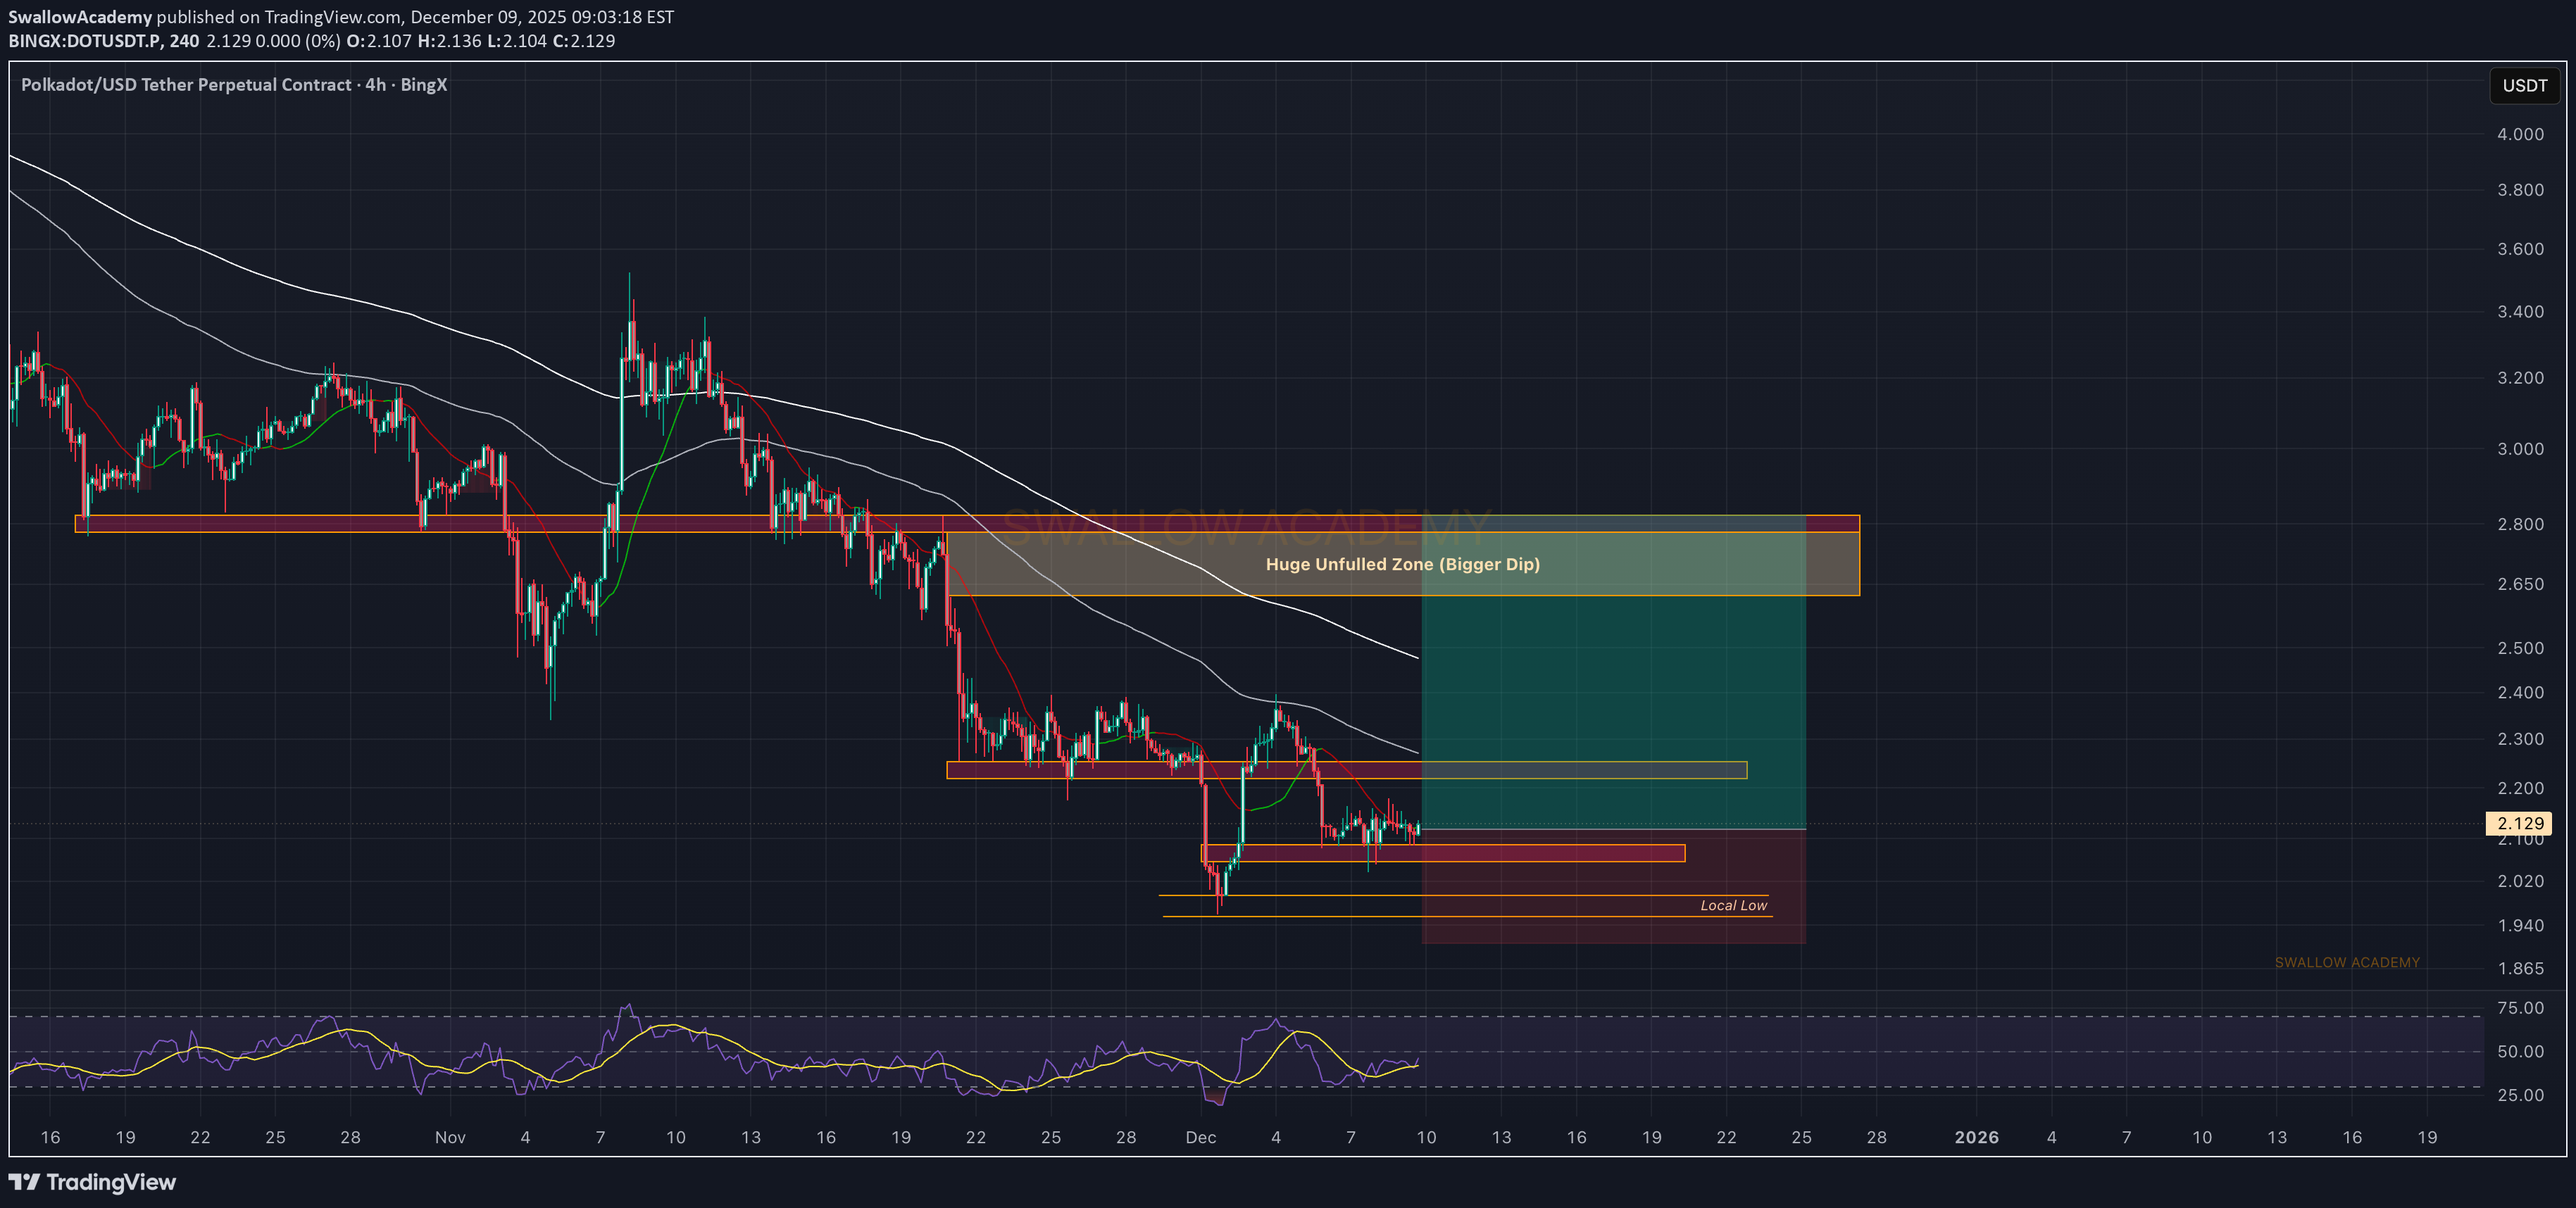
DOT daha küçük destek bölgesini iyi tutuyor ve burası tam olarak form'e doğru ilk yükseliş işaretlerinin başladığı yer. Bu bölgeye giriş hızlı bir şekilde gerçekleşti ve alıcıların oraya tepki vermeye istekli olduklarını gösterdi, bu yüzden bu bölgeden uzun süre mantıklı geliyor. Bundan sonra ihtiyacımız olan şey, yukarıdaki kısa vadeli direncin temiz bir şekilde geri kazanılmasıdır. Bu, move'yi doldurulmamış bölgeye doğru daha yükseğe açan onaydır. Bu çıkışa kadar fikir aynı kalıyor; alıcılar bu destekten ivme kazanmaya çalışıyor ve yapı yavaş yavaş onların lehine değişiyor. Kırlangıç Akademisi

Cryptollica
POLKADOT ($DOT)
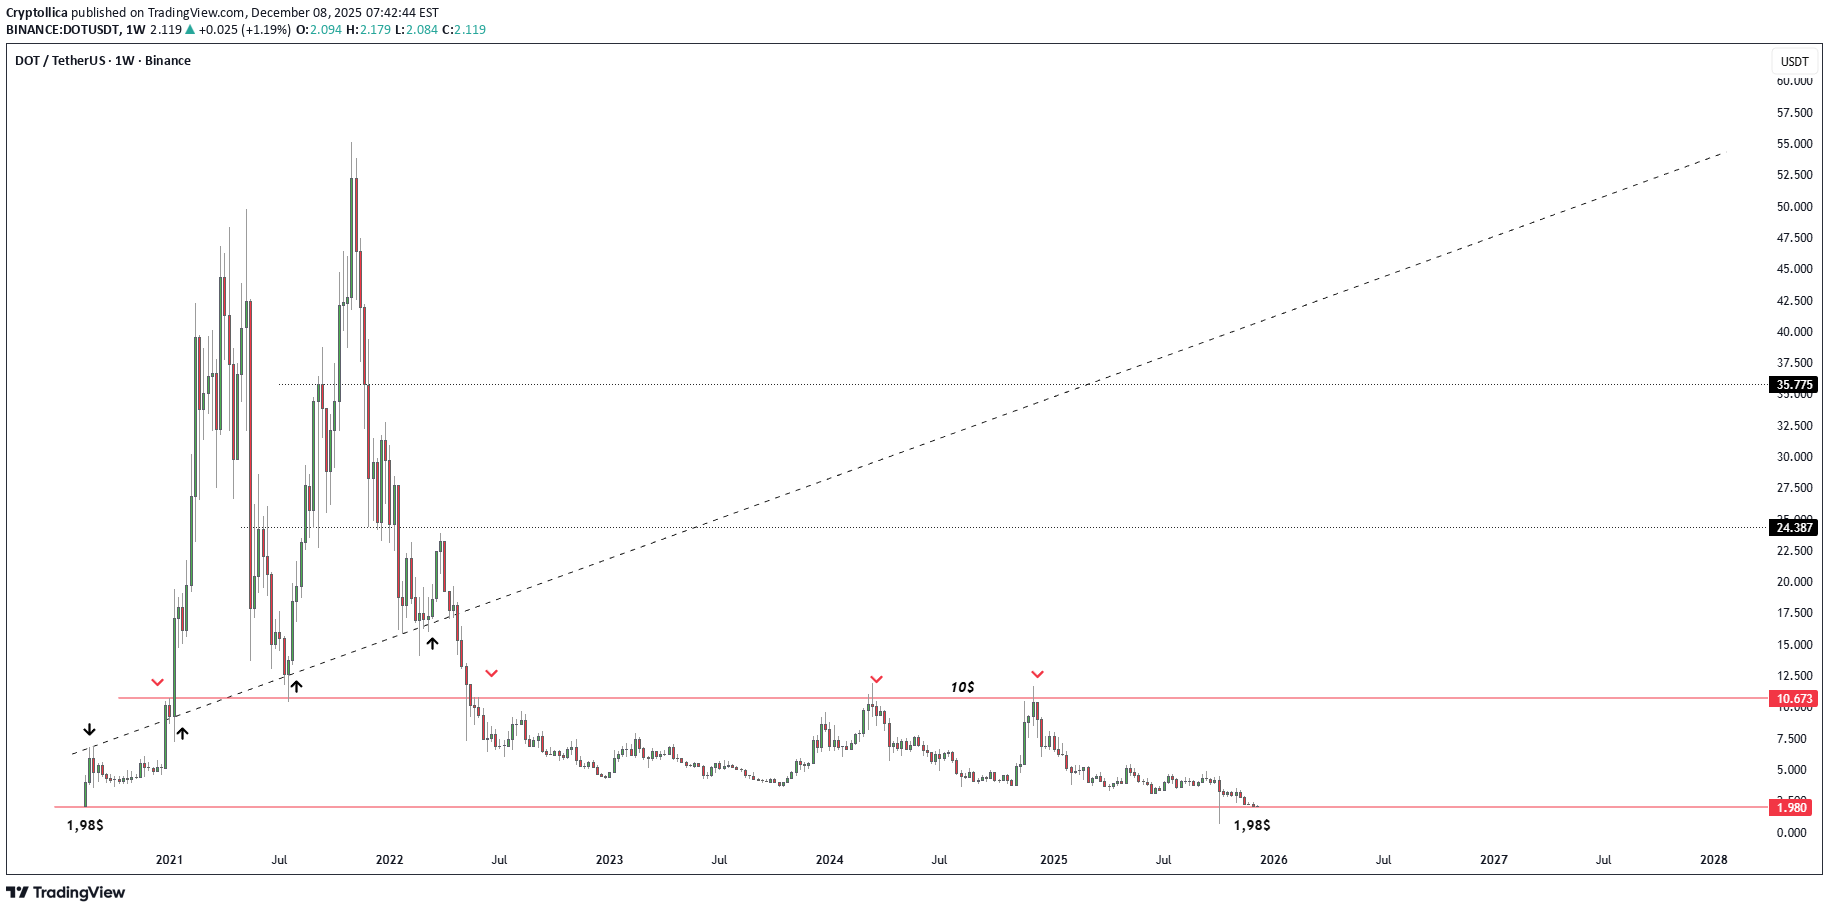
Polkadot (DOT) Haftalık Grafik (1G) Teknik Analiz Polkadot (DOT) haftalık grafiğini incelediğimizde varlığın oldukça kritik ve tarihi bir kavşakta olduğunu görebiliriz. Teknik analist bakış açısıyla bu grafiği piyasa döngüsü, kritik destek/direnç seviyeleri ve trend yapısı açısından detaylandıralım. 1. Genel Piyasa Yapısı ve Döngü Analizi Grafik, klasik bir "Boy ve Çöküş" döngüsünü açıkça göstermektedir. Tam Döngü Sıfırlaması: Fiyat, 2020'nin sonlarında başlayan devasa boğa koşusunun tam başlangıç noktasına (yaklaşık 1,98 dolar) geri döndü. Bu, son 5 yılın fiyat hareketinin etkili bir şekilde silindiği ve piyasanın "sıfır noktasına" döndüğü anlamına geliyor. Trend Görünümü: Ana yapıya şu anda Ayı Piyasası hakimdir. major artan trend çizgisi (kesikli çizgi) 2022'nin başlarında kırıldı ve fiyat o zamandan beri bu trendin altında kalmayı sürdürüyor. 2. Kritik Fiyat Seviyeleri Grafikteki en önemli teknik bölgeler aşağıdaki gibidir: 🟢 Major Destek: 1,98$ - 2,00$ Bölgesi ("Hayat Öpücüğü") Bu bölge DOT için "Yap ya da Boz" seviyesidir. Tarihsel Önem: 2020'deki tarihi rallinin başladığı yer burasıdır. Bu seviyeye geri dönmek, satıcıların tamamen tükendiği (kapitülasyon) bir noktada olabileceğimizi gösteriyor. Teknik Beklenti: Bu seviyeden güçlü bir tepki/sıçrama teknik olarak oldukça muhtemel. Ancak bu seviyenin altındaki haftalık kapanışlar, fiyatı "fiyat keşfine" doğru aşağı yönlü (bilinmeyen bölge) sürükleyecektir. 🔴 Major Direnç: 10,67 Dolar (Red Çizgisi) Grafikte "10$" olarak işaretlenen bu, en kritik direnç bariyeridir. Fiyat 2022, 2023 ve 2024'te bu seviyeyi aşmayı denedi ancak her seferinde reddedildi (red aşağı oklarıyla gösterildiği gibi). Bu seviye kararlı bir şekilde geri kazanılana kadar yeni bir boğa trendinden bahsetmek teknik olarak mümkün değil. ⚠️ Orta Direnç ve Kırık Trend Çizgisi Kırık Yükselen Trend: Kesikli siyah çizgi artık güçlü çapraz direnç görevi görüyor. Her yükseliş girişimi bu çizgiye veya yatay dirence çarpar ve geri çekilir. Ara Hedefler: Potansiyel bir geri dönüşte, 4,50 - 5,00 Dolar band muhtemelen ilk ara direnç olarak act olacaktır. 3. Teknik Formasyon ve Yorumlama Gidiş-Dönüş (Döngü Tamamlama): 55$ seviyelerinden 2$'a düşüş, büyük bir döngünün tamamlandığını gösterir. Genellikle bu kadar büyük düşüşlerin sonunu uzun bir "Yatay Birikim" aşaması takip eder. Üçlü Tepe / Reddetme: 10$ seviyesindeki çoklu retler (2024 civarında görülüyor) prove o bölgede önemli bir arz (satıcı) bloğu var. 4. Yatırımcı Stratejisi ve Senaryoları Bir piyasa analisti olarak bu tabloya dayanarak iki ana senaryo oluşturulabilir: Senaryo A: "Dip Balıkçılığı" (Yükselişin Tersine Dönüşü) Tez: Fiyat tarihi destekte (1,98 dolar). Risk/Ödül (R/R) oranı alıcılar için en cazip noktada. Strateji: 1,98 $ - 2,10 $ aralığında kademeli birikim denenebilir ve zararı durdurma kesin olarak 1,80 $'ın altına yerleştirilir. Hedef: İlk tepki hedefi 4-5$ band. Uzun vadede +10$ sınırı tekrar test edilebilir. Ve Belki eski ATH = 50$
Sorumluluk Reddi
Sahmeto'nun web sitesinde ve resmi iletişim kanallarında yer alan herhangi bir içerik ve materyal, kişisel görüşlerin ve analizlerin bir derlemesidir ve bağlayıcı değildir. Borsa ve kripto para piyasasına alım, satım, giriş veya çıkış için herhangi bir tavsiye oluşturmazlar. Ayrıca, web sitesinde ve kanallarda yer alan tüm haberler ve analizler, yalnızca resmi ve gayri resmi yerli ve yabancı kaynaklardan yeniden yayınlanan bilgilerdir ve söz konusu içeriğin kullanıcılarının materyallerin orijinalliğini ve doğruluğunu takip etmekten ve sağlamaktan sorumlu olduğu açıktır. Bu nedenle, sorumluluk reddedilirken, sermaye piyasası ve kripto para piyasasındaki herhangi bir karar verme, eylem ve olası kar ve zarar sorumluluğunun yatırımcıya ait olduğu beyan edilir.