
BTC
Bitcoin
| تریدر | نوع سیگنال | حد سود/ضرر | زمان انتشار | مشاهده پیام |
|---|---|---|---|---|
خرید | حد سود: تعیین نشده حد ضرر: تعیین نشده | 1 saat önce | ||
فروش | حد سود: تعیین نشده حد ضرر: تعیین نشده | 2 saat önce | ||
خرید | حد سود: تعیین نشده حد ضرر: تعیین نشده | 3 saat önce | ||
خرید | حد سود: تعیین نشده حد ضرر: تعیین نشده | 4 saat önce | ||
فروش | حد سود: تعیین نشده حد ضرر: تعیین نشده | 4 saat önce |


Bitcoin Fiyat Grafiği
سود Üç Ay :
خلاصه سیگنالهای Bitcoin
سیگنالهای Bitcoin
filtre
Mesajı şuna göre sırala
Tüccar Türü
timeframe

Monthly Bitcoin Candle Colour Closes since 2011 - December close

Aralık ayı kapalı RED Eğer bu paylaşımları aylardır takip ediyorsanız 11 aydır süren bir renk dizilimi takip ettiğimizi bileceksiniz. Bu, Bitcoin Tarihinde daha önce HİÇBİR ZAMAN yaşanmamıştı ve 2023 İyileşmenin başlangıcını tekrarlıyor / Boğa Koşusuna yol açıyor. Fakat. Red Aralık kapanışı bu diziyi sonlandırıyor.... Geçen ay da belirtildiği gibi Red mumu en yüksek olasılıktı. Aralık Mumunu tahmin etmeye çalışmak için yalnızca 2 seçenek vardı ve küçük RED mumu daha iyi bir seçenekti. Çünkü bu, PA'nın Ocak 2023'te Bitcoin Ayı piyasasından çıktığında yaşananları tekrarladığına işaret ediyor olabilir. Bu küçük red mum, Aralık 2022'de sahip olduğumuz mumla aynı boyuttadır. 2022 ve 2025'teki önceki Red Kasım mumlarının her ikisi de %-28 civarında aynı büyüklükteydi. Aralık 2022 -%10,6 idi Aralık 2025 -%11,6 Dikkate değer benzerlikler ancak şu ana kadar yalnızca 2 mum dizisi için. Bu Mov'u tekrarlamalı mı? Aralık 2022 ve Ocak 2023 paterninde büyük bir Yeşil Ocak ihtimalini bekleyebiliriz. Soldaki kutuyu tekrarlama şansımız çok ÇOK Zayıf, Çoğunlukla bunu daha önce 11 ay boyunca yaptığımız gibi. ANCAK istatistiksel olarak Ocak ayları Red'den daha sık Yeşil oluyor. Ana grafiği yakınlaştırın Ancak gerçekçi olalım, eğer bir AYI Piyasasındaysak, 2022'de olduğu gibi (soldaki kesikli kutu) RED Ocak ihtimali oldukça yüksektir, Ama..... TEMMUZ 2021'den 2021 Kasım ATH'a ve ardından Ocak 2022'ye kadar Kesikli Kutuya bakarsak, 2 x Yeşil, Kırmızı, Yeşil, 3 X Red dizimiz var (son Red mum OCAK 2022'ydi) Aynısını Haziran 2025'ten bir ay önce yaptık, yani en son 3. Red mumumuz Aralık 2025'tir (sağdaki kesikli kutu). 2022'de 3. red'dan sonraki mum Yeşildi... bu da bizim için yine Yeşil Ocak'a işaret ediyor. Eğer modeli takip edersek ve bunun hatırlanması gerekiyorsa, bu fiyat hareketinin Derin Ayı'da henüz gelmemiş olan kısa bir duraklama olduğunu söyleyebiliriz. Red Ocak geçirme ve böylece arka arkaya 4 Red mum yapma şansımız da zayıf. ama imkansız değil. Daha önce yalnızca 4 Red Mum (veya daha fazla) gruplandırmamız vardı:- (Grafikte okla işaretlenmiştir) Ağustos - Kasım 2011, (önceki PA bilinmiyor) Temmuz - Ekim 2014 Ağustos 2018 - Ocak 2019 (6 ay) Bunlar Ayı Piyasasındaydı. Ancak 2019'da bunu 5 aylık Green takip etti. Önceki OCAK kapanışları 8 Yeşil ile 6 arası Red Bu Yeşil Kapanışların 4'ü 2 veya Daha Fazla Red ay öncesinde gerçekleşti. Red Kapanışların 2'si, 2 veya daha fazla Red Ay öncesinde gerçekleşti. Bu aynı zamanda Yeşil Ocak ihtimalinin daha yüksek olduğuna işaret ediyor. Yeşil Ocak kapanışlarından 7 tanesi yıl içinde Ocak kapanış mum fiyatından daha yüksek bir fiyata sahip. 5'i Yeşil Şubat izledi Red Ocak kapanışlarının tamamından sonra küçük yeşil bir Şubat ayı geliyor HERKESE MUTLU YILLAR
A quick look at Bitcoin. It loves the big dates. Happy New Year!

Dürüst olmak gerekirse, dünkü Çarşamba seansında, Avustralya'da New York saatiyle 2026 yılı olan DXY firmasına ilişkin altın fiyatını izliyordum. Bitcoin, RSi'de birkaç kez temel 50 RSI seviyesinin altına daldı ve geri döndü. BTCUSD, Başkan Trump'ın 2. seçim zaferindeki yükselişinden 6 ay sonra benzer bir seviyedeydi. Eğer gerçekleşirse 200 ema'dan bir sıçramaya dikkat edin. Bir sır paylaşacağım, her şeyin başladığı ikinci zaman dilimlerinde Bitcoin ile bu kırılmalardan birkaçını yakından takas ettim ve şunu söyleyebilirim ki fiyat her zaman bir sonraki yukarıyı arıyor move ve Bitcoin aşırı alımda değil. Dar aralık 'altın çocuğu' bir sonraki hamlesine fırlatmak üzere, aksini söylemek doğru olmayacağından bu yönü kendime saklayacağım. İşlem gününün tadını çıkarın. Mutlu 2026, Chris MüzikalGece
BTC CRUSHED BOTH SIDES CAPTURED

BTC İKİ TARAFI YAKALANDI 🚀 En iyi düzeyde hassasiyet. LiveFinTech Göstergesi Bitcoin'de iki büyük hamle yakaladı! ✅ Akıllı Satın Alma: TP2 HIT! (pump ile 88.939$'a yakalandı) ✅ Akıllı Satış: TP2 HIT! (87.126 dolara düşüş yakalandı) Trend Kontrol Paneli her bir zaman diliminde (1 dakikadan 1 güne kadar) RED döndüğünde, pazarın tam olarak hangi yönde hareket ettiğini bilirsiniz. 🎯🔥 Trendin tersine işlem yapmayın. Topluluğumuza katılın ve net bir şekilde ticaret yapın! WhatsApp Grubu: chat.whatsapp.com/LQOJmAL7mZFCRqnHn7kQ5X Instagram'da: instagram.com/livefintechalgo Facebook: facebook.com/livefintechalgo #Bitcoin #BTCUSD #CryptoTrading #LiveFinTech #TradingSignals #TradingView #TPHit #CryptoSignals #Subscribe

Happy New Year with BITCOIN making this for the first time!
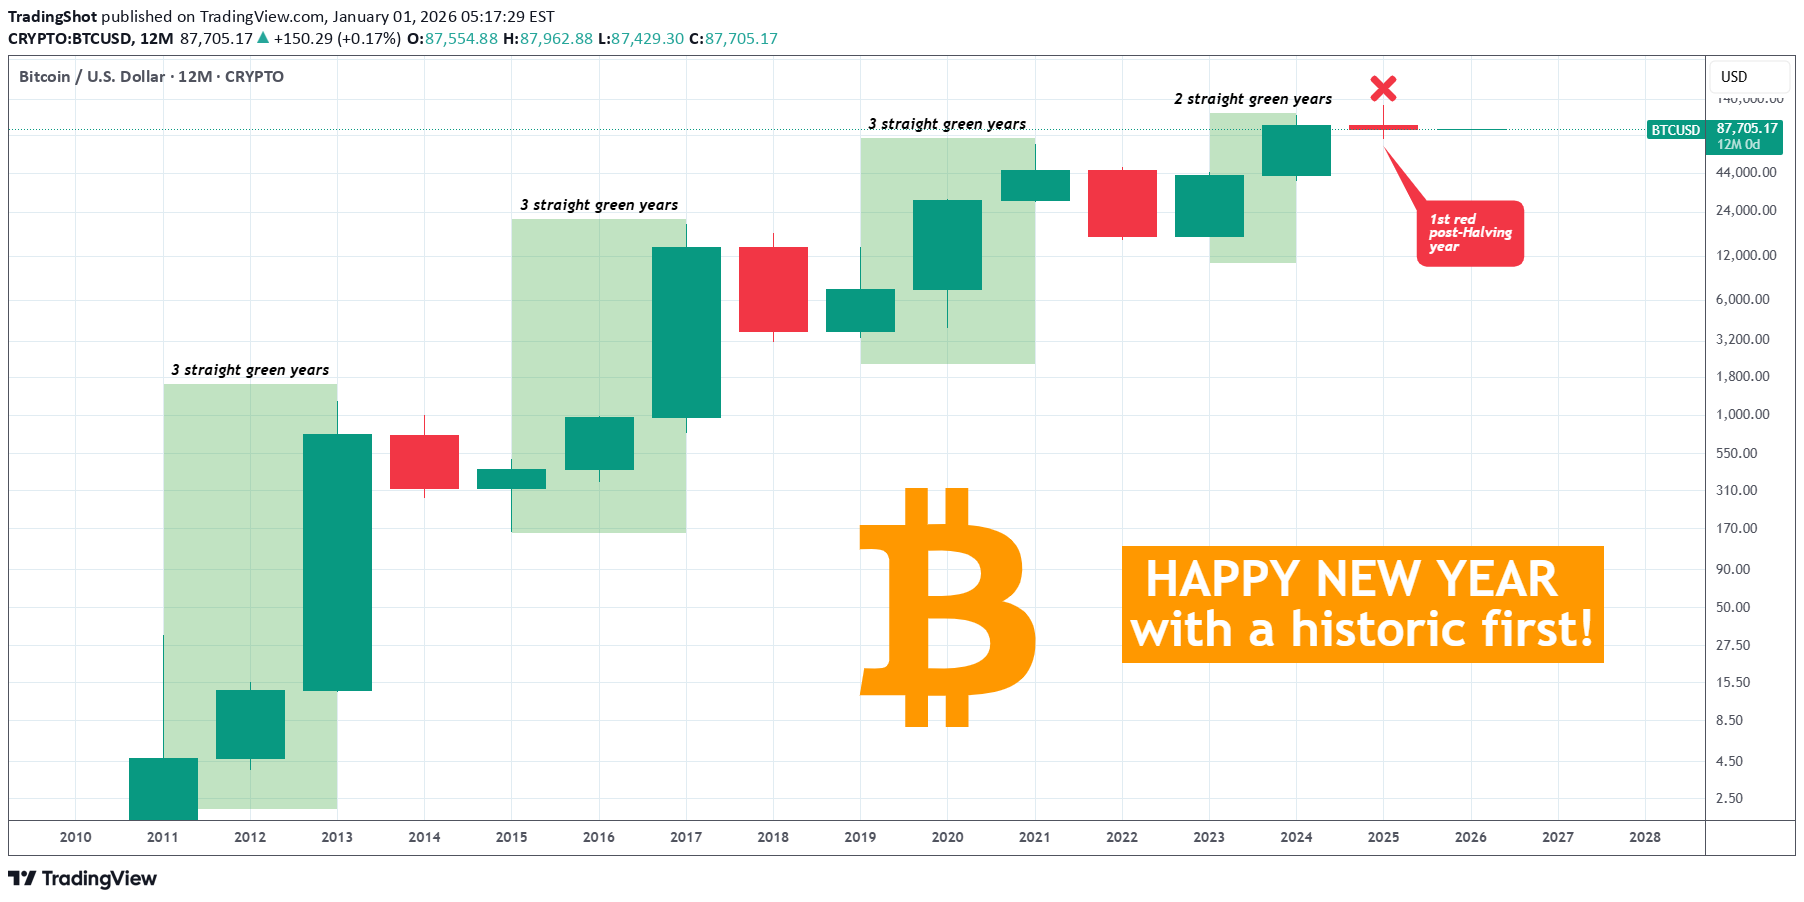
Yeni yılınız kutlu olsun, size ve sevdiklerinize en iyi dileklerimizle! Bitcoin (BTCUSD) yılı, tarihsel olarak daha önce hiç yapmadığı bir başarıyla kapattı. Ve bu, Boğa Döngüsü içindeki red (kayıp) yılı kapatıyor. Şu ana kadar geleneksel teknik model, bir Ayı Döngüsünden sonra BTC'nin art arda en az 3 yeşil yıl yayınlaması şeklindeydi. Halving sonrası son yıl her zaman yeşildi (kazançlar). Bu, 2023 ve 2024'teki iki yükselişin ardından red yıllık (12 aylık) mumla düne kadar devam etti. Bu, geleneksel 4 yıllık Döngü Teorisinin sonu olabilir mi? Henüz buna pek inanmıyoruz. Piyasa 4. yılda yeni bir Tüm Zamanların En Yüksek Seviyesini (veya en azından piyasa olgunluğunu ve kitlesel benimsenmeyi takip edecek on yıllardaki Yüksek Döngüyü) belirlediği sürece, 4 Yıllık Döngü Teorisi baskın kalıp olarak kalmalıdır. Yine de bu Bitcoin için tarihi bir ilkti ve geleceğin bizi neler getireceği konusunda bundan daha heyecanlı olamazdık! Tekrardan herkese mutlu yıllar! Peki 2025 yılının zararla kapanması sizi endişelendiriyor mu? Aşağıdaki yorumlar bölümünde bize bildirmekten çekinmeyin! --- ** Bu fikri beğendiyseniz lütfen BEĞENİN 👍, TAKİP EDİN ✅, PAYLAŞIN 🙌 ve YORUM YAPIN ✍! Ayrıca fikirlerinizi ve grafiklerinizi aşağıdaki yorumlar bölümünde paylaşın! Bu, fikri güncel tutmanın, bizi desteklemenin, buradaki içeriği ücretsiz tutmanın ve fikrin mümkün olduğunca çok insana ulaşmasını sağlamanın en iyi yoludur. ** --- 💸💸💸💸💸💸 👇 👇 👇 👇 👇 👇
Bitcoin Daily Analysis #22 — Daily BTC Market Update

Herkese merhaba, Öncelikle bu yılın finansal özgürlüğünüzü inşa ettiğiniz yıl olmasını diliyorum. Analizime hoş geldiniz. Yeni yıla başlamak için daha yüksek zaman aralıklarından aşağıya doğru move yapmak istiyorum, böylece her gün pazarda birlikte yürüyebiliriz. “Burada artık günlük ya da 4 saatlik mumlarla uğraşmıyoruz; her mum piyasanın ömrünün yarım yılını temsil ediyor.” Herhangi bir hüküm vermeden önce, Zihniyetimizi zaman çerçevesiyle uyumlu hale getirmeliyiz. Birincisi: 6M mum aslında ne anlama geliyor? Her mum = 6 aylık piyasa davranışı 2 mum ≈ 1 yıl 3 mum ≈ 1,5 yıl 4 mum ≈ 2 yıl 📌 Yani burada “mum saymak” şu anlama geliyor: Piyasanın her yükseliş veya düzeltme döngüsünde ne kadar zaman harcadığını anlamak, ve bu mumların verdiği mesaj neydi? Burada gürültü yok. Her mum piyasa tarihindeki bir bölüm gibidir. 6A Zaman Dilimi Üzerinde Mumların Dili Bu zaman diliminde: Büyük yeşil gövdeler → gerçek satın alma baskısı, büyüme aşaması (Markup) Büyük red gövdeler → gerçek satış baskısı, düşüş aşaması (Markdown) Yükseklere yakın uzun üst fitiller → arz, kar alma, tükenme Düşüşlerden sonra uzun alt fitiller → satışın emilmesi, talebin devreye girmesi Tepeye yakın birden fazla küçük mum → dağıtım veya dinlenme Bir trendden sonra güçlü bir karşıt mum → faz değişikliği uyarısı 📌 6M'de hiçbir şey rastgele değildir. Şimdi döngüleri tek tek inceleyelim Aşama A — major döngünün başlangıcı (2011–2013) 2 mum ≈ 1 yıl Burada piyasa güçlü yeşil mumlarla yukarı doğru patlıyor. 📌 Piyasa bilinmeyen, düşük değerli bir aşamadan geçiyor heyecana kapılıyor. Daha yüksek zaman dilimlerinde: Büyük bedenler Sığ geri çekilmeler → Kontrol açıkça alıcıların elindedir. Aşama B - İlk ciddi ayı piyasası (2013–2015) 3 mum ≈ 1,5 yıl Sert yükselişin ardından piyasa zaman satın alıyor. Mumlar: Çoğunlukla red Bazen daha düşük fitillerle (satış emilimi) 📌 Öfori boşaltılmalıdır. Piyasalar zaman olmadan tekrar büyümezler. Aşama C — Temiz bir yükseliş döngüsü (2015–2017) 4 mum ≈ 2 yıl En net büyüme aşamalarından biri: Üst üste birden fazla yeşil mum Red mumlar kısa ve zayıf 📌 Gerçek bir boğa trendi. Satıcılar yalnızca işleri yavaşlatır; fiyatı kontrol etmezler. Aşama D — 2017 zirvesinin ardından ayı piyasası 3 mum ≈ 1,5 yıl Düşüş mumları artı başarısız ribaundlar. 📌Bu aşamanın sonuna doğru: Red vücutlar küçülür Alt fitiller görünüyor → Satış baskısı azalıyor. Aşama E — 2020–2021 döngüsü 3 mum ≈ 1,5 yıl Pazar hâlâ büyüyor ancak: Düzeltmeler daha net Tedarik daha ağır 📌 Pazar artık daha büyük. Büyüme hala güçlü ancak artık basit değil. Aşama F — 2022 çöküşü 1 mum ≈ 6 ay Bu çok önemli. Bir red 6 aylık mum şu anlama gelir: 👉Hızlı, ağır, tek parça satış. 📌Şok/temizleme/teslimiyet benzeri davranışlar. Bir sonraki mum düşüşe devam edemezse, genellikle bir temel oluşturma aşaması başlar. Faz G — ~126K'ya yeni yükseliş dalgası 4 mum ≈ 2 yıl Bir kez daha tanıdık ritim: Major büyüme ≈ 4 mum Major düzeltme ≈ 3 mum 📌 Tepeye yakın: Mumlar küçülüyor Üst fitiller artar → Tükenme / dağıtım. Mevcut Durum (2026'ya Yakın) Fiyatı 87.7K civarında 126.272 civarında yüksek kaydedildi Üstten sonra: Nispeten küçük, kararsız bir mum görüyoruz Ağır bir kaza değil Yukarı doğru kararlı bir devam değil 📌 Piyasa bir karar aşamasındadır — ne açıkça yükselişe ne de açıkça düşüşe işaret ediyor. En Büyük Hata Bu tabloyu yargılamaya çalışıyorum daha düşük zaman dilimi zihniyetiyle (4H / 1D). 📌 6M zaman diliminde şöyle düşünmelisiniz: Acele etme Onay için bir sonraki mumu bekleyin Tepeden sonraki küçük bir red mum yüzünden ayı piyasasına çağrılmayın Burada piyasa zamanla konuşur, duygu yoluyla değil. ⚠️ Risk Uyarısı ⚠️ Vadeli işlemler yeni başlayanlar için uygun değildir. Bu tetikleyiciler sağlam bir deneyim gerektirir. Bunları kullanmadan önce risk yönetimini inceleyin ve buradaki öğrenme içeriğiyle pratik yapın.
Bitcoin's : Wave IV Grind Before the Last Parabolic Ride

Bitcoin'in uzun vadeli grafiği, döngüler içindeki döngülerin tanıdık bir story'ını anlatıyor. 2018-2022 ayı piyasasının en düşük seviyelerinden gelen süper-döngü ilerlemesi, V dalgası bölgesinde kalmayı sürdürüyor ve son dönemdeki 126.000 $+'a yükseliş, V'nin klasik genişletilmiş dalgasını (3) veya (5) işaret ediyor. Şu anki geri çekilme (keskin ama örtüşen) IV. dalganın (veya V'nin alt dalgasının (4)) tüm işaretlerini taşıyor: sığ geri çekilme, dalgalı hareket ve henüz ani bir olumsuzluk yok. Bu düzeltmenin tamamlanmadığına dair güçlü bir ihtimal var; alıcılar kontrolü tekrar ele geçirmeden önce düz veya üçgeni tamamlamak için bir adım daha aşağı inmek mümkün. Yükseklerde tükenme açıkça görülür, ancak sonlanma değildir. Yapı hala V. dalgada son bir parabolik hamleye doğru eğiliyor, IV. dalga tamamlandığında potansiyel olarak 150.000 ila 200.000 $'ın üzerinde bir seviyeye doğru. 4. Dalga, herkesi kandırmakla ünlüdür: ayılar zirvenin içeride olduğuna inanır, boğalar her düşüşü "dip" olarak adlandırır. Sonra 5. dalga gelir; vahşi, duygusal ve sabırsızlar için cezalandırıcı. Sabır burada son noktadır. Grafik bozuk değil; sadece finale hazırlanıyor.
BTCUSD

BTCUSD – Olumlu Görünüm (Eğitimsel Perspektif) Paylaştığınız 30 dakikalık grafiğe göre: 📈 Yapı ve Önyargı Fiyat, keskin bir satış dalgasının ardından yerel talep bölgesinden (~87.450-87.500) tepki verdi. Kısa vadeli yapı daha düşük diplerden daha yüksek diplere doğru kayıyor ve bu durum rahatlama/düzeltici bir yukarı yönlü hareketin sinyalini veriyor. Vurgulanan yeşil kutu, yükseliş eğilimi gösteren bir RR kurulumuna işaret ediyor (talep devam ederken uzun eğilim). 🎯 Olumlu Hedefler (Bölgeler, kesin fiyatlar değil) Anında direnç: ~87.950 – 88.100 İlk reaksiyon alanı (küçük tedarik / ön konsolidasyon). Orta hedef: ~88.350 – 88.550 Gerçeğe uygun değer / dengesizlik doldurma + önceki yapı. Genişletilmiş hedef: ~88.800 – 89.000 Güçlü tedarik bölgesi; muhtemelen kar rezervasyonu alanı. 🛑 Geçersiz Kılma / Risk ~87.400–87.350'nin altında (temiz kırılma ve kapanış) → yükseliş fikri zayıflıyor; aşağı yönlü devam riski 87.000 / 86.700'e doğru artıyor. Onay İçin Nelere Dikkat Edilmeli? 30 dakikalık yükseliş ~87.700-87.800 üzerinde Küçük geri çekilme + devam (yüksek düşük) Yeşil mumlarda hacim artışı
BTC Looks Heavy...

Yeni Yılınız Kutlu Olsun Millet! Umarım iyi vakit geçirirsin... o yüzden, BTC... bana ağır geliyor. Salınım yapısını takiben 94K alanına geri dönüş yapılamadığını gösteriyor. İlk başta daha fazla ilerleyemedi ve deep geri çekilme gösterdi. Şimdi 90K'nın altında yatay duruyor. Günlük grafikte yukarı yönlü MACD yönü, aşağı yönlü bir dinamik baskıyı hatırlatmaya başlıyor ve aşağı yönlü bir kırılmayı işaret ediyor. Ayrıca, haftalık grafikte Konsolidasyon, aynı zamanda düşüş yönlü olan flama şeklini alıyor. BTC bir şekilde 91-92K alanının üzerine çıkarsa durum değişebilir. Bu durumda düşüş yönlü baskı paterni iptal edilecektir. Ancak şu anda 80 bin dip seviyesinin yeniden test edilmesi şansı daha iyi görünüyor. Şu ana kadar yeni bir uzun pozisyon düşünmüyoruz.

احتمال ریزش بیت کوین به زیر ۸۶ هزار دلار؟ (تحلیل مهم BTC/USDT)

Bitcoin Super Aralık Şöyle de düşünülebilir: Mavi trend çizgisi kırılırsa 85-86 bin dolar civarına kadar düzeltme yapılabilir 🔽💸💸 90.600'e doğru uzun pozisyonun aktif hale gelmesi için 89'un kırılması gerekiyor 📈📈
نبرد حیاتی بیت کوین: آیا حمایت اصلی میشکند یا خیز صعودی آغاز میشود؟

Direnç Bölgesi (Major Arzı) 90.130 – 90.170 Güçlü reddetme alanı (birden fazla red oku). Satıcılar sürekli olarak buraya giriyor. Yükseliş kırılması meydana gelirse ana yukarı hedef görevi görür. 🟢 Destek Bölgesi (Anahtar Talep) 86.850 – 86.870 Destek Noktası olarak etiketlendi. Fiyat bu bölgeden defalarca olumlu tepki verdi. Mevcut fiyat bu destek → karar alanının hemen üzerinde seyrediyor. 📉 Kısa Vadeli Yapı Son zamanların en yüksek seviyelerinden alçalan bir trend çizgisi oluştu. Fiyat trend çizgisinden koptu ve desteğe doğru ilerledi. Bu, alıcılar kontrolü yeniden ele geçirmediği sürece zayıf yükseliş momentumuna işaret ediyor. 🔄 Olası Senaryolar Boğa Senaryosu 86.850 üzerinde güçlü tutunma 87.800'ün üzerinde kırılma ve kapanış Yukarı hedefler: 88.800 90,130 – 90,170 (yüksek aralık) Ayı Senaryosu 86.850'nin altında temiz arıza Destek başarısızlığı daha fazla olumsuz gidişata yol açabilir Desteğin kaybedilmesi durumunda volatilitenin artması bekleniyor 🧠 Ticaret Bilgisi En iyi strateji: Menzil ticareti Onay ile yakın desteğe satın alın Direncin yakınında sat veya kar al Aralığın ortasındaki fiyatı kovalamaktan kaçının. Trend işlemleri için kırılma onayını bekleyin. BTCUSD BTCUSDF2026 BTCUSD BTCUSD BTCUSD BTCUSD BTCUSD BTCUSD BTCUSD BTCUSD
Sorumluluk Reddi
Sahmeto'nun web sitesinde ve resmi iletişim kanallarında yer alan herhangi bir içerik ve materyal, kişisel görüşlerin ve analizlerin bir derlemesidir ve bağlayıcı değildir. Borsa ve kripto para piyasasına alım, satım, giriş veya çıkış için herhangi bir tavsiye oluşturmazlar. Ayrıca, web sitesinde ve kanallarda yer alan tüm haberler ve analizler, yalnızca resmi ve gayri resmi yerli ve yabancı kaynaklardan yeniden yayınlanan bilgilerdir ve söz konusu içeriğin kullanıcılarının materyallerin orijinalliğini ve doğruluğunu takip etmekten ve sağlamaktan sorumlu olduğu açıktır. Bu nedenle, sorumluluk reddedilirken, sermaye piyasası ve kripto para piyasasındaki herhangi bir karar verme, eylem ve olası kar ve zarar sorumluluğunun yatırımcıya ait olduğu beyan edilir.