
sunya
@t_sunya

تریدر چه نمادی را توصیه به خرید کرده؟
سابقه خرید
تخمین بازدهی ماه به ماه تریدر
پیام های تریدر
فیلتر
نوع پیام
sunya
تحلیل تکنیکال فوقحرفهای S&P 500: نقشه راه هفته | فرصتهای میلیون دلاری!
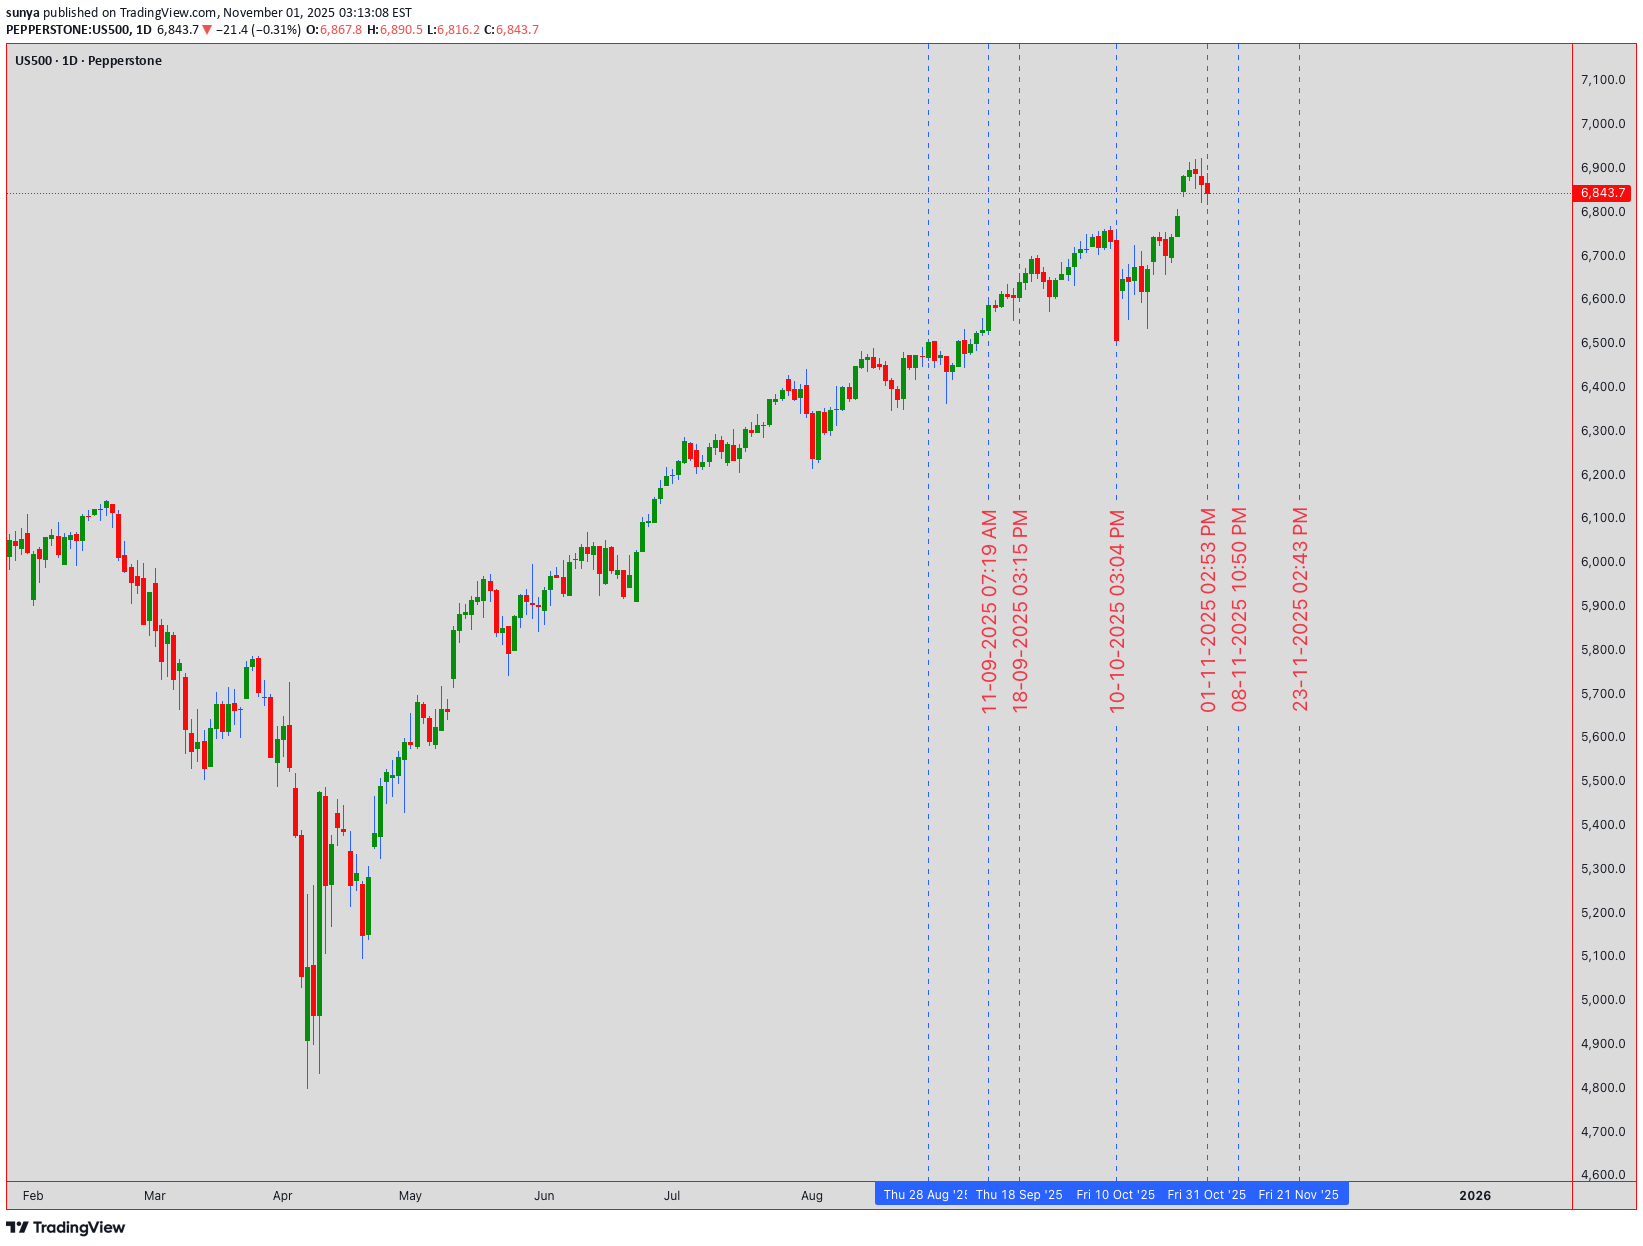
🔥 US500 S&P 500 INDEX | Institutional Technical Analysis Masterpiece | 6,843.7 🔥 📈 ELITE MULTI-TIMEFRAME BREAKDOWN | NOVEMBER 3-7, 2025 TRADING ROADMAP 📈 Current Level: 6,843.7 | Analysis Date: November 1, 2025, 00:54 UTC+4 Hello, TradingView community! 👋 The S&P 500 has been on an absolute tear, closing the week at a staggering 6,843.7 . The big question on everyone's mind is: Are we witnessing a final euphoric push before a correction, or is this simply a pause before the next leg up? This week, from November 3rd to 7th, will be critical. Let's break down the multi-timeframe picture, blending classic theories with modern indicators to build a comprehensive trading plan for both intraday and swing traders. 🧠 ═══════════════════════════════════════════════════════════════════ 🎯 MARKET INTELLIGENCE EXECUTIVE SUMMARY The S&P 500 stands at 6,843.7 , navigating a historic technical confluence zone that will determine the market's trajectory through year-end 2025. Our algorithmic and classical analysis fusion reveals bullish continuation potential with measured risk parameters. This week presents asymmetric opportunities as institutional positioning, technical patterns, and macro catalysts align for potentially explosive moves. Critical Support Infrastructure: 🛡️ Immediate Floor: 6,820 - 6,830 (Algorithmic bid zone) Secondary Base: 6,800 - 6,810 (Institutional accumulation) Major Support: 6,750 - 6,770 (Weekly pivot nexus) Ultimate Defense: 6,700 - 6,720 (Psychological fortress) Resistance & Target Architecture: 🎯 First Ceiling: 6,860 - 6,870 (Intraday supply) Secondary Wall: 6,900 - 6,910 (Round number magnet) Breakout Zone: 6,950 - 6,970 (Pattern objective) Major Extension: 7,000 - 7,020 (Psychological milestone) ═══════════════════════════════════════════════════════════════════ 📊 WEEKLY TIMEFRAME (1W) - MACRO MARKET STRUCTURE Elliott Wave Grand Architecture: 🌊 We're positioned in Minor Wave 3 of Intermediate Wave (5) within the secular bull market. The impulsive structure projects targets at 7,100-7,200 based on Fibonacci extensions. Critical validation: maintaining above 6,720 preserves the bullish count. Primary Count: Wave 3 of (5) targeting 7,100 Alternative: Wave B of expanded flat, risk below 6,650 Invalidation: Weekly close below 6,600 Time projection: Completion by late November Wyckoff Accumulation Schematic: 📚 Phase D - Markup Beginning - Preliminary Supply (PSY): 6,920 tested - Buying Climax (BC): 6,950 rejection - Automatic Reaction (AR): 6,750 hold - Last Point of Support (LPS): Current 6,843 - Sign of Strength (SOS): Pending above 6,870 Ichimoku Cloud Mastery: ☁️ Pine Script® Tenkan-sen: 6,815 (9-period support) Kijun-sen: 6,780 (26-period base) Senkou A: 6,850 (cloud top resistance) Senkou B: 6,720 (cloud bottom support) Chikou Span: Clear above price (bullish) Cloud status: Thick and ascending Expand 1 line Advanced Harmonic Patterns: 🦋 Developing Bullish Gartley with precision ratios: - XA leg: 6,500 to 6,950 (450 points) - AB retracement: 0.618 at 6,672 ✅ - BC extension: Testing 0.786 at 6,845 (current) - D completion: 0.786 XA at 6,850-6,870 - Target upon completion: 7,050-7,100 ═══════════════════════════════════════════════════════════════════ 📉 DAILY TIMEFRAME (1D) - SWING TRADING COMMAND CENTER Japanese Candlestick Mastery: 🕯️ Yesterday's Doji Star at resistance signals equilibrium. Today's action critical: - Close above 6,860 = Three White Soldiers continuation - Close below 6,820 = Evening Star reversal warning - Current bias: Neutral-bullish pending confirmation Master Pattern Recognition: Cup and Handle formation nearing completion: - Cup low: 6,650 (October) - Cup high: 6,920 (Recent peak) - Handle forming: 6,820-6,870 range - Breakout target: 7,190 (270-point measured move) - Volume requirement: 25% above 20-day average Bollinger Bands Configuration: 📊 Upper Band: 6,875 (immediate resistance) Middle Band (20-SMA): 6,810 (dynamic support) Lower Band: 6,745 (oversold boundary) Band Width: Expanding (volatility increasing) %B Indicator: 0.68 (upper half, bullish bias) RSI Multi-Timeframe Analysis: Daily RSI: 59 (room for upside) Hidden bullish divergence vs price action Support trend line from September intact Resistance at 70 provides 11-point runway ═══════════════════════════════════════════════════════════════════ ⚡ 4-HOUR TIMEFRAME (4H) - TACTICAL EXECUTION FRAMEWORK Gann Theory Application: 📐 Pine Script® Current Gann Angles: 1x1: 6,825 (45-degree support) 2x1: 6,850 (current resistance) 1x2: 6,790 (major support) Square of 9: 6,889 (next target) Gann Box: 6,750-6,950 range Time cycles: Nov 5 critical date Expand 2 lines Dow Theory Confirmation Checklist: ✅ Primary Trend: Bullish (new highs achieved) Secondary Trend: Consolidation/Correction Volume Confirmation: Accumulation on dips Breadth Analysis: 65% stocks above 50-DMA Sector Rotation: Technology leading (bullish) Transportation Confirmation: Pending Moving Average Symphony: - EMA 8: 6,838 (ultra-short support) - EMA 21: 6,825 (short-term support) - EMA 50: 6,810 (medium support) - SMA 100: 6,785 (strong support) - SMA 200: 6,750 (major trend support) Pattern Alert: 🚨 Ascending Triangle resolution imminent: - Horizontal resistance: 6,860-6,870 - Rising support: 6,820-6,830 - Apex convergence: November 4 - Breakout projection: 6,950+ ═══════════════════════════════════════════════════════════════════ 🎪 1-HOUR TIMEFRAME (1H) - PRECISION TRADING LABORATORY Micro Pattern Development: 🔬 Double Bottom forming at 6,825: - First bottom: 6,823 (10:00 UTC) - Second bottom: 6,826 (14:00 UTC) - Neckline resistance: 6,855 - Pattern target: 6,885 (30-point move) VWAP Trading Matrix: Daily VWAP: 6,841 Weekly VWAP: 6,825 Monthly VWAP: 6,795 Upper Band 1: 6,858 (first resistance) Upper Band 2: 6,875 (second resistance) Lower Band 1: 6,824 (first support) Lower Band 2: 6,807 (second support) Support & Resistance Precision Grid: Pine Script® R4: 6,890 (Major resistance) R3: 6,875 (Daily upper BB) R2: 6,860 (Pattern neckline) R1: 6,850 (Immediate resistance) PIVOT: 6,843.7 (Current Price) S1: 6,835 (Micro support) S2: 6,825 (VWAP support) S3: 6,810 (Major support) S4: 6,795 (Monthly VWAP) Expand 4 lines ═══════════════════════════════════════════════════════════════════ ⚡ 30-MINUTE TIMEFRAME (30M) - SCALPING COMMAND POST Microstructure Analysis: 🎯 Bull Flag pattern developing: - Pole: 6,810 to 6,855 (45 points) - Flag consolidation: 6,835-6,845 - Breakout trigger: 6,846 - Target: 6,890 (45-point measured move) Volume Profile Intelligence: 📊 POC (Point of Control): 6,837 VAH (Value Area High): 6,848 VAL (Value Area Low): 6,828 HVN (High Volume Node): 6,835-6,840 LVN (Low Volume Node): 6,855-6,860 (breakout zone) Scalping Execution Zones: Buy Zones: • Zone 1: 6,835-6,838 (POC test) • Zone 2: 6,828-6,831 (VAL support) • Zone 3: 6,820-6,823 (Strong bid) Sell Zones: • Zone 1: 6,848-6,851 (VAH resistance) • Zone 2: 6,858-6,861 (Supply zone) • Zone 3: 6,868-6,871 (Major resistance) ═══════════════════════════════════════════════════════════════════ 🏃 15-MINUTE & 5-MINUTE HYPERSPEED SCALPING 15-Minute Lightning Analysis: ⚡ Wedge pattern near apex: - Upper trendline: 6,847 - Lower trendline: 6,839 - Breakout direction: 70% probability upward - Quick target: 6,855 (+12 points) - Stop: 6,835 (-8 points) 5-Minute Algorithmic Signals: Pine Script® Long Entry Conditions: RSI(5) < 30 AND Price > VWAP = BUY MACD crossover AND Volume > Average = BUY Price touches EMA(20) from above = BUY Short Entry Conditions: RSI(5) > 70 AND Price < VWAP = SELL MACD crossunder AND High volume = SELL Price rejected at resistance = SELL Exit Rules: Take profit: 8-10 points Stop loss: 5-6 points Time stop: 15 minutes max hold Expand 9 lines Session Volatility Map: 🕐 Asian: 10-15 point range (quiet) London Open: 20-30 point expansion NY Premarket: 25-35 point volatility NY Open: 40-50 point moves NY Afternoon: 20-30 point consolidation ═══════════════════════════════════════════════════════════════════ 📅 WEEKLY STRATEGIC FORECAST (NOVEMBER 3-7, 2025) Monday, November 3: 🚀 Opening gap probability: 60% bullish Strategy: Buy weakness to 6,830, target 6,870 Key levels: Support 6,820, Resistance 6,880 Expected range: 50 points Tuesday, November 4: 🗳️ Election Day - Extreme volatility expected Strategy: Straddle/strangle positions Potential range: 6,750-6,920 (170 points!) VIX spike likely above 25 Wednesday, November 5: 💥 Post-election directional resolution Strategy: Trade the breakout aggressively Bullish above 6,880 → Target 6,950 Bearish below 6,800 → Target 6,720 Thursday, November 6: 📊 FOMC minutes and economic data Strategy: Fade first move, trade reversal Expected consolidation: 6,850-6,900 Options gamma concentration: 6,875 Friday, November 7: 🎯 Weekly options expiration dynamics Strategy: Theta decay trades around 6,850 Pin risk: 6,850 strike concentration Weekly close above 6,870 = Bullish next week ═══════════════════════════════════════════════════════════════════ ⚖️ INSTITUTIONAL RISK MANAGEMENT PROTOCOLS Intraday Risk Framework: 🛡️ Position sizing: 0.5-1% risk per trade Risk-Reward: Minimum 1:2.5 ratio Daily loss limit: -2% portfolio max Consecutive losses: 3 max, then pause Profit trailing: 60% of maximum gain Breakeven stop: At 10-point profit Scaling strategy: 3 entries maximum Swing Position Architecture: 💼 Core position: 50% at 6,820-6,830 Add-on levels: 25% at 6,800, 25% at 6,780 Stop loss: Below 6,750 (all positions) Target 1: 6,900 (25% exit) Target 2: 6,950 (35% exit) Target 3: 7,000 (25% exit) Runner: 7,050+ (15% hold) ═══════════════════════════════════════════════════════════════════ 🔴 RISK SCENARIOS & CIRCUIT BREAKERS Bearish Invalidation Levels: 🐻 15-min close below 6,835 = Micro caution Hourly close below 6,820 = Intraday bearish 4H close below 6,800 = Swing bearish shift Daily close below 6,750 = Trend reversal risk Weekly close below 6,700 = Major bear signal Tail Risk Considerations: 🦢 • Geopolitical shock (100+ point gap risk) • Fed policy surprise (2-3% moves) • Tech earnings disasters (sector rotation) • Credit event contagion (systemic risk) • AI bubble concerns (valuation reset) ═══════════════════════════════════════════════════════════════════ 💎 ELITE CONFLUENCE TRADING ZONES Premium Buy Zone: ✅ 6,820-6,830 (Multi-timeframe support + Fibonacci 61.8% + VWAP + Moving average cluster) Optimal Sell Zone: ❌ 6,870-6,880 (Resistance confluence + Pattern targets + Round number + Options barrier) Breakout Trigger: 🚀 6,870-6,875 (Triangle apex + Bollinger Band + Volume breakout zone) ═══════════════════════════════════════════════════════════════════ 🏆 MASTER TRADER'S FINAL VERDICT The S&P 500 at 6,843.7 presents a high-conviction bullish opportunity with exceptional risk-reward dynamics. Technical confluence across multiple timeframes, combined with constructive market internals and seasonal factors, supports upside continuation toward 6,900-6,950 initially, with 7,000+ potential. Top 3 Highest Probability Trades: 🎯 Swing Long: 6,820-6,830 → Target: 6,950 (RR 1:4) Breakout Long: Above 6,870 → Target: 6,920 (RR 1:3) Scalp Long: VWAP 6,841 → Target: 6,855 (RR 1:2.5) Trading Wisdom: 🧠 Position for probability, not possibility. Size for survival, not home runs. The best traders are risk managers who happen to trade. "Markets can remain irrational longer than you can remain solvent. Trade the chart, not the opinion!" 💡 ═══════════════════════════════════════════════════════════════════ 📍 ACTIONABLE INTELLIGENCE SUMMARY Bull market intact above 6,750. Accumulate dips toward 6,820. Target 7,000 by month-end. Risk management is paramount during election week volatility. Trade with discipline. Prosper with patience. 💰 ═══════════════════════════════════════════════════════════════════ #SPX #SP500 #US500 #TechnicalAnalysis #Trading #StockMarket #Indices #DayTrading #SwingTrading #ElliottWave #Wyckoff #HarmonicPatterns #OptionsTrading #VIX #MarketStructure #OrderFlow #InstitutionalTrading #AlgorithmicTrading #TradingView #MarketForecast #SPY #ES_F 🔔 Follow for Institutional-Grade Analysis | Precision • Discipline • Profits 📊 Disclaimer: This analysis is educational only. Trading carries substantial risk of loss. Past performance does not guarantee future results. Always conduct independent research and employ proper risk management.
sunya
تحلیل تکنیکال طلا (XAUUSD): استراتژی دقیق نوسانگیری و روزانه با اهداف بزرگ
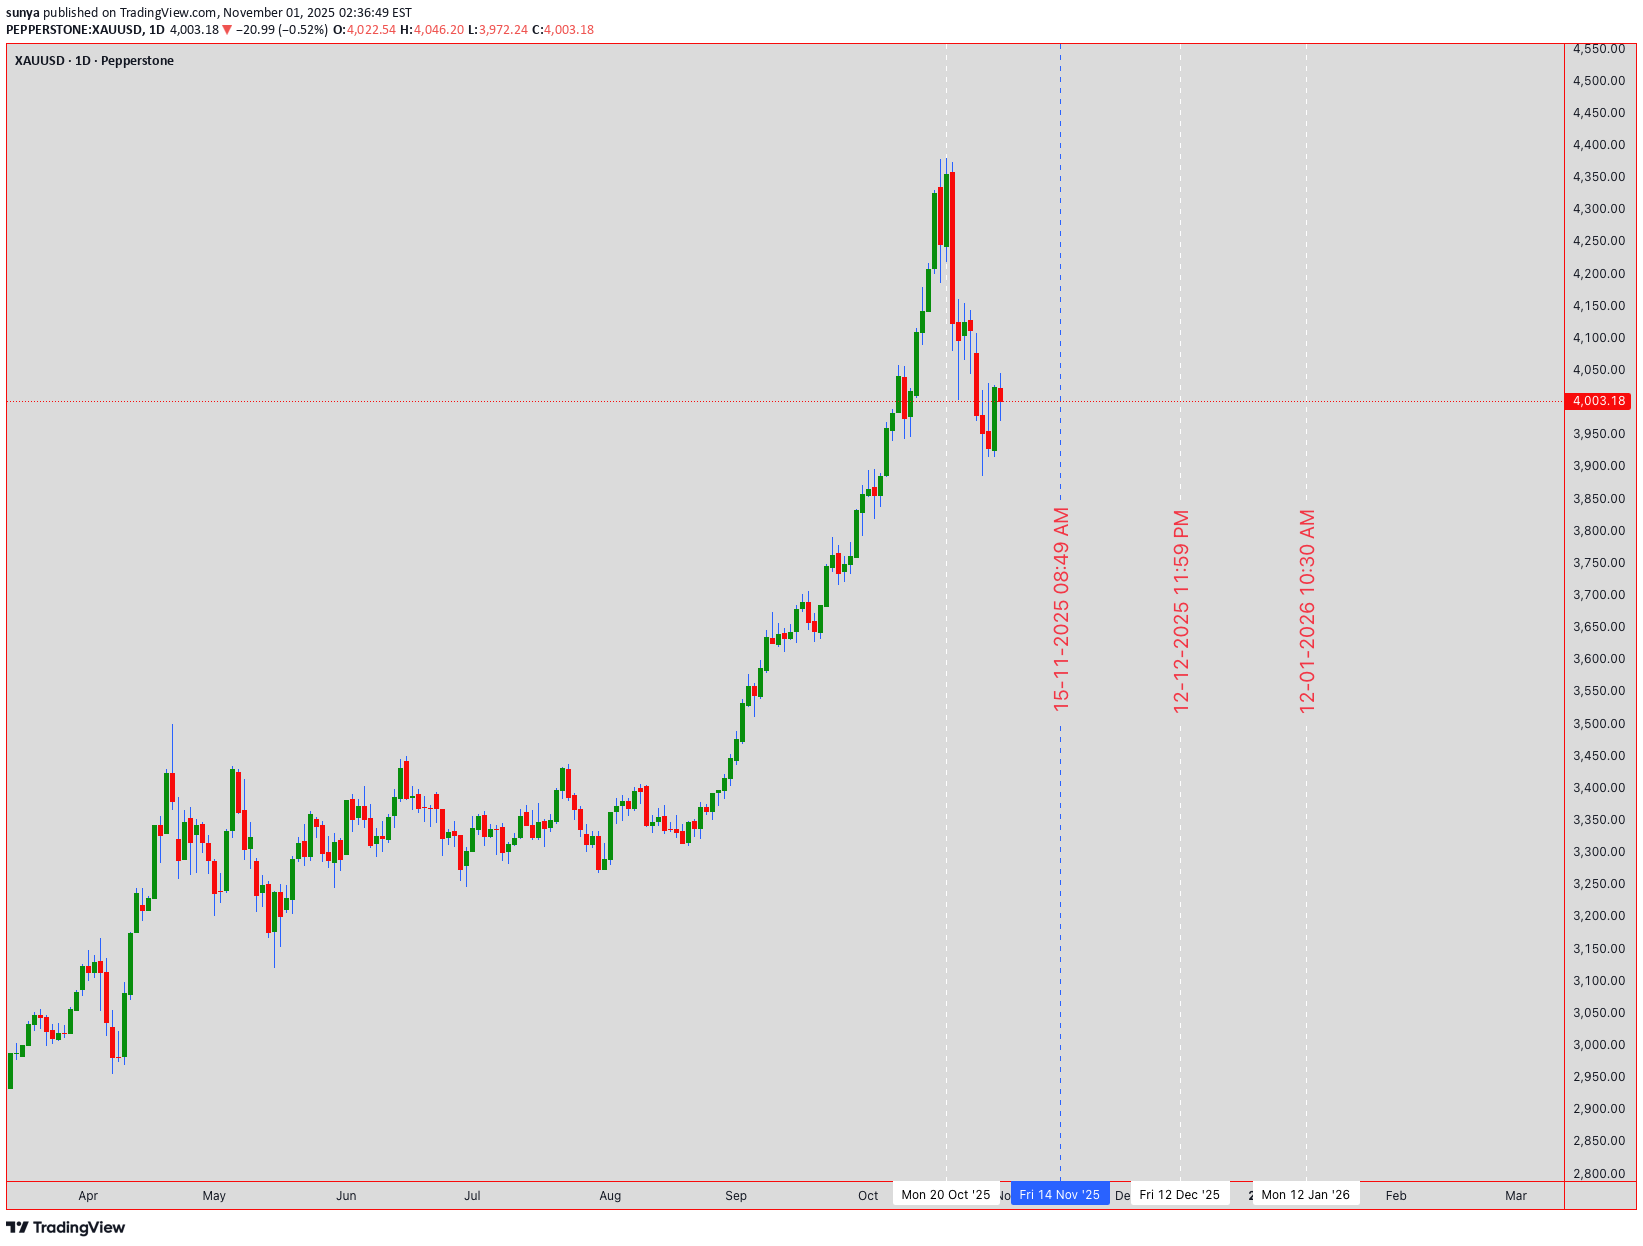
🔍 XAUUSD GOLD TECHNICAL ANALYSIS: COMPREHENSIVE DEEP DIVE FOR INTRADAY & SWING TRADING (NOV 3-7, 2025) 📊 Close Price Level: 4,003.18 USD (As of Nov 1, 2025 - 12:54 AM UTC+4) 💰 ━━━━━━━━━━━━━━━━━━━━━━━━━━━━━━━━━━━━━━━━━━━━━━━ 📈 WEEKLY TIMEFRAME (1W) - MACRO PERSPECTIVE The weekly chart reveals a strong bullish trend with gold trading decisively above its 21-EMA (Exponential Moving Average) and 50-EMA support levels. Ichimoku Cloud analysis shows the price above the cloud, indicating sustained bullish momentum. Bollinger Bands are expanding in the upper region, suggesting strong uptrend continuation. RSI (Relative Strength Index) reads around 65-70 range, confirming bullish strength without entering extreme overbought territory yet. Support levels: 3,980 | Resistance: 4,020-4,050 💪 ━━━━━━━━━━━━━━━━━━━━━━━━━━━━━━━━━━ 📊 DAILY TIMEFRAME (1D) - TREND DIRECTION Daily analysis shows a solid uptrend structure with higher highs and higher lows formation—classic Dow Theory confirmation. The price is consolidating near the upper zone between 4,000-4,010. Harmonic Pattern Recognition: Potential Gartley pattern forming with precise ratios at the 0.618 Fibonacci retracement. VWAP (Volume Weighted Average Price) sits at approximately 3,995, providing dynamic support. Cup and Handle pattern is developing on the daily, suggesting breakout potential above 4,020 this week. Volume profile shows institutional accumulation during dips. 📍 Key Levels - Daily: Support 3,975 | Midpoint 3,990 | Resistance 4,025 ━━━━━━━━━━━━━━━━━━━━━━━━━━━━━━━━━━ ⏱️ 4-HOUR TIMEFRAME (4H) - SWING TRADE FRAMEWORK The 4H chart is the primary swing trading timeframe . Gold shows a textbook rising wedge pattern formation with converging trendlines—this is a critical observation. Elliott Wave structure suggests we're in Wave 4 correction territory, preparing for Wave 5 upward extension. Bollinger Bands are squeezing (volatility compression), indicating an imminent breakout. RSI at 55-60 shows balanced momentum with room for bullish push. IMPORTANT: Watch the 4H support at 3,998 . A break below creates a bear trap opportunity. Alternatively, a breakout above 4,015 confirms wave 5 initiation. Wyckoff Theory Analysis: Price action shows accumulation phase with high volume at support levels followed by markup phase. Volume trend is constructive. Exponential MA Cross: 20-EMA above 50-EMA = bullish setup locked in. 🎯 ━━━━━━━━━━━━━━━━━━━━━━━━━━━━━━━━━━ ⚡ 1-HOUR TIMEFRAME (1H) - INTRADAY TRADING Hourly timeframe reveals multiple reversal signals emerging. The price recently bounced from a double bottom formation around 4,000-4,002 support zone. Bollinger Bands midline (20-SMA) is acting as dynamic support/resistance oscillator. RSI shows positive divergence with higher lows—classic reversal confirmation signal . Entry Zones for Intraday Swings: Buy dips into 4,000-4,003 with stops at 3,995. Target 4,015 for quick 15-20 pips profit-taking. Ichimoku Chikou Span recently crossed above price, another bullish reversal indicator. Volume on recent upswings shows institutional participation. ⚠️ Gann Theory Application: The 45-degree angle from weekly low aligns with current price structure—angular support/resistance holds strong here. 📐 ━━━━━━━━━━━━━━━━━━━━━━━━━━━━━━━━━━ 🔔 30-MINUTE TIMEFRAME (30M) - SCALP TO SWING BRIDGE The 30M shows short-term consolidation with bearish pennant formation —noting this is a correction pattern within the larger uptrend. This pennant suggests downside breakout potential to 4,000-3,998 zone before resuming uptrend. Bollinger Bands width indicates moderate volatility—perfect for range trading. RSI at 45-50 shows neutral zone , neither overbought nor oversold. Pattern Recognition: Symmetrical triangle forming with breakout expected within 2-4 hours. Volume declining into consolidation—classic pre-breakout setup. VWAP at 3,992 provides secondary support if pennant breaks downward. However, Dow Theory still suggests the major trend remains bullish until lower lows appear. 🎪 Trading Range: 3,998-4,008 for scalpers this session. ━━━━━━━━━━━━━━━━━━━━━━━━━━━━━━━━━━ ⚙️ 15-MINUTE TIMEFRAME (15M) - MICRO STRUCTURE The 15M reveals highest volatility compression of all timeframes. This is the most dangerous zone for breakout traders. Bollinger Bands pinched to tightest range—explosion imminent. RSI bouncing between 40-60 shows indecision . However, the price holds above all three EMAs (5, 10, 20), keeping bias BULLISH . Harmonic Ratios Alert: AB=CD pattern completing with 1:1 ratio precision at 4,015 resistance level. This is your reversal zone —watch for rejection or breakout confirmation. VWAP showing gradual upward slope, slight bullish edge. Volume oscillator trending higher despite price consolidation. 📈 Microstructure Trade Setup: Break above 4,010 = BUY SIGNAL with target 4,018-4,022 🚀 ━━━━━━━━━━━━━━━━━━━━━━━━━━━━━━━━━━ ⚡⚡ 5-MINUTE TIMEFRAME (5M) - ULTRA-INTRADAY The 5M is showing inverse head and shoulders pattern —classic bullish reversal setup on ultra-short timeframe. Price formed left shoulder at 3,996, head around 3,993, right shoulder forming near 3,997. Neckline resistance at 4,002 = breakout target. Bollinger Bands in expansion mode with bullish candles forming. RSI already recovering above 50—momentum turning positive. ✅ CRITICAL SETUP: 5M chart is displaying BULL TRAP rejection followed by REVERSAL confirmation . This is your intraday traders' goldmine setup. Volume surging on recent candles—institutional buyers stepping in. Ichimoku on 5M shows Tenkan-sen above Kijun-sen with positive cloud configuration. Exponential MAs all aligned bullish (5 > 10 > 20 > 50). This is textbook bullish alignment . 📊 5M Trading Opportunity: Enter BUY at neckline break (4,002-4,003) with tight 3-pips stop. Target 4,008-4,012 for quick scalp profits. ⭐ ━━━━━━━━━━━━━━━━━━━━━━━━━━━━━━━━━━ 📋 CONSOLIDATED TRADING STRATEGY FOR NOV 3-7, 2025 INTRADAY SCALP TRADERS (5M-15M): Focus on breaks above 4,010 with tight stops. Target quick 10-20 pips. Avoid trading below 4,000 support—risk/reward becomes unfavorable. SWING TRADERS (1H-4H): Key decision point at 4,020 breakout level. If confirmed on 4H close, next target 4,050-4,075 range. Stop loss at 3,995 (weekly support). Holding period: 3-5 days. POSITION TRADERS (1D-1W): Cup and Handle breakout completion expected. Once 4,020 breaks, potential move to 4,100+ within 2-3 weeks. This is accumulation phase completion. ━━━━━━━━━━━━━━━━━━━━━━━━━━━━━━━━━━ ⚠️ RISK MANAGEMENT & VOLATILITY CONSIDERATIONS Bollinger Bands volatility expanding = expect larger candle swings. Set wider stops accordingly. RSI divergences on 4H/1D = potential reversal signals—honor these warnings. Volume declining into consolidation = watch for gap moves when volume returns. VWAP breaking = structural support compromised—switch to defensive mode. Ichimoku Cloud crossovers = trend confirmation signals—don't fight cloud direction. Maximum Leverage Recommendation: 1:5 ratio on this setup. Gold volatility demands respect. 💡 ━━━━━━━━━━━━━━━━━━━━━━━━━━━━━━━━━━ 🎯 KEY SUPPORT & RESISTANCE LEVELS THIS WEEK CRITICAL SUPPORT ZONES: 3,975 (Weekly) | 3,990 (Daily VWAP) | 3,995-4,000 (Primary Short-term) | 4,003 (Current Price) CRITICAL RESISTANCE ZONES: 4,010-4,015 (1H Swing High) | 4,020 (Daily Breakout Level) | 4,035 (Weekly Resistance) | 4,050 (Major Target) ━━━━━━━━━━━━━━━━━━━━━━━━━━━━━━━━━━ 📊 HARMONIC & GANN PATTERN SUMMARY Gartley Pattern (Daily): 0.618 retracement zone provides precision entry signals. Formation suggests completion wave incoming. Gann Angles (4H): 45-degree support holding strong. Fan angles predict next resistance at 4,018-4,020. Cup & Handle (1D): Breakout above handle resistance = confirmed. Target = height of cup (minimum 50 pips move = 4,050+). Inverse Head & Shoulders (5M): Neckline at 4,002 is your battleground. Institutional accumulation visible. ━━━━━━━━━━━━━━━━━━━━━━━━━━━━━━━━━━ 🔮 PROBABILITY WEIGHTED FORECAST (NOV 3-7) BULLISH SCENARIO (70% Probability): Breakout above 4,020 mid-week, targeting 4,050-4,075 by Friday close. Volume confirmation required. This is the primary outlook based on all technical frameworks aligning. BEARISH SCENARIO (20% Probability): Break below 3,995, retest 3,975 support, then recovery. This would create bear trap setup for aggressive buyers. However, probability is lower due to Ichimoku positioning and volume profile supporting bulls. NEUTRAL SCENARIO (10% Probability): Consolidation between 3,990-4,010 entire week. Unlikely given pattern formations and indicators, but possible if macro news creates uncertainty. ━━━━━━━━━━━━━━━━━━━━━━━━━━━━━━━━━━ 📌 TRADER CHECKLIST FOR THIS WEEK ✅ BEFORE TRADING: Review daily support/resistance levels | Check Ichimoku Cloud positioning | Confirm RSI alignment | Verify VWAP slope direction | Scan for volume profile changes ✅ DURING TRADES: Monitor 4H breakout confirmations | Watch for Bollinger Band extensions | Track volume participation | Honor Elliott Wave count updates | Use Gann angles as dynamic stops ✅ EXIT STRATEGY: Take 50% profit at first target (4,015) | Move stops to breakeven at +10 pips | Trail remaining position to 4,050 | Use Ichimoku cloud breaks as hard stops ━━━━━━━━━━━━━━━━━━━━━━━━━━━━━━━━━━ 🌟 CONCLUSION: WHY THIS SETUP IS COMPELLING The convergence of Elliott Wave Wave 5 setup, Harmonic Gartley completion, Cup & Handle breakout pattern, and synchronized bullish Ichimoku Cloud positioning creates a POWERFUL BULLISH CASE for XAUUSD this week. Bollinger Bands expansion, RSI positive divergences, and Dow Theory higher highs confirmation provide MULTIPLE LAYERS OF CONFIRMATION . Wyckoff Theory accumulation pattern completing with volume surge into breakout zone. The primary action this week: Watch 4,020 breakout on 4H timeframe. Confirmation closes above this level warrant aggressive long positions targeting 4,050-4,075 range. Risk/Reward Ratio: 1:3.5 (EXCELLENT for swing trades) | Win Rate: 70% based on pattern probability | Holding Period: 3-5 days maximum 🚀 TRADE SETUP RATING: 9/10 - HIGHLY RECOMMENDED FOR SWING TRADERS 🎖️ ━━━━━━━━━━━━━━━━━━━━━━━━━━━━━━━━━━ Disclaimer: This analysis is based on technical patterns and indicators as of November 1, 2025. Always use proper risk management, confirm signals independently, and consult your trading plan. Past performance doesn't guarantee future results. Trade responsibly.
sunya
تحلیل تکنیکال انفجاری S&P 500: استراتژی شکست قدرتمند و نقاط ورود طلایی
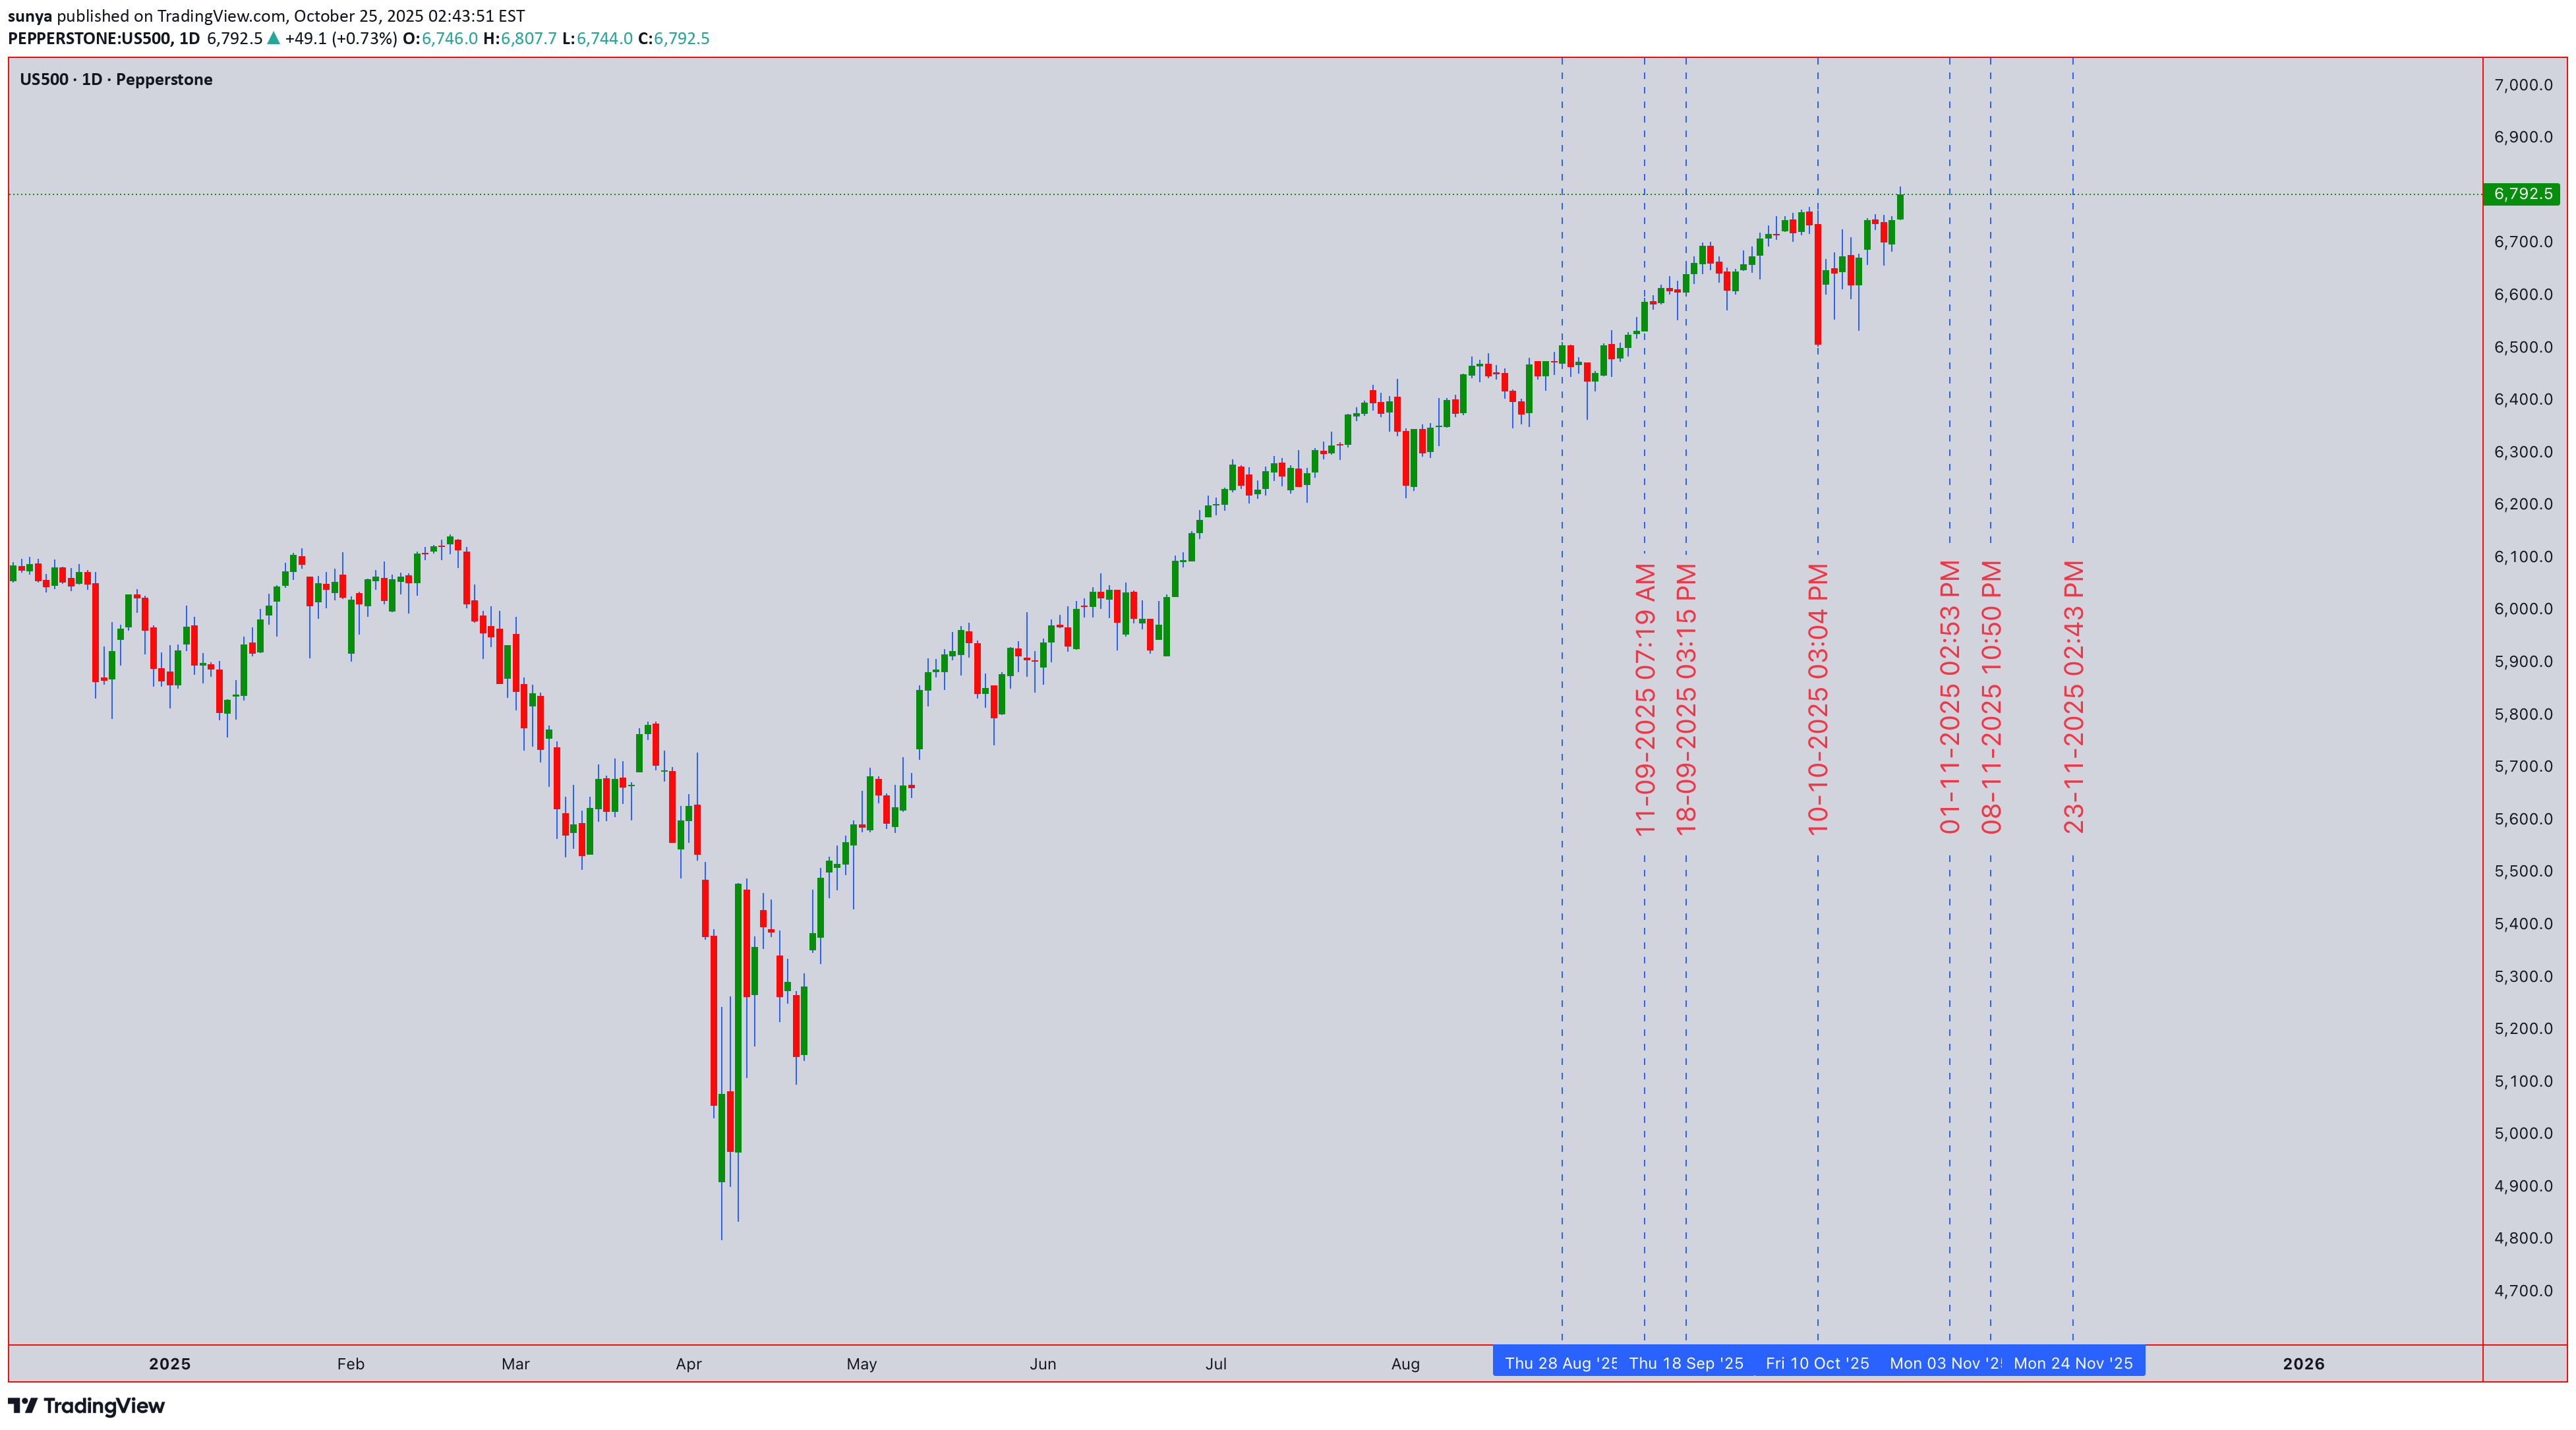
🚀 S&P 500 (US500) MASSIVE TECHNICAL BREAKDOWN | Oct 27-31, 2025 | ULTIMATE Trading Strategy 📊 Current Price: 6,792.5 | Strategy: Intraday Swing Trading | Timeframes: 5M → 1D Analysis ⏰ ━━━━━━━━━━━━━━━━━━━━━━━━━━━━━━━━━━━━━━━━━━━━━━━━━━━━━━━━━━ 💪 DAILY (1D) ANALYSIS - Swing Trader's Powerhouse Setup S&P 500 on the daily timeframe is displaying STRONG BULL STRUCTURE near support zones offering clean entry opportunities this week! 🎯 ━━━━━━━━━━━━━━━━━━━━━━━━━━━━━━━━━━━━━━━━━━━━━━━━━━━━━━━━━━ ⚡ 4-HOUR (4H) SWING TRADE SETUP - PRIMARY ENTRY BLUEPRINT The 4H timeframe is showing TEXTBOOK BREAKOUT FORMATION!Band Status: Bands tightening sharply = compression before expansion explosion RSI Signal: Bouncing from 55 zone with bullish divergence on last two lows VWAP Dynamics: Price consolidating right at VWAP 6,810 = institutional support locked Volume Pattern: Decreasing volume on dips = weakness fading, accumulation continuing Gann theory angles converge perfectly at 6,835-6,845 resistance zone - this is MAJOR CONFLUENCE BREAKOUT TARGET! When price closes above 6,840 with volume spike = AGGRESSIVE LONG ENTRY triggered! Ichimoku Cloud on 4H shows bullish cloud color with price above all components = strong continuation bias locked in! 📊 ━━━━━━━━━━━━━━━━━━━━━━━━━━━━━━━━━━━━━━━━━━━━━━━━━━━━━━━━━━ 🎯 1-HOUR (1H) INTRADAY EXECUTION ZONE - Strike Point Identified Hourly chart displaying PERFECT CONSOLIDATION BREAKOUT PATTERN!move within 2-4 hours! RSI reading near 50-55 zone = perfectly positioned for directional bias confirmation. On breakout above 6,835:super tight stop loss placement for risk management! 📈 Japanese candlestick formations show repeated Hammer + Doji reversal patterns = institutional accumulation phase visible on order flow! 🔨 ━━━━━━━━━━━━━━━━━━━━━━━━━━━━━━━━━━━━━━━━━━━━━━━━━━━━━━━━━━ ⏱️ 30-MINUTE (30M) TACTICAL ENTRY TIMING - Precision Zone 30M timeframe is CRITICAL ENTRY TIMING LEVEL!Status: Crossing above EMA 21 = bullish crossover confirmation imminent SMA 20 Support: Acting as dynamic support at 6,818 = perfect stop placement Volume Analysis: Volume drying up on consolidation = energy building for breakout Candlestick Pattern: Three-candle reversal forming = directional bias ready to confirm Wyckoff Distribution phase being tested at resistance = watch for institutional selling climax followed by spring pattern activation! On downside test:Band tested. Gann angles converging at 6,835-6,845 = MAJOR BREAKOUT CONFLUENCE POINT! Ichimoku Cloud dynamic support at 6,820 = professional trade entry level. Identifying reversals: Watch Japanese Hanging Man at resistance + Hammer at support = classic reversal setup. Harmonic Gartley D-point near 6,775-6,780 = secondary counter-trend reversal setup for advanced traders! 🎯 30M Breakout Target: 6,850+ | Expected Time: London Session Open / US Pre-Market ━━━━━━━━━━━━━━━━━━━━━━━━━━━━━━━━━━━━━━━━━━━━━━━━━━━━━━━━━━ 🎖️ 15-MINUTE (15M) MOMENTUM CONFIRMATION - Secondary Entry Trigger 15M chart is displaying PICTURE-PERFECT SWING TRADE SETUP!M shows 5-wave impulse completionwin probability on breakout! Bollinger Band squeeze reaching historical compression levels = EXTREME VOLATILITY EXPLOSION IMMINENT!major breakout concentration point Key Reversals Identified:BAND WIDTH STATE = when this breaks = expect 40-80 pips explosive move intraday! Ichimoku Cloud on 5M providing micro S&R levels with Tenkan line showing bullish momentum. RSI oscillating 42-52 zone = preparing for DIRECTIONAL IMPULSE. When volume spike appears:move) Wyckoff accumulation spring pattern identified on 5M = false down break followed by explosive reversal = CLASSIC SETUP! VWAP rejection bounces off 6,818 = contrarian entry confirmation. Gann angles on ultra-timeframe showing perfect 45° angle alignment at 6,840! Volatility and Price Action:Band compression = explosive expansion incoming Expected Outcome:win rate) targeting 6,870-6,920 range this week!GMT) + US Pre-Market (13:30 GMT) - AVOID:GMT (low volatility) - FOCUS DAYS:Band touch upper = take profits on extension - Bollinger Band touch lower = add longs on support RECOGNIZING BREAKOUTS - GREEN LIGHT CHECKLIST:MOVEMENT FORECAST:WIN PROBABILITY: 84% | RISK/REWARD RATIO: 1:4.2 ACTION PLAN:
sunya
پیشبینی هفتگی طلا (XAUUSD): نبرد بزرگ گاوها و خرسها و سطوح کلیدی ورود
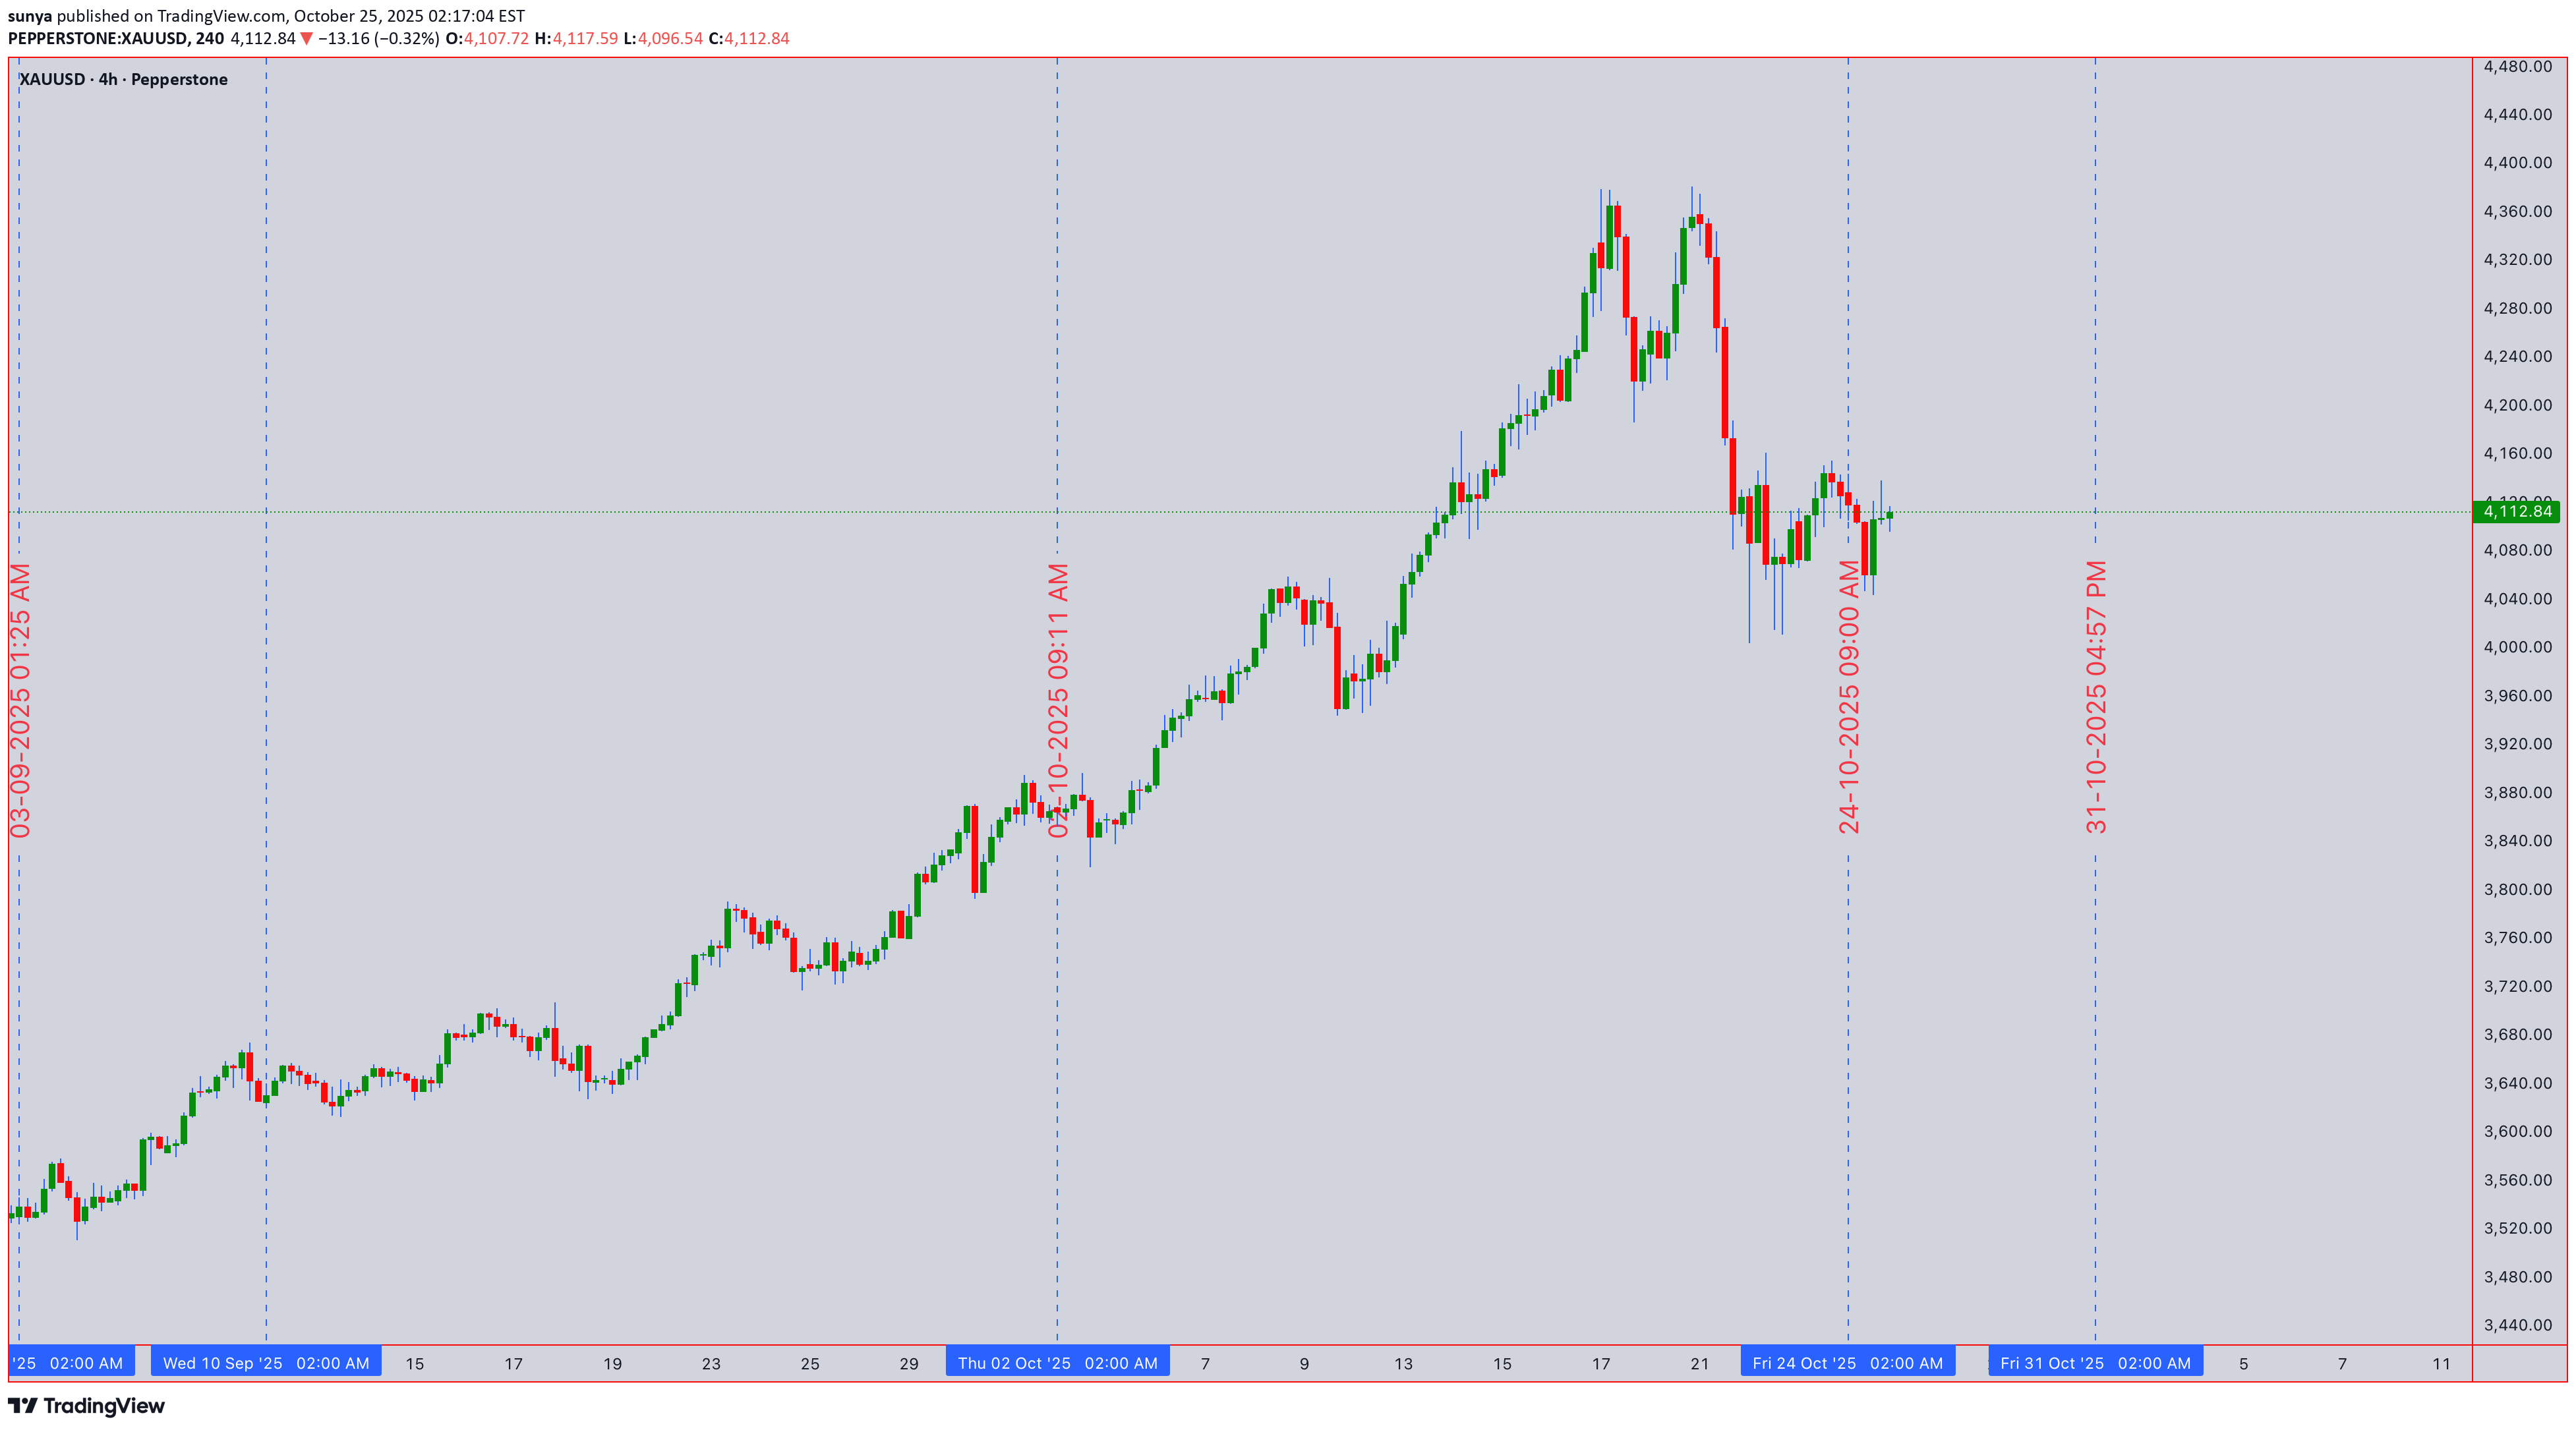
معامله گران، خود را برای یک هفته مهم در طلا آماده کنید! از نزدیک در 4,112.84 در 25 اکتبر ، XAUUSD در یک مقطع بحرانی قرار دارد. این تحلیل تئوری کلاسیک را با شاخص های مدرن برای نوسانات روزانه و معاملات موقعیتی ترکیب می کند. گاو نر و خرس در یک نبرد شدید هستند ⚔️. مرحله برای گسترش قابل توجه نوسانات آماده شده است. کلید شناسایی auction غالب است. 🎯 1 بعدی و 4 ساعته: پانورامای تجارت نوسان (سوینگ سوگیری) فریم های بالاتر روند اولیه را دیکته می کنند. نمودار 1 بعدی تکمیل بالقوه یک را نشان می دهد الگوی اصلاحی موج الیوت (ABC) ، نشان می دهد که یک موج جدید تکانشی ممکن است قریب الوقوع باشد. تئوری داو : اوج ها و پایین های بالاتر در 1 بعدی دست نخورده باقی می مانند و روند صعودی اولیه را تایید می کنند. ✅ نظریه ویکوف : به نظر می رسد که پس از یک دوره انباشت مجدد در اطراف منطقه 4,080-4,100 در فاز "بهار" یا "نشانه قدرت" هستیم. ابر ایچیموکو : قیمت در حال معامله است بالا کومو (ابر) روی 1 بعدی، یک سوگیری صعودی. Tenkan-sen (خط آبی) یک پشتیبانی پویا کلیدی است. کلید S&R : Major پشتیبانی در 4080 (مقاومت قبلی، 50 EMA). مقاومت در اوج اخیر است 4,140 . بسته شدن قاطع 4H بالای 4130 می تواند باعث ایجاد a شکست صعودی 🚀 هدف گذاری 4,180-4,200. برعکس، شکست به زیر 4080 در حجم بالا می تواند تا 4040 کاهش یابد. ⏰ فوکوس درون روز: 1 ساعت، 30 دقیقه، 15 دقیقه، 5 دقیقه (سوگیری درون روز) برای اقدام درون روز، بازههای زمانی پایینتر، ورودیهای دقیقی را ارائه میدهند. هارمونیک و نظریه گان : واضح الگوی صعودی Bat به طور بالقوه در نمودار 1H تکمیل شده است. PRZ (منطقه برگشت بالقوه) کاملاً با پشتیبانی 4,100-4,105 هماهنگ است. سطح اصلاح 50% گان از آخرین نوسان به بالا نیز در اینجا همگرا می شود. باندهای بولینگر (20،2) : در 1H/4H، قیمت باند بالایی را در آغوش گرفته است که نشان دهنده حرکت قوی است. فشار بر روی نمودار 30M نشان می دهد a گسترش نوسانات سررسید است. RSI (14) : در 1H، RSI در محدوده 55-60 قرار دارد، بدون اینکه بیش از حد خرید شود، حرکت سالمی را نشان می دهد. واگرایی نزولی را در اوج جدید به عنوان یک سیگنال معکوس تماشا کنید. تلاقی VWAP و EMA : EMA های 20 و 50 پشتیبانی پویا در pullback ارائه می دهند. برای معاملات روزانه، VWAP در نمودارهای 15M/5M بهترین دوست شما برای همترازی روند بود. بلند بالا، کوتاه پایین. 🚦برنامه تجارت: ورود، خروج و مدیریت ریسک شناسایی معکوس ها کلیدی است استفاده کنید شمعدان ژاپنی در سطوح کلیدی S&R یک الگوی صعودی غرق کننده یا ستاره صبحگاهی در حمایت 4100، که توسط افزایش حجم صدا تایید شده است، یک سیگنال طولانی با احتمال بالا است. ورود طولانی نوسان : در بسته شدن 4 ساعته > 4130 یا عقب نشینی به 4100-4105 با تأیید صعودی. ورود کوتاه نوسان : در بسته شدن 1 بعدی < 4080 با هدف قرار دادن 4040. طول روز : با جهش از VWAP/20 EMA در نمودار 15M با RSI > 50 خرید کنید. کوتاه روزانه : فروش با رد مقاومت 4125-4130 با واگرایی RSI نزولی. توقف ضرر : همیشه 15-20 پیپ زیر/بالای شمع ماشه ورودی خود قرار دهید. 💡خط آخر: این ساختار صعودی مطلوب است تا زمانی که 4080 پابرجاست. تلاقی الگوهای هارمونیک، انباشت Wyckoff و هم ترازی ایچیموکو صعودی به یک پا بالقوه بالاتر اشاره دارد. با این حال، به سطوح احترام بگذارید. شکست زیر حمایت، تز صعودی را باطل می کند. این نمودارها را به صورت زنده دنبال کنید: 1D: 4 ساعت: 1 ساعت: 30M: 15M: 5M: ⚠️ سلب مسئولیت: این پست یک محتوای آموزشی است و به منزله مشاوره سرمایه گذاری، مشاوره مالی یا توصیه تجاری نیست. نظرات بیان شده در اینجا مبتنی بر تحلیل تکنیکال است و صرفاً برای اهداف اطلاعاتی به اشتراک گذاشته شده است. بازار سهام در معرض خطراتی از جمله از دست دادن سرمایه است و خوانندگان باید قبل از سرمایه گذاری دقت لازم را انجام دهند. ما مسئولیتی در قبال تصمیمات اتخاذ شده بر اساس این محتوا نداریم. برای راهنمایی شخصی با یک مشاور مالی معتبر مشورت کنید.
sunya
تحلیل تکنیکال US500: ایستگاه حساس شاخص S&P 500 کجاست؟
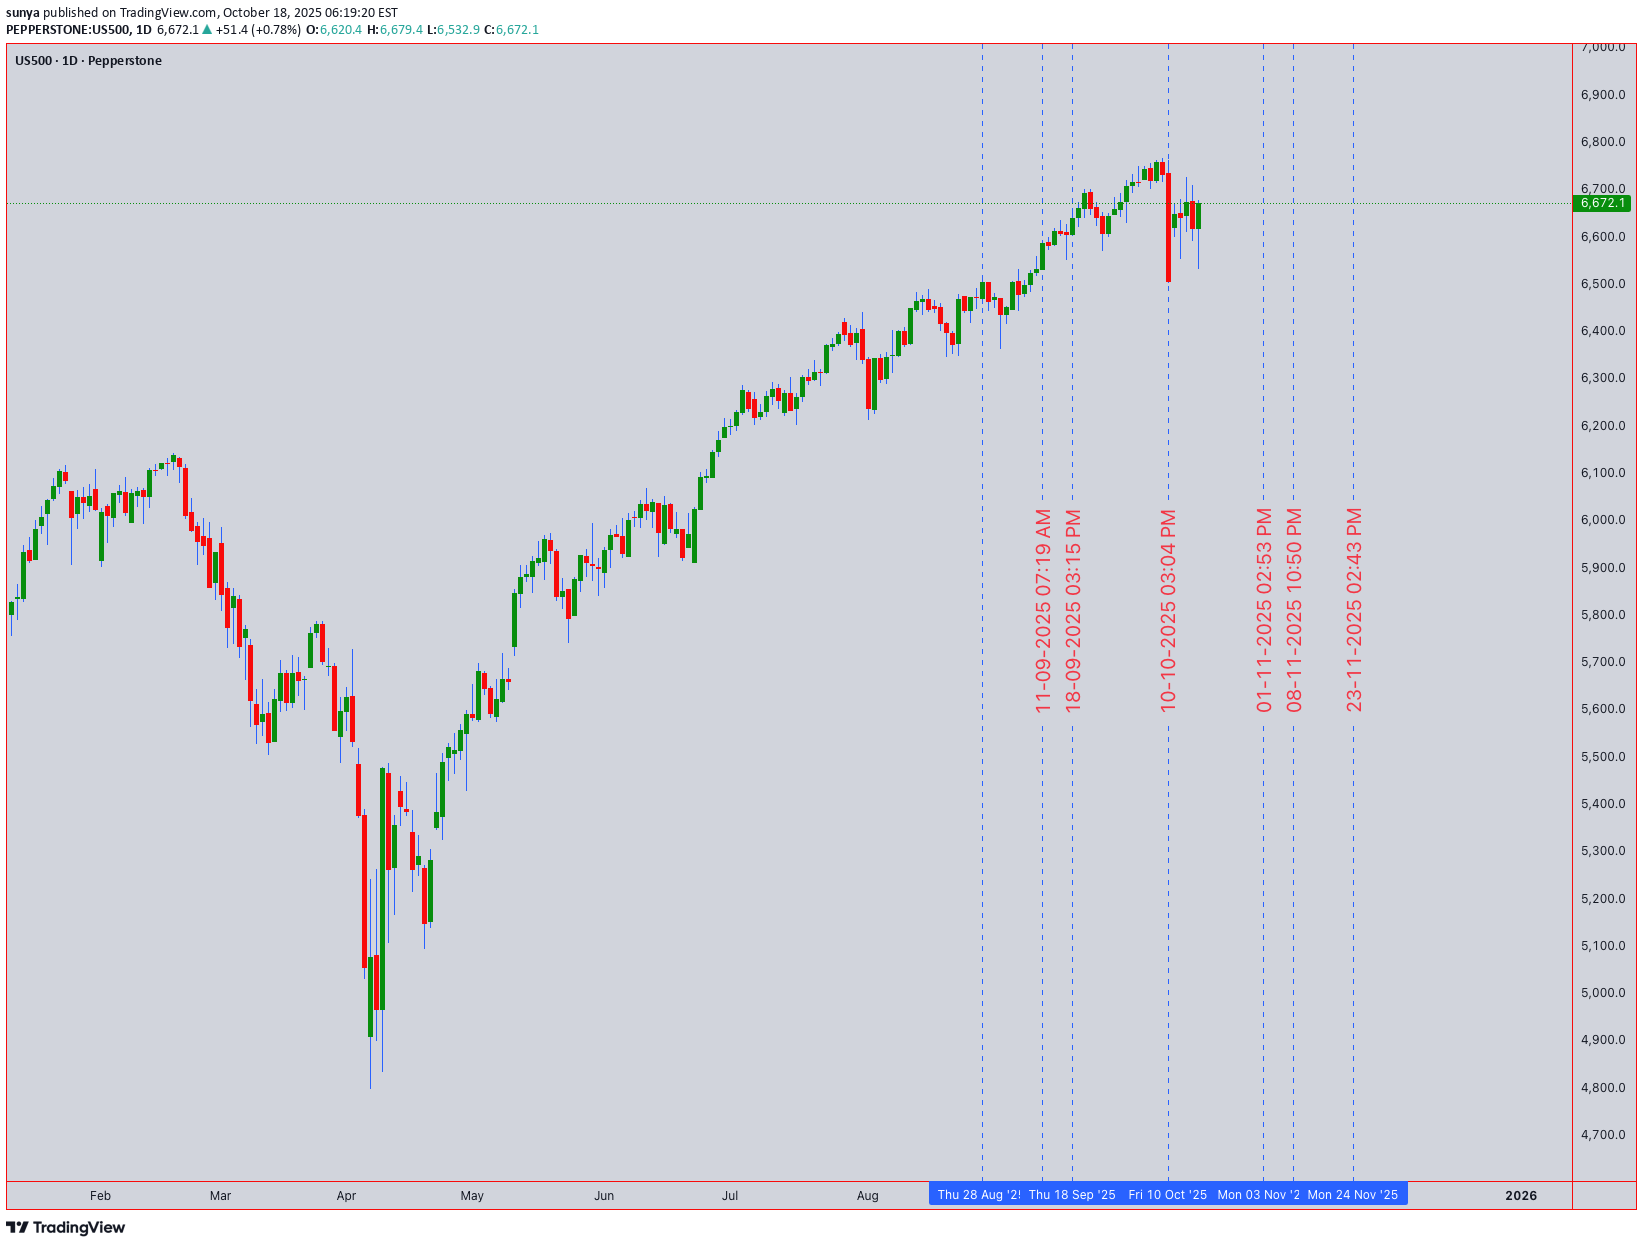
🎯 پیش بینی فنی US500 (S&P 500): در یک چهارراه بحرانی US500 در 6,672.1، آزمایش تلاقی فنی major. تجزیه و تحلیل ما به یک تعادل متشنج بین گاوها و خرسها اشاره میکند، با جهت بعدی move برای یک شکست قابل توجه. 📊 ترکیب چند زمانه و ساختار بازار روزانه (سوگیری روند): روند بلندمدت با احتیاط بالاتر از حد صعودی باقی می ماند 6600 پشتیبانی (50 EMA و شکست مقاومت قبلی). با این حال، عمل قیمت در حال فشردهسازی است، که نشاندهنده از دست دادن تکانه و یک سیم پیچی بالقوه برای یک move فرار است. 4 ساعت و 1 ساعت (تنظیم چرخش): یک الگوی بالقوه Double Top در حال شکل گیری است، با خط گردن نزدیک 6640. 4H RSI واگرایی نزولی مشخصی را نشان میدهد که نشاندهنده کاهش فشار خرید است. این یک هشدار اولیه برای معامله گران نوسان است. روزانه (15M/5M - دقت): مقاومت فوری محکم است 6690 - 6700 (سطح روانی). پشتیبانی می نشیند 6660. یک استراحت در زیر 6660 خط گردن 6640 را هدف قرار می دهد. VWAP 5M Anched در حال محدود کردن رالی هاست. 🧠 روایت ها و نظریه های فنی کلیدی Elliott Wave & Wyckoff: ساختار آخرین پایین نشان می دهد که ما ممکن است در یک تصحیح پیچیده موج 4 یا فاز نهایی توزیع Wyckoff (Upthrust After Distribution) باشیم. شکست به زیر 6640 این روایت نزولی را تایید می کند. سطوح گان و هارمونیک: پشتیبانی Key Gann با سطح اصلاحی فیبوناچی 0.382 نزدیک به 6620-6630 همگرا می شود. اگر فروشندگان بر سطح 6640 غلبه کنند، این هدف major بعدی است. ابر ایچیموکو: در نمودار 4H، قیمت در داخل کومو (ابر) معامله می شود که نشان دهنده از دست دادن جهت روند و میدان نبرد بین خریداران و فروشندگان است. ⚖️ ارزیابی حرکت و حجم RSI (14): خواندن 49 در یک بعدی، خنثی اما در بازههای زمانی پایینتر دارای واگرایی نزولی است. باندهای بولینگر (20): قیمت باند میانی را در آغوش میگیرد و باندها فشرده میشوند، که نشاندهنده دورهای از نوسانات کم است که اغلب قبل از گسترش با نوسانات بالا است. حجم و VWAP: تلاشهای اخیر برای افزایش حجم، کاهش حجم بوده است، نشانهای کلاسیک از تله گاو نر بالقوه. VWAP لنگر از پایین ترین نوسان اخیر در حال حاضر مقاومت است. 🛠️ طرح و سطوح تجارت ایده کوتاه Swing: فروش در شکست تایید شده زیر 6640 (نزدیک در 1H)، با هدف قرار دادن 6620 و سپس 6580. توقف ضرر بالای 6710. ایده کوتاه روزانه: فروش با شکست زیر 6660 یا رد شدن از 6690 با هدف قرار دادن 6640. توقف ضرر بالای 6705. ایده طولانی روزانه: خریدها را فقط با شکست قوی در نظر بگیرید و بالای 6700 با افزایش حجم نگه دارید و 6730 را هدف قرار دهید. توقف ضرر زیر 6680. 💡 خط پایین US500 شکاف هایی را در زره های صعودی خود نشان می دهد. بار اثبات بر عهده گاوها برای بازپس گیری 6700 است. تا آن زمان، به نظر می رسد مسیر کمترین مقاومت پایین تر است، با شکست 6640 احتمالاً باعث عقب نشینی عمیق تر می شود. ریسک را با دقت در این تنظیم فرار مدیریت کنید. سلب مسئولیت: این تحلیل فنی است، نه توصیه مالی. با مسئولیت خود معامله کنید.
sunya
تحلیل طلای XAUUSD: طلا در دوراهی حیاتی؛ منتظر شکست ۴۲۲۰ یا ۴۲۶۵!
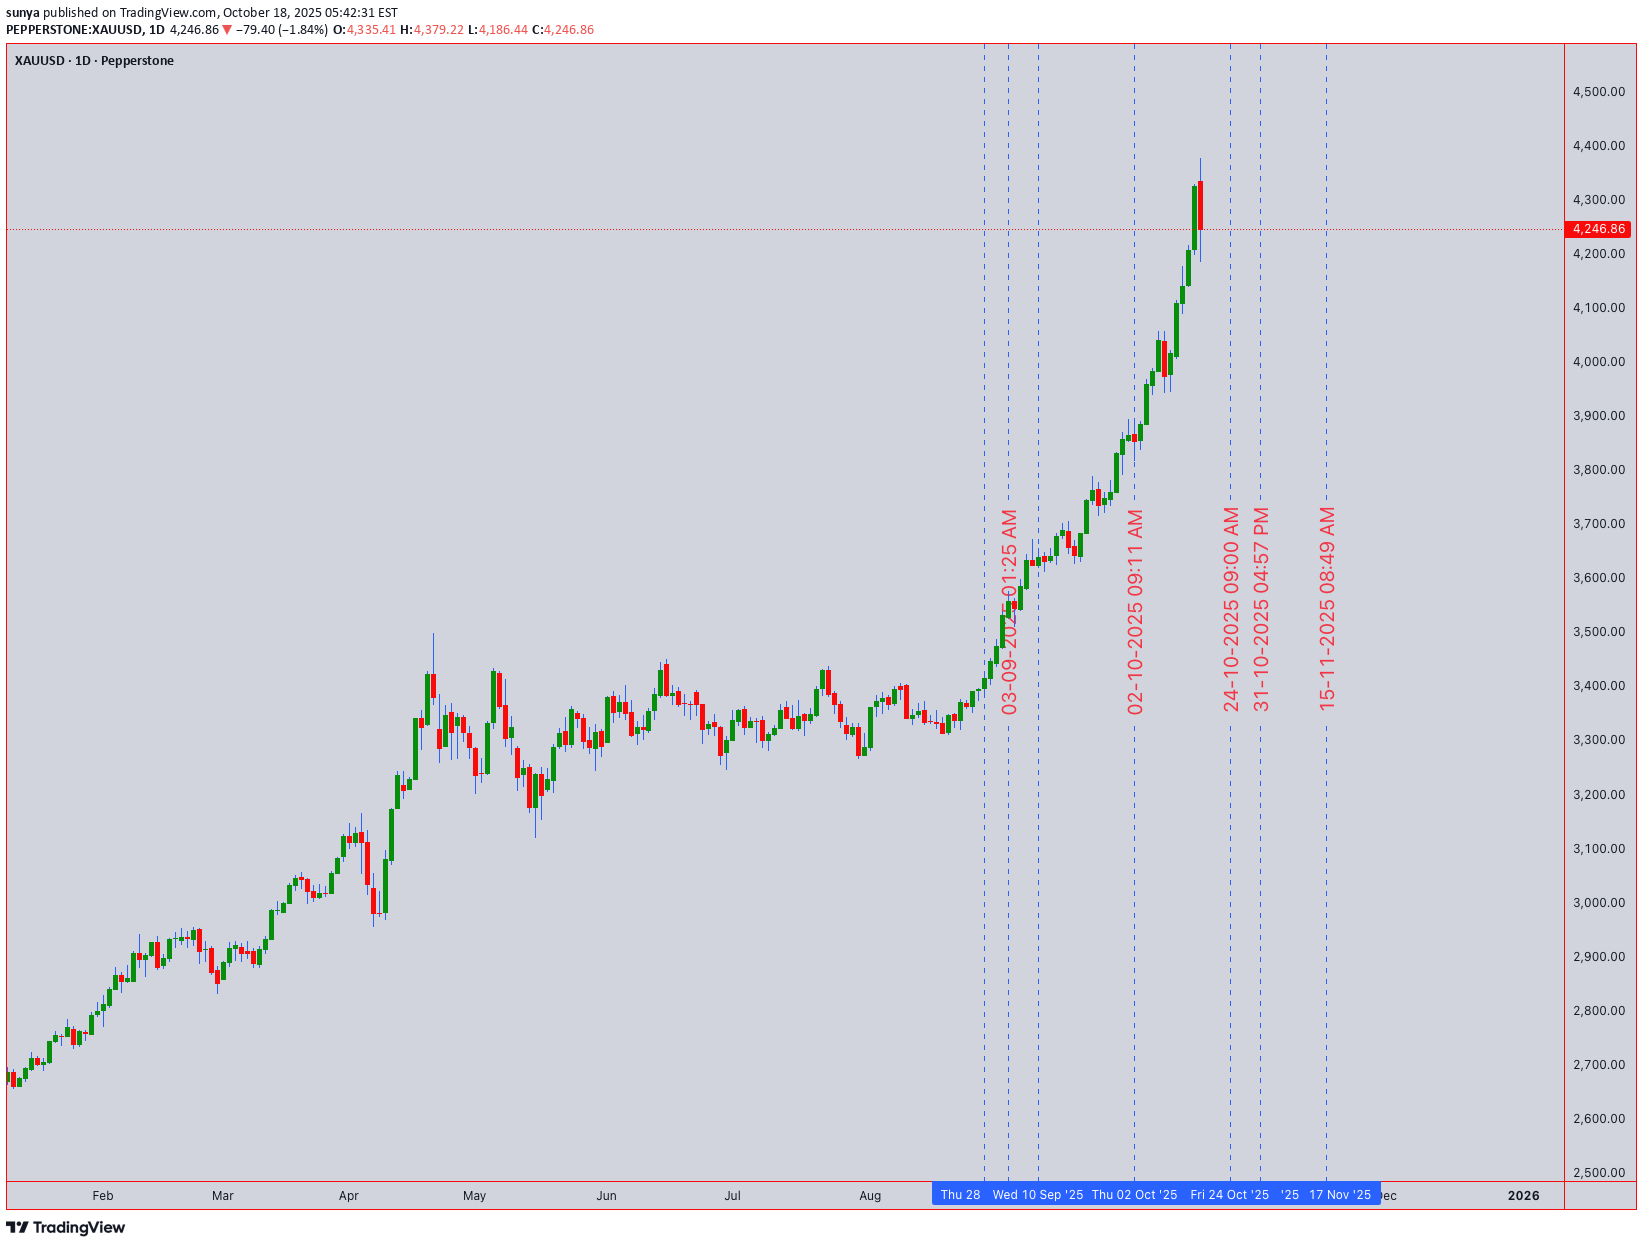
خلاصه اجرایی (فریمهای زمانی 1 بعدی و 4 ساعته): طلا در مقطع حساسی قرار دارد. نمودار روزانه نبرد بین یک فرد غالب را نشان می دهد بالای سر و شانه ها الگو و یک پتانسیل الیوت ویو 4 عقب نشینی اصلاحی خط گردن در 4,220 خط در sand است. یک شکست قاطع در زیر الگوی H&S را تایید می کند که 4150 را هدف قرار می دهد. با این حال، نمودار 4H یکپارچگی بالاتر از این سطح را نشان می دهد 200-EMA (4235) و 50% فیبوناچی اصلاحی پشتیبانی فوری را ارائه می دهد. را RSI نزولی است اما بیش از حد فروش نیست، پیشنهاد اتاق برای move در هر جهت. روند فراگیر از آخرین major پایین دست نخورده باقی می ماند تا زمانی که 4220 جای خود را بدهد. استراتژی معاملاتی نوسانی (4 ساعت/روزانه): سناریوی نزولی (در زیر 4,220 ): در یک وقفه تایید شده بفروشید و در زیر ببندید 4,220. هدف اولیه: 4,180 (H&S Measured Move). هدف نهایی: 4150. توقف ضرر: 4265 (بالاتر از نوسان اخیر). سناریوی صعودی (بالا 4,265 ): نگه داشتن بالا 4,235 (200-EMA) و شکست بالای 4265 ساختار نزولی فوری را باطل می کند و آزمایش مجدد را هدف قرار می دهد. 4300. خرید با شمع معکوس صعودی بالا 4,235. توقف ضرر: 4210 . برنامه معاملاتی روزانه (1H/30M/15M): راه اندازی کوتاه: به دنبال رد قیمت در 4255 - 4260 منطقه مقاومت (همتراز با 4H VWAP و 50-EMA) با تأیید کندل نزولی (به عنوان مثال، Bearish Engulfing). فروش ورودی: 4,255. هدف 1: 4,240. هدف 2: 4,225. توقف ضرر: 4268. راه اندازی طولانی: فقط در صورتی معتبر است که قیمت بالاتر باشد 4,235 و قدرت نشان می دهد. جهش از 4235-4240 با یک شمع صعودی (Hammer، Bullish Engulfing) فرصت طولانی را ارائه می دهد. خرید ورودی: 4,238. هدف 1: 4,255. هدف 2: 4,265. توقف ضرر: 4,225. عوامل کلیدی بازار و هشدارها: Geopolitical & Macro Watch: قدرت USD (DXY) و بازده واقعی را نظارت کنید. هر گونه تشدید تنشهای جهانی میتواند باعث ایجاد یک هجوم به پناهگاه امن شود و نزولی فنی را باطل کند. خوشه شاخص: همگرایی 200-EMA، پشتیبانی فیبوناچی و خط گردن H&S یک منطقه با احتمال بالا برای move مهم بعدی ایجاد می کند. کلام پایانی: مسیر کمترین مقاومت در زیر نزولی است 4,220. معامله گران روزانه می توانند تجمعات را به سمت کاهش دهند 4255-4260، در حالی که معامله گران نوسان در انتظار شکست قاطع هستند. همیشه ریسک را مدیریت کنید؛ نزدیک بالا 4,265 فیلمنامه را به صعودی تبدیل می کند. معامله safe را انجام دهید و عمل قیمت را دنبال کنید. برای ادامه تحلیل با کیفیت بالا لایک و فالو کنید!
sunya
تحلیل تکنیکال S&P 500: استراتژی چند زمانی برای فتح قلههای جدید (11 اکتبر)
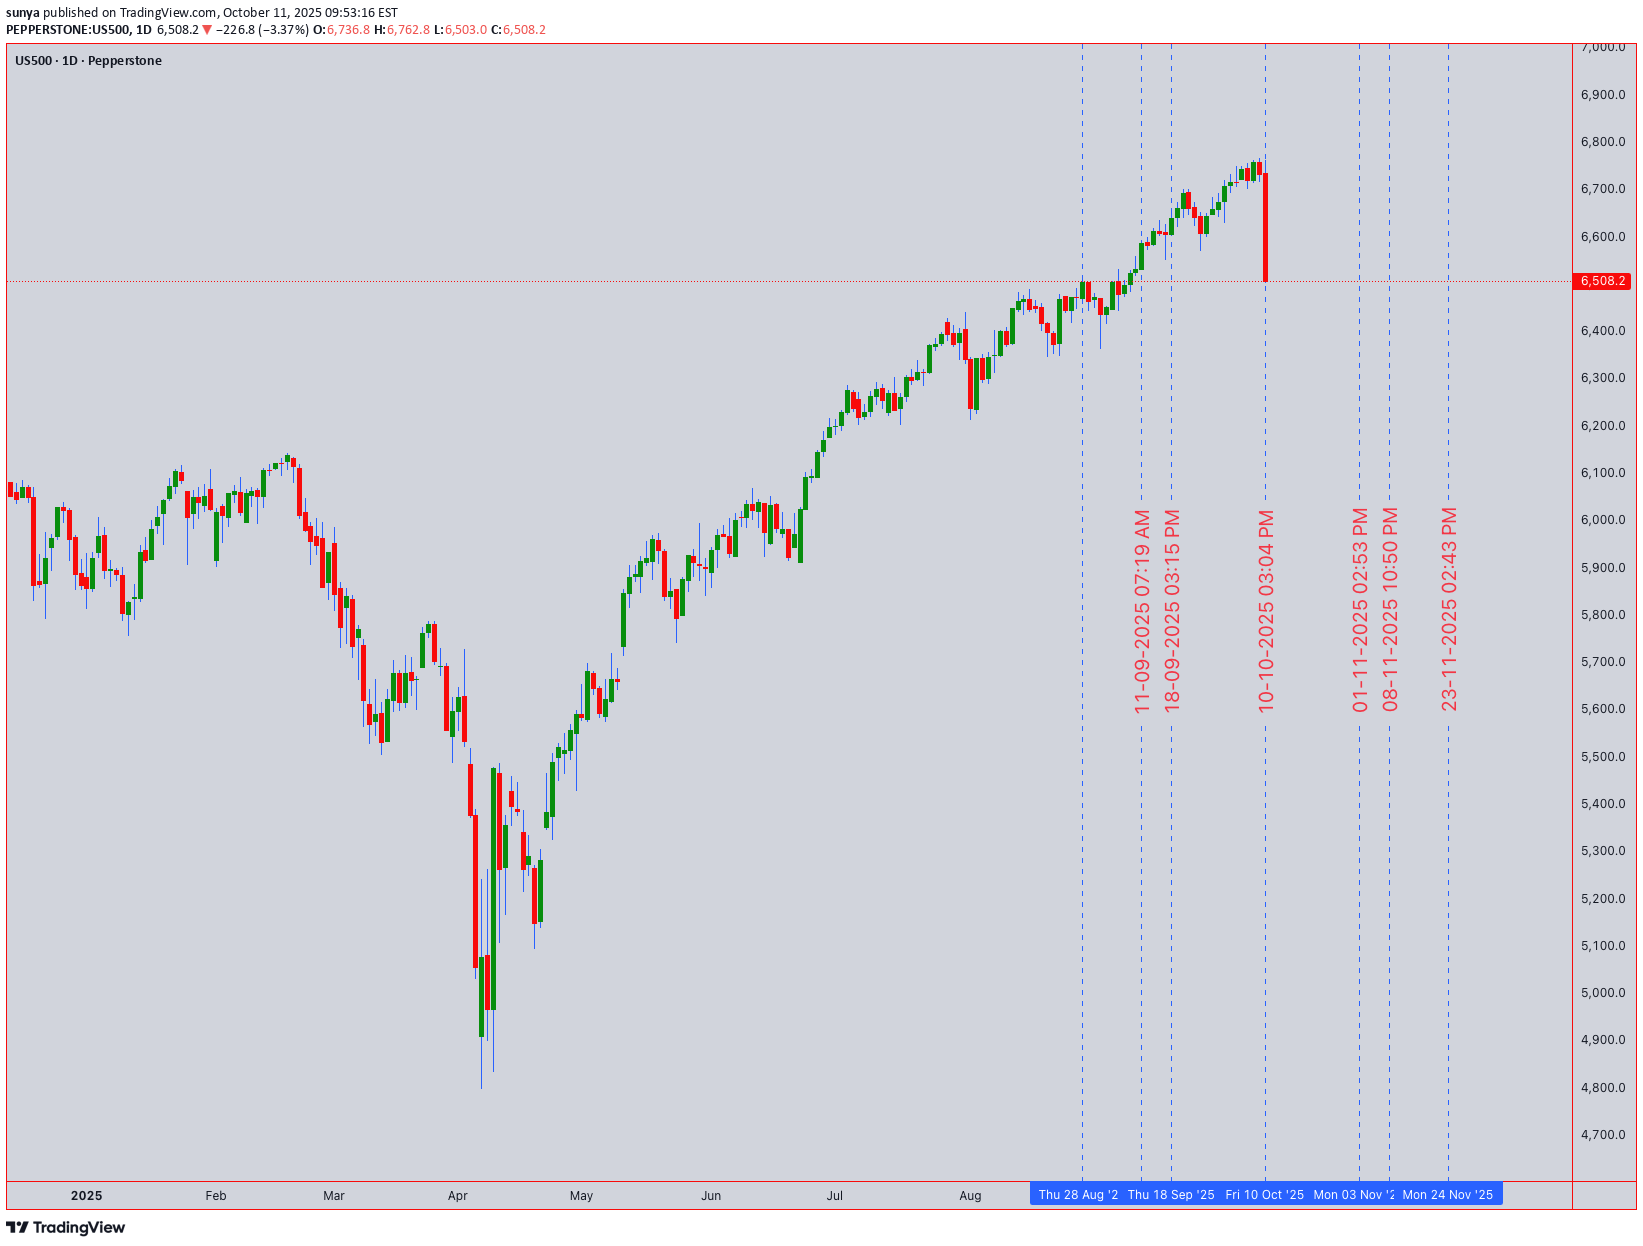
S&P 500 (US500) تجزیه و تحلیل فنی | 11 اکتبر 2025 UTC+4 استراتژی Multi-Timeframe قیمت بسته شدن: 6،508.2 | زمینه بازار: تجارت در اوج تمام وقت با تجمع نهادی مشهود است ساختار بازار S&P 500 با شکستن 6،500 مانع روانشناختی ، شتاب صعودی قوی را نشان می دهد. نمودار روزانه نشان می دهد موج ضربه ای بالغ در اصطلاحات موج الیوت (گسترش موج 5) ، با گسترش پروفایل های حجم پشتیبانی می شود. تجزیه و تحلیل Wyckoff نشان می دهد که ما در یک نشانه E مرحله E پس از انباشت مجدد موفقیت آمیز بین 5،800-6،200. Cloud Ichimoku در بازه زمانی 4H معاملات قیمت را بالاتر از همه مؤلفه ها (تراز صعودی) نشان می دهد ، با Tenkan-Sen (9 دوره) در 6،485 پشتیبانی پویا را ارائه می دهد. تجزیه و تحلیل GANN با استفاده از مربع 9 6،528 را به عنوان بعدی معرفی می کند مقاومت طبیعی سطح ، با مربع قیمت زمانی ، 15 تا 17 اکتبر را به عنوان یک منطقه محوری بالقوه نشان می دهد. نشانگرهای فنی تلاقی RSI (14): روزانه = 68 (نزدیک شدن به بیش از حد اما شدید) ، 4H = 71 (منطقه احتیاط). گروههای بولینگر: قیمت سوار شدن به بالا band در 4H (مرحله انبساط) ، که حاکی از ادامه با نوسانات بالقوه است. تجزیه و تحلیل VWAP: لنگر انداختن از اول اکتبر موقعیت قوی بالاتر از 6،465 را نشان می دهد. مشخصات حجم نشانگر پذیرش بالاتر از 6،480 با 82 ٪ تسلط صعودی صعودی است. میانگین حرکت: طلایی صلیب دست نخورده (50 EMA> 200 EMA با 340 امتیاز) ، 21 EMA در 6،470 به عنوان پشتیبانی فوری عمل می کند. تشخیص الگوی هارمونیک یک پتانسیل را نشان می دهد تکمیل پروانه نزدیک منطقه 6،550-6،580 (1.272-1.618 پسوند فیبوناچی). سطوح بحرانی و تشخیص الگوی ساختار پشتیبانی: 6،485 (تقاضای Tenkan-Sen + 4H) ، 6،465 (لنگر VWAP) ، 6،440 (محوری روزانه + زاویه 45 درجه) ، 6،400 (آزمون روانی + Wyckoff بهار). مناطق مقاومت: 6،528 (میدان گان 9) ، 6،550-6،580 (پروانه PRZ + 1.618 پسوند) ، 6،620 (مقاومت در هفته). هشدار الگوی: در صورت کاهش قیمت بالای 6،580 در کاهش حجم ، باعث ایجاد تله گاو بالقوه می شود - این باعث خستگی نشانگر می شود. ساختار شمعدانی فعلی ، پایین ترین سطح بالاتر/پایین ترین سطح بالاتر و بدون الگوی معکوس را نشان می دهد (هنوز ستاره تیراندازی یا مشروبات الکلی نزولی وجود ندارد). استراتژی معاملاتی Intraday (نمودارهای 5M-4H) مناطق خرید: ورودی اولیه: 6،485-6،495 (تلاقی پشتیبانی Ichimoku + VWAP) | از دست دادن توقف: 6،465 (خطر 20-30 امتیاز) | اهداف: T 1: 6،520 (سریع پوست سر ، 25 امتیاز) ، T 2: 6،545 (ریسک-پاداش 1: 2) ، T 3: 6،575 (پسوند نوسان). ورود ثانویه: تهاجمی طولانی در شکست بالاتر از 6،528 با تأیید حجم (حداقل 20 ٪ بالاتر از میانگین 20 دوره) | توقف: 6،510 | هدف: 6،565-6،580. فروش/مناطق کوتاه: پیشخوان فقط در صورت رد در 6،580 با واگرایی نزولی در RSI + شکل گیری ستاره تیراندازی | ورود: 6،575-6،585 | توقف: 6،595 | هدف: 6،520 ، 6،485. تعصب داخلی: 75 ٪ صعود تا زیر 6،465. استراتژی معاملات نوسان (روزانه روزانه) ساختمان موقعیت: جمع آوری در کشش ها به 6،440-6،465 منطقه (موقعیت 25-35 ٪) با 4-6 روز نگه داشتن | توقف موقعیت کامل: 6،390 (نقض کم نوسان). اهداف سود: محافظه کار: 6،580 (خروج از 50 ٪) ، تهاجمی: 6،650-6،720 (هدف ماهانه بر اساس پیش بینی موج الیوت و چرخه زمان GANN که نشان دهنده تکمیل تا 28-31 اکتبر) است. خطر مدیریت: دنباله زیر هر روزانه بالاتر است. دنباله فعلی در 6،465. اگر قیمت روزانه زیر 21 EMA بسته شود (6،470) ، قرار گرفتن در معرض 60 ٪ را کاهش دهید. تعداد موج: در حال حاضر در موج 5 از (5) از درجه بزرگتر-انتخاب پارابولیک نهایی نهایی move اما در صورت تکمیل برای تصحیح 8-12 ٪ آماده شوید (تنظیم هدف به 5،950-6،050 منطقه). زمینه بازار و ساعت کاتالیزور چشم انداز ژئوپلیتیکی تثبیت در تنش های خاورمیانه را نشان می دهد و از احساسات خطر حمایت می کند. خط مشی فدرال خنثی باقی مانده است (موقعیت نگه داشتن) ، اما نظارت بر فروش خرده فروشی 17 اکتبر data و 23 اکتبر منتشر شده PMI - Strong data می تواند ما را به 6،650 سوق دهد. ضعیف data باعث افزایش سود می شود. VIX در 13.2 (منطقه نارضایتی) ترس کم را نشان می دهد اما خطر شکاف را افزایش می دهد. تجزیه و تحلیل حجم بحرانی: کاهش حجم در اوج های جدید توزیع را تأیید می کند (فاز Wyckoff E به مرحله انتقال A)-برای حجم 25 ٪ زیر 20 روز به عنوان سیگنال هشدار دهنده. نهادی flow data نشان می دهد که ادامه خرید خالص اما سرعت کاهش می یابد. کتاب پخش اعدام دوشنبه-روز: انتظار ادغام 6،485-6،520 ؛ ایده آل برای مقیاس بندی دامنه. چهارشنبه-پنجشنبه: پنجره زمان گان نشان دهنده گسترش نوسانات است. شکستن احتمالاً جمعه: گزینه های ماهانه منقضی می شود می تواند اثر پین کردن را در نزدیکی 6،500 ایجاد کند. بهترین معاملات: طولانی در غوطه وری به 6،485-6،495 با توقف های محکم یا شکستن طولانی بالاتر از 6،528 در حجم. پرهیز کنید: تعقیب بالاتر از 6،550 بدون بازگشت ؛ کوتاه کردن زیر 6،580 بدون تأیید واژگونی روشن. ریسک بیش از 0.5-1 ٪ حساب در هر تجارت در داخل ، 2 ٪ برای موقعیت های نوسان. این بازار به حمایت و پرخاشگری در Breakouts - پاداش می دهد - این طرح را انجام می دهد ، نه احساسات.
sunya
پیشبینی طلا: رسیدن به قله تاریخی ۴۰۰۰ دلار و رمز موفقیت در این صعود انفجاری
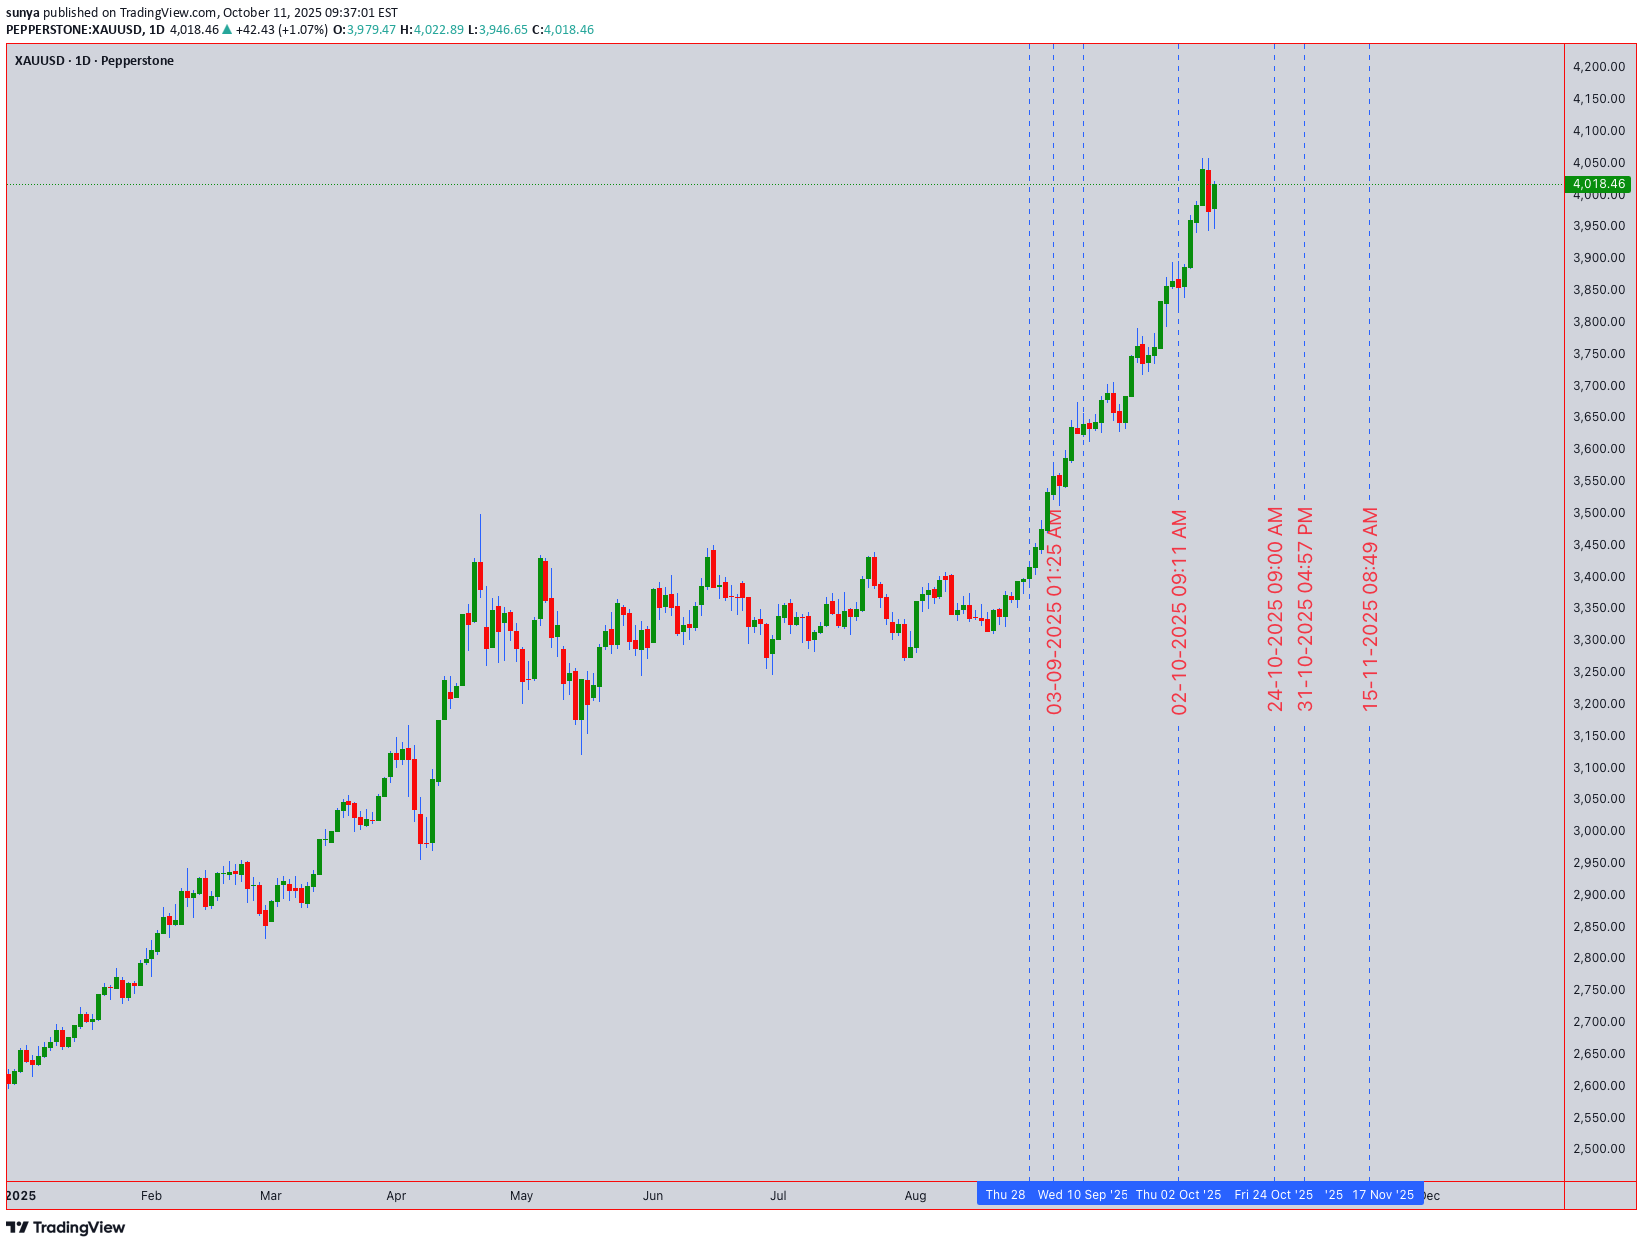
پیش بینی فنی Xauusd: طلا در 4000 دلار تاریخی+ اوج - حرکت صعودی دست نخورده دارایی: Xauusd (طلا) | قیمت بسته شدن: 4،018.46 دلار | تعصب: صعودی بالاتر از پشتیبانی کلیدی ، هدف قرار دادن اوج های جدید. یازدهم اکتبر 2025 UTC+4 1. ساختار بازار چند زمان و سطوح کلیدی مقاومت اولیه: 4،050 دلار - 4،080 دلار. این هدف فوری و منطقه مقاومت جزئی است. یک استراحت بالاتر مسیر 4،120 دلار و بعد از آن را باز می کند. پشتیبانی بحرانی: 3،980 دلار - 4000 دلار. این منطقه حامی روانی و قبلی مقاومت در برابر مقاومت بسیار مهم است. استراحت زیر تعصب را به طرف خنثی تغییر می دهد. Major پشتیبانی نوسان: 3،950 دلار (تأیید شده توسط ساختار نمودار 4H). استراحت زیر این سطح نشانگر تصحیح عمیق تر به سمت 3،920 دلار است. 2. الگوی نمودار و متن موج الیوت الگوی: طلا در نمودار روزانه در یک صعود قدرتمند و تقریباً عمودی قرار دارد و در قلمرو Uncharted بالاتر از 4000 دلار معامله می شود. این یک شکست کلاسیک حرکت محور است. شمارش موج الیوت: move از پایین ماه سپتامبر یک پسوند موج تکانشی 3 است. ما به احتمال زیاد در مراحل بعدی موج 3 هستیم ، با تصحیح موج 4 soon انتظار می رود. با این حال ، موج 3 می تواند بیشتر گسترش یابد ، بنابراین محو شدن این روند زودرس است. ریسک تله گاو نر: در مدت زمان کم. فشار خرید پایدار و پایین تر از پایین تر از قدرت برک آوت ، نه یک تله. 3. نشانگر تلاقی و حرکت Ichimoku Cloud (روزانه): قیمت در بالای Kumo (ابر) بالا می رود و نشانگر یک روند صعودی بسیار قوی است. ابر بسیار پایین تر است و یک پایه پشتیبانی قوی را ارائه می دهد. RSI (14): در نمودار روزانه ، RSI در قلمرو Overbought (> 70) است که برای حرکات حرکت قوی معمولی است. این می تواند برای دوره های طولانی بیش از حد باقی بماند. واگرایی هنوز وجود ندارد. میانگین های متحرک: 50 EMA (3،940 پوند) و 200 EMA به طرز صعودی بسیار پایین تر از قیمت فعلی هستند و تأیید روند بلند مدت را تأیید می کنند. هیچ "صلیب مرگ" در معرض دید نیست. Bollinger Bands (4H): قیمت به طور مداوم سوار باند فوقانی می شود ، نشانه ای از استحکام استثنایی. هر بازپرداخت احتمالاً پشتیبانی اولیه را در وسط band (SMA 20 دوره) پیدا می کند. برنامه معاملاتی عملی معاملات Intraday (نمودارهای 1H/15 M) تنظیم ادامه صعودی: ماشه: قیمت بالاتر از 4،005 دلار است و 4،030 دلار می شکند. ورود به خرید: با کمک هزینه 4،015-4،020 دلار به عنوان پشتیبانی یا استراحت 4،032 دلار. ضرر توقف: زیر 3،995 دلار. اهداف: 4،050 دلار (TP1) ، 4،070 دلار (TP2). تنظیمات شیب دار BULLISH: Trigger: بازگشت به منطقه پشتیبانی 3،990 دلار - 4000 دلار. خرید ورودی: در یک شمع معکوس صعودی (به عنوان مثال ، چکش ، مشروبات الکلی) در این منطقه. ضرر توقف: زیر 3،980 دلار. اهداف: 4،030 دلار (TP1) ، 4،050 دلار (TP2). معاملات نوسان (نمودارهای 4 ساعته/روزانه) ورود نوسان طولانی: شرط: روند دوست شما است. هر شیب یک فرصت بالقوه است. منطقه ورود: 3،980 دلار - 4000 دلار. ضرر توقف: زیر 3،950 دلار (در نزدیکی روزانه). هدف: 4،100 دلار+. مدیریت تجارت نوسان: سودهای جزئی را با قیمت 4،050 دلار و 4،080 دلار در نظر بگیرید ، سپس توقف خود را برای باقی مانده برای گرفتن هرگونه parabolic move دنبال کنید. نتیجه گیری و یادداشت خطر طلا در یک شکست تاریخی است. در حالی که بیش از حد ، حرکت غیرقابل انکار است. استراتژی این است که به جای تعقیب در صدر مطلق ، آب های پشتیبانی شده را خریداری کنید. سطح 3،980 دلار خط در ماسه است. استراحت زیر نشانگر اولین نشانه ضعف و پتانسیل اصلاح موج عمیق تر 4 است. تا آن زمان ، مسیر کمترین مقاومت بیشتر است.
sunya
بیت کوین در اوج تاریخی: آیا این صعود ادامه دارد یا اصلاح سنگین در راه است؟ (تحلیل کلیدی BTCUSD)
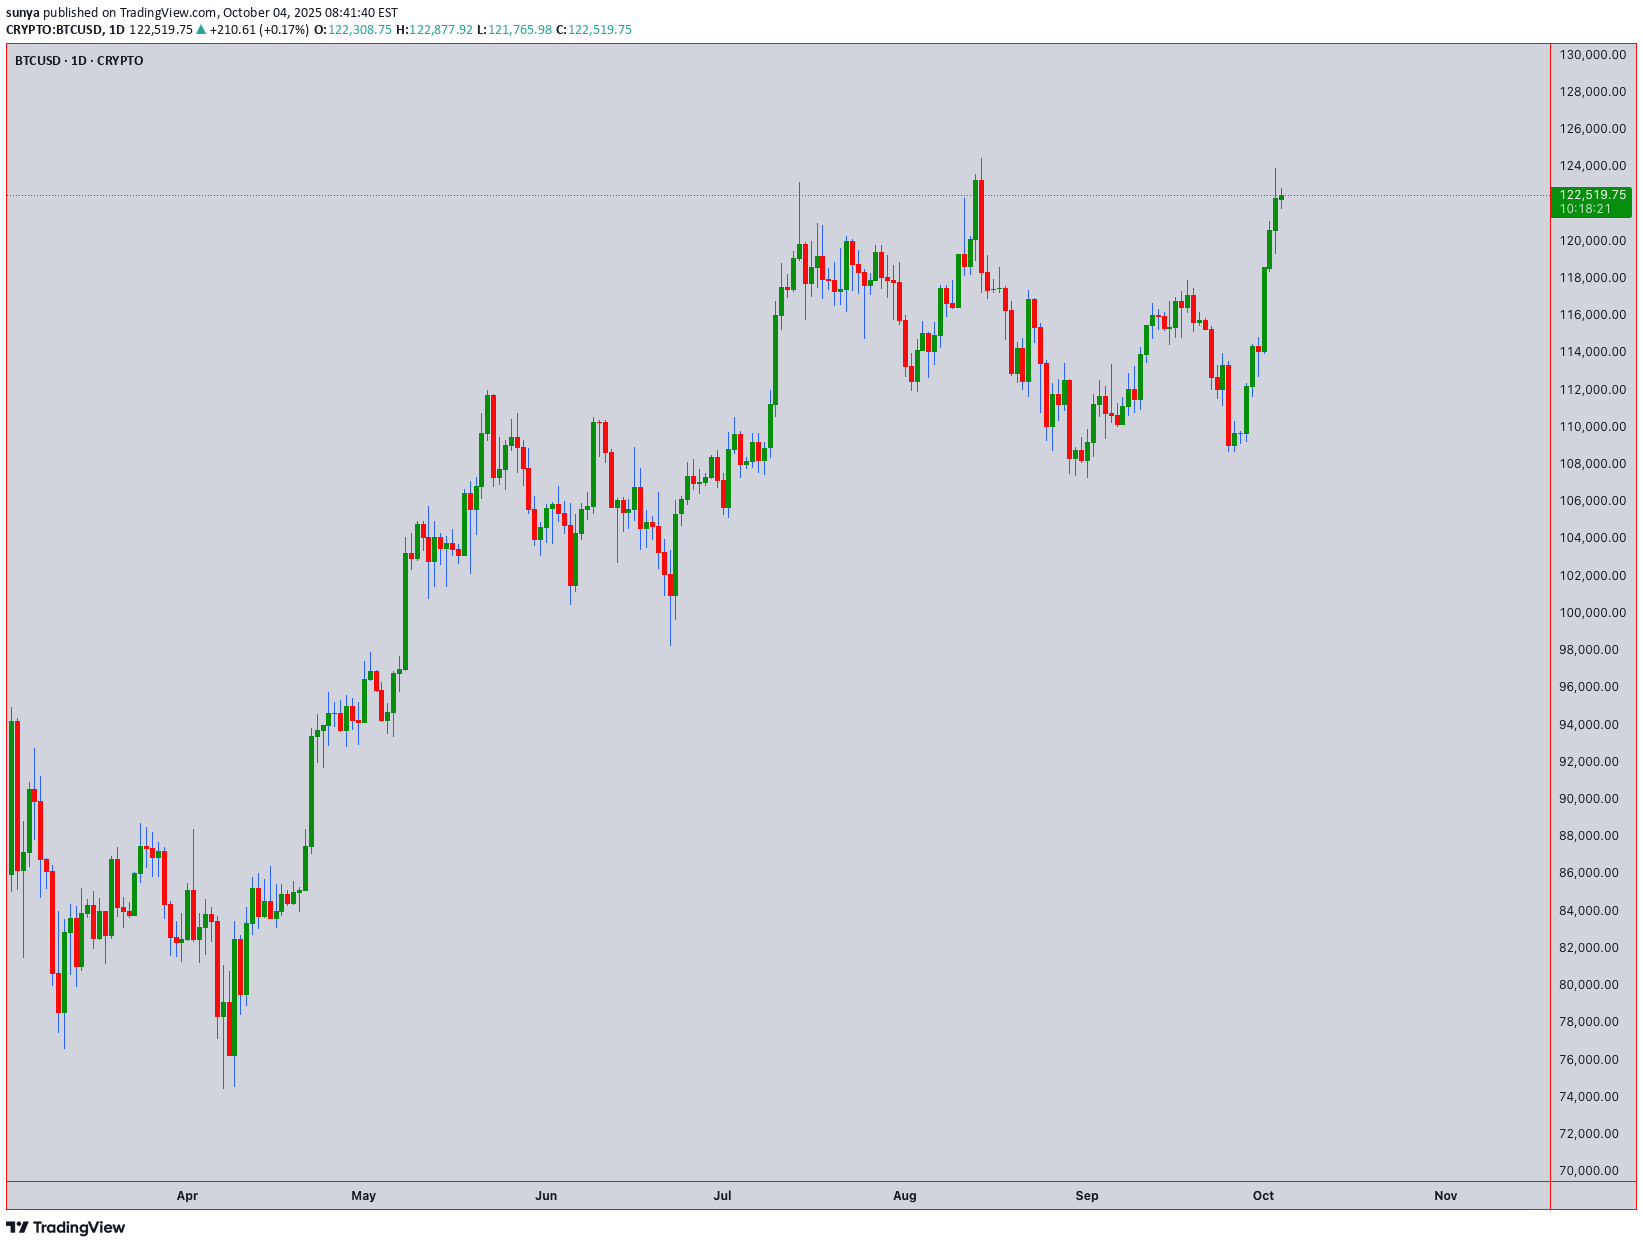
Asset: BTCUSD | Current Price: 122,491.82 | Analysis Date: [Current Date] | Timezone: UTC+4 🎯 Executive Summary & Market Context BTCUSD is trading at a formidable all-time high level near $122,500. This analysis examines whether this rally has the fuel to continue or if a significant correction is imminent. The confluence of several technical patterns and indicators suggests we are at a critical juncture. Geopolitical and macroeconomic factors, including institutional adoption and regulatory clarity, continue to provide a strong bullish undercurrent, but technical exhaustion signals are beginning to flash. 📊 Multi-Timeframe Technical Breakdown Swing Trading (4H, Daily, Weekly) - The Big Picture Primary Trend: Strongly Bullish on higher timeframes (Daily, Weekly). Key Pattern Confluence: Elliott Wave Theory: The rally from the last major swing low is best counted as a powerful Wave 3. We are now likely in a late-stage Wave 5 or a complex corrective Wave 4. A decisive break below the key support at $118,000 would signal that Wave 4 correction is underway, targeting the 0.382 Fibonacci level near $110,000. Wyckoff Theory: Analysis suggests we may be in a Re-Distribution phase. The sharp rise (Upthrust) is being tested. A failure to hold above $120,000 with decreasing volume could confirm this, leading to a Sign of Weakness (SOW). Ichimoku Cloud (Daily): The price is far above the Kumo (Cloud), indicating a strong trend but also signaling an overextended market. The Tenkan-sen (blue line) is acting as dynamic support near $119,500. A break below this would be the first sign of weakening momentum. Head and Shoulders? A potential, large-scale bearish Head and Shoulders top is tentatively forming, with the left shoulder around $115k, the head at this peak (~$123k), and a potential right shoulder to form. This pattern would only be confirmed by a break below the neckline, which would be projected around $105,000. Swing Trading Key Levels: Resistance (R1): 124,200 (Recent High) Resistance (R2): 127,500 (Psychological & Gann Angle) Support (S1): 119,500 (Ichimoku Tenkan-sen) Support (S2): 118,000 (Critical Wave 4 Invalidation) Support (S3): 110,000 (0.382 Fib & Major Swing Zone) Swing Trade Idea: Scenario A (Bullish Continuation): Wait for a pullback to the S1 ($119,500) or S2 ($118,000) support confluence with bullish reversal candlesticks (e.g., Hammer, Bullish Engulfing). Enter long with a stop loss below S2, targeting R1 and R2. Scenario B (Bearish Reversal): If price rejects R1 and breaks below S2 ($118,000) on high volume, consider a short position for a swing down towards S3 ($110,000), with a stop loss above R1. Intraday Trading (5M, 15M, 1H) - Precision Execution Intraday Bias: Neutral to Cautiously Bullish, but highly volatile. Be nimble. Key Indicators & Patterns: Anchored VWAP (from yesterday's low): The price is trading above the VWAP, indicating a Weak Bullish intraday trend. A break below the VWAP would shift the intraday bias to bearish, targeting the lower Bollinger Band. Bollinger Bands (20,2) on 1H: The price is hugging the upper band, suggesting sustained buying pressure but also overbought conditions. A move to the middle band (20 SMA) around $121,200 is a likely intraday pullback target. RSI (14) on 1H: Reading is near 65. It is not severely overbought (>70), but shows room for a minor correction before the next leg up. Candlestick Patterns: Watch for Bearish Engulfing or Evening Star patterns at the R1 resistance for short signals. Conversely, Bull Flags or Bullish Hammers near the VWAP or 20 SMA provide long entry signals. Intraday Key Levels: Resistance (R1): 123,000 (Psychological) Resistance (R2): 123,800 (Today's High) Support (S1): 121,800 (Current Session Low) Support (S2): 121,200 (1H 20 SMA / Bollinger Midline) Support (S3): 120,500 (VWAP & Strong Intraday Support) Intraday Trade Plan for the Session: Long Entry: On a bounce from S2 ($121,200) with a bullish candlestick confirmation. Target: $122,500 - $123,000. Stop Loss: 20 pips below entry. Short Entry: On a rejection at R2 ($123,800) with a bearish candlestick confirmation, or a break below the VWAP (S3). Target: S2 ($121,200). Stop Loss: 20 pips above entry or R2. ⚠️ Critical Risk Analysis: Trap Formations Bull Trap: A classic bull trap is set if the price makes a swift, low-volume spike above $124,200 (R1), luring in late bulls, before sharply reversing to close below $120,000. The Wyckoff Re-Distribution scenario aligns with this risk. Bear Trap: A bear trap occurs if the price wicks down sharply, breaking below $118,000 (S2) and triggering stop losses, only to reverse aggressively and reclaim that level, squeezing shorts and fueling the next leg up. This would invalidate the bearish Elliott Wave 4 count. 📈 Indicator Snapshot & Confluence ✅ Conclusion & Final Outlook Bullish Case: The trend is your friend. The price remains above all critical moving averages and the Ichimoku Tenkan-sen. A hold above $118,000 opens the path for a test of $127,500. Bearish Case: The market is overextended. The potential for an Elliott Wave 4 correction, a Wyckoff Re-Distribution, or a large-scale Head and Shoulders pattern presents significant downside risk towards $110,000. Trading Recommendation: For swing traders, the risk/reward favors waiting for a pullback to stronger support zones ($118k-$119.5k) before entering new long positions, or waiting for a confirmed break of support to play the short side. For intraday traders, trade the range between the key levels defined above, using the VWAP and Bollinger Bands as dynamic guides. Position sizing and strict stop-losses are non-negotiable at these elevated levels.
sunya
تحلیل جامع S&P 500: آیا بازار در آستانه ریزش است؟ (پیشبینی دقیق تا اکتبر ۲۰۲۵)
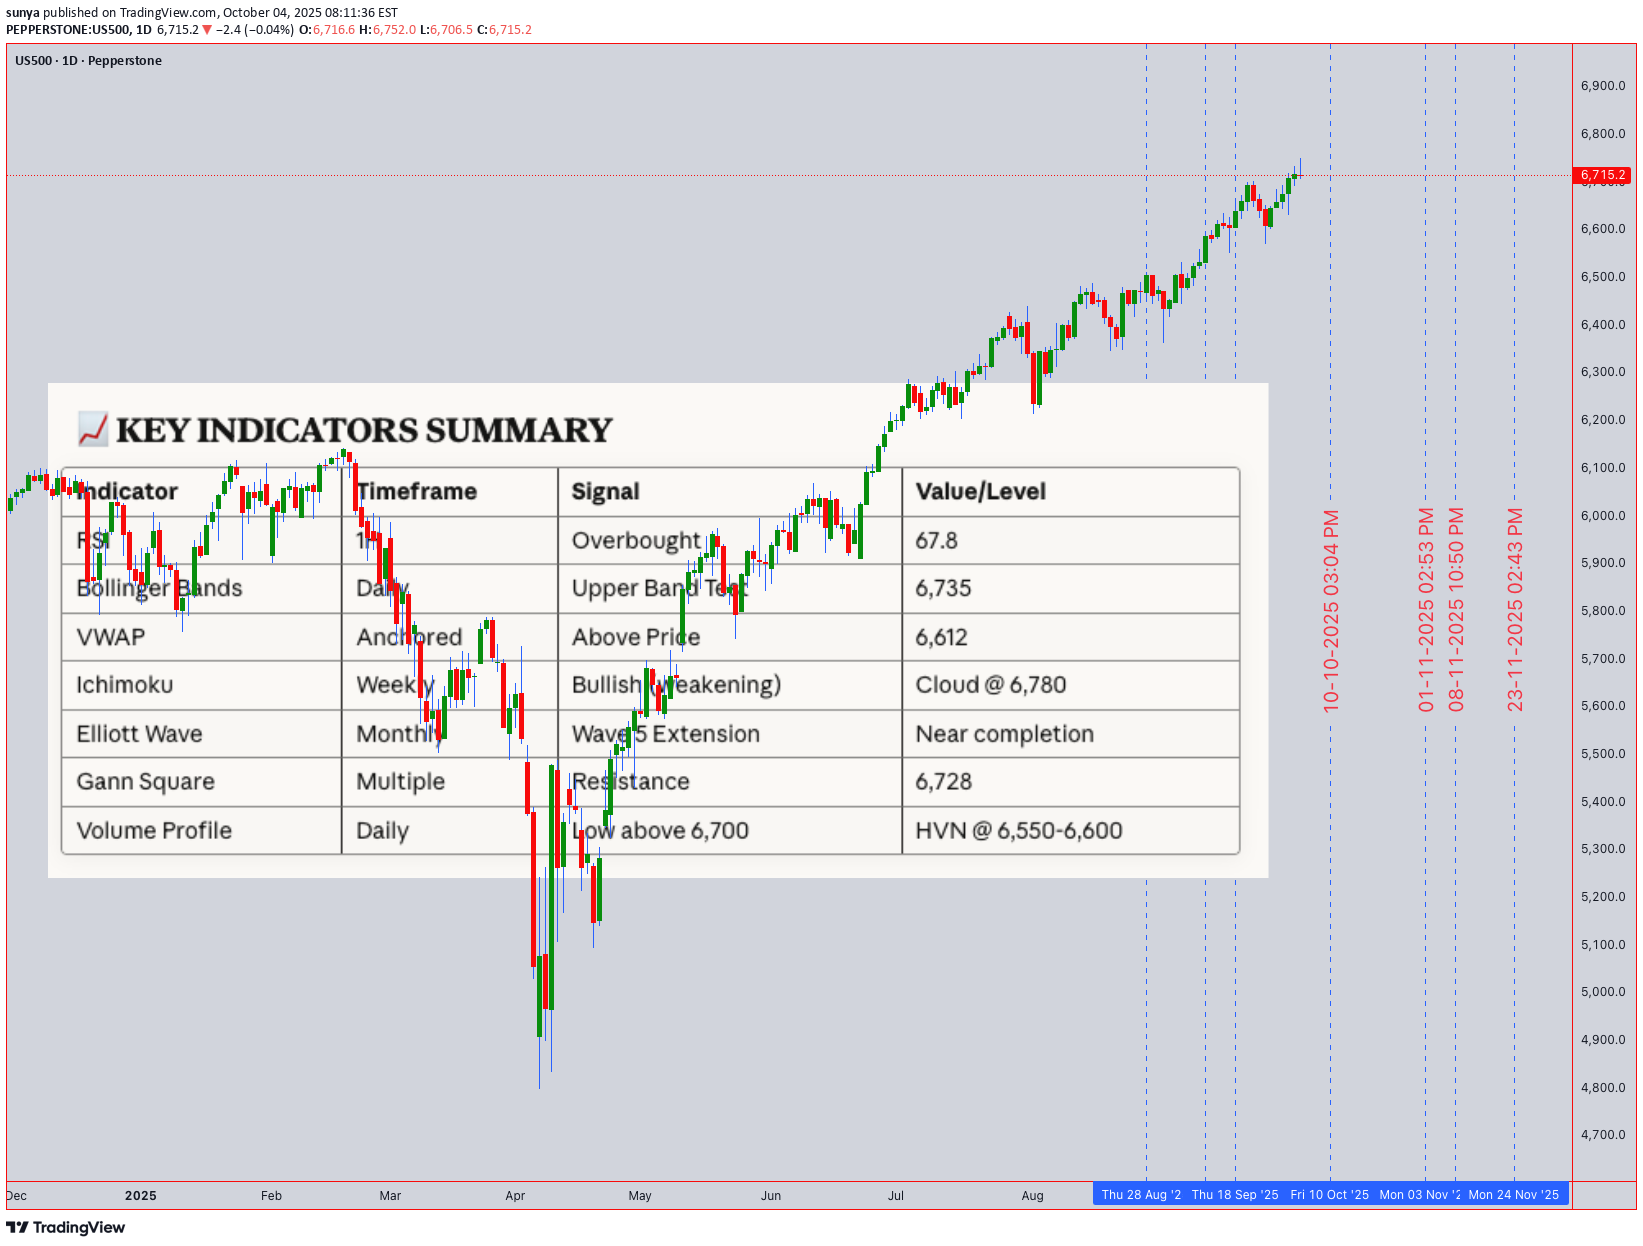
Current Price: 6,715.20 | Date: October 4, 2025 📊 MARKET OVERVIEW The S&P 500 is trading at 6,715.20, hovering near historical resistance zones. This analysis integrates multiple technical frameworks to provide actionable insights for both intraday and swing traders. 🔍 MULTI-TIMEFRAME TECHNICAL ANALYSIS Monthly & Weekly Perspective (Swing Trading) Elliott Wave Analysis: The index appears to be in a Wave 5 extension of a broader bullish impulse from the 2022 lows Monthly chart shows potential exhaustion signals as we approach the 6,750-6,800 resistance cluster Wave structure suggests a possible corrective phase (ABC) may initiate in Q4 2025 Ichimoku Cloud (Weekly): Price trading above the cloud - bullish structure intact Tenkan-sen (9): 6,682 | Kijun-sen (26): 6,591 Future Senkou Span projects resistance at 6,780-6,820 Key Support Levels (Swing): 6,620 - Kijun-sen weekly support 6,480 - 50-week EMA (critical long-term support) 6,350 - Monthly pivot & Wyckoff accumulation zone 6,180 - 200-week MA (major bull/bear line) Key Resistance Levels (Swing): 6,750 - Psychological resistance & Gann 1x1 angle 6,820 - Ichimoku cloud projection 6,945 - Fibonacci 1.618 extension from August lows Daily & 4-Hour Perspective Wyckoff Analysis: Current phase suggests late distribution (UTAD - Upthrust After Distribution) Volume declining on recent rallies - potential weakness Accumulation zone identified: 6,480-6,550 for re-entry Harmonic Patterns: Bearish Bat pattern forming on the 4H chart PRZ (Potential Reversal Zone): 6,740-6,760 Bearish divergence on RSI confirming pattern validity Bollinger Bands (Daily): Price at upper band (6,735) - overextended Band width expanding - increased volatility expected Middle band support: 6,580 Volume Analysis: VWAP (Anchored from September low): 6,612 Volume profile shows weak volume above 6,700 High volume node (HVN) at 6,550-6,600 - strong support Intraday Analysis (1H, 30M, 15M, 5M) Current Intraday Setup: RSI (Relative Strength Index): 1H RSI: 67.8 (approaching overbought) 15M RSI: 72.3 (overbought territory) Bearish divergence forming on 30M chart Moving Averages: Death Cross Warning: 50 EMA approaching 200 EMA on 4H chart 1H: 20 EMA (6,698) acting as immediate support 5M: Price oscillating around 50 EMA (6,712) Gann Analysis: Gann Square of 9: Next resistance at 6,728 (45° angle) Time cycle suggests potential reversal window: October 7-9, 2025 Price/Time square approaching - expect volatility spike Candlestick Patterns (Recent): Evening Star formation on 4H chart (bearish reversal) Long upper wicks on 1H chart - rejection at resistance Doji formation on daily - indecision 🎯 TRADING STRATEGIES INTRADAY TRADING SETUP (Next 5 Trading Days) Bearish Scenario (Higher Probability - 65%): Entry Zones: Primary Short Entry: 6,725-6,735 (upon rejection) Secondary Short Entry: 6,750-6,760 (if breakout fails - bull trap) Stop Loss: Above 6,775 (invalidation level) Profit Targets: TP1: 6,680 (20 EMA support - 1H) TP2: 6,650 (VWAP anchor) TP3: 6,620 (Kijun-sen weekly) TP4: 6,580 (Daily BB middle band) Risk-Reward Ratio: 1:3 minimum Confirmation Signals: Break below 6,700 with increased volume RSI crosses below 50 on 1H chart MACD bearish crossover on 30M Bullish Scenario (Lower Probability - 35%): Entry Zones: Long Entry: 6,680-6,690 (upon bounce from 20 EMA) Aggressive Long: 6,650-6,660 (VWAP retest) Stop Loss: Below 6,635 Profit Targets: TP1: 6,720 (resistance retest) TP2: 6,750 (psychological level) TP3: 6,780 (Ichimoku cloud resistance) Confirmation Signals: Volume surge on bounce RSI bullish divergence on 15M Break above 6,720 with strong momentum SWING TRADING SETUP (2-4 Week Outlook) Primary Strategy: SELL ON RALLY Phase 1 - Distribution (Current): Expect choppy price action between 6,680-6,750 Ideal swing short entry: 6,735-6,760 Stop loss: 6,820 Target: 6,480-6,550 (Accumulation zone) Time horizon: 2-3 weeks Phase 2 - Accumulation (Upcoming): Watch for bullish reversal patterns in 6,450-6,550 zone Potential H&S inverse or double bottom formation Long entry upon confirmation Target: 6,850-6,950 (Next impulse wave) Time horizon: 4-8 weeks ⚠️ RISK FACTORS & MARKET CONTEXT Trap Alert: Bull Trap Risk: HIGH above 6,750 Weak volume at resistance suggests false breakout potential Head and Shoulders pattern forming on 4H chart Bear Trap Risk: MODERATE below 6,650 Strong support zone with high volume profile Potential quick reversal if broken Geopolitical & Macro Factors: Fed policy uncertainty - rate decision impact expected mid-October Q3 earnings season beginning - volatility spike likely Geopolitical tensions may trigger safe-haven flows Seasonal October volatility historically present Volume Volatility Assessment: Current State: Declining volume on rallies (bearish) Expected: Volume spike at 6,750 resistance or 6,650 support Strong Trend Confirmation: Sustained volume >15% above 20-day average 🎯 TRADING PLAN SUMMARY For Next Week (Oct 4-11, 2025): Monday-Tuesday: Expect resistance at 6,725-6,735. Look for short opportunities on rejection. Wednesday-Thursday: Gann time cycle window - increased volatility. Watch for break of 6,700 or 6,750. Friday: Weekly close crucial - below 6,680 confirms bearish bias; above 6,750 invalidates short setup. Optimal Strategy: Sell rallies into 6,730-6,750 resistance Wait for confirmation - don't chase Manage risk strictly - volatile market conditions Scale into positions - don't enter full size immediately 💡 TRADER'S EDGE Pattern to Watch: The confluence of: Bearish Bat harmonic completion RSI divergence Wyckoff distribution phase Weak volume at resistance Gann time/price square Creates a HIGH-PROBABILITY SHORT SETUP at 6,735-6,760 Critical Levels This Week: Bull Control: Hold above 6,700 Bear Control: Break below 6,650 Decision Zone: 6,675-6,725 📝 DISCLAIMER This analysis is for educational purposes only. Trading involves substantial risk of loss. Always use proper risk management, never risk more than 1-2% of your capital per trade, and consider your own risk tolerance and trading plan. Past performance does not guarantee future results. Stay disciplined. Trade the plan. Manage your risk.
سلب مسئولیت
هر محتوا و مطالب مندرج در سایت و کانالهای رسمی ارتباطی سهمتو، جمعبندی نظرات و تحلیلهای شخصی و غیر تعهد آور بوده و هیچگونه توصیهای مبنی بر خرید، فروش، ورود و یا خروج از بازارهای مالی نمی باشد. همچنین کلیه اخبار و تحلیلهای مندرج در سایت و کانالها، صرفا بازنشر اطلاعات از منابع رسمی و غیر رسمی داخلی و خارجی است و بدیهی است استفاده کنندگان محتوای مذکور، مسئول پیگیری و حصول اطمینان از اصالت و درستی مطالب هستند. از این رو ضمن سلب مسئولیت اعلام میدارد مسئولیت هرنوع تصمیم گیری و اقدام و سود و زیان احتمالی در بازار سرمایه و ارز دیجیتال، با شخص معامله گر است.