
agatarigan
@t_agatarigan

تریدر چه نمادی را توصیه به خرید کرده؟
سابقه خرید
تخمین بازدهی ماه به ماه تریدر
پیام های تریدر
فیلتر
نوع پیام
The 3-Method Framework: Simplifying Technical Analysis
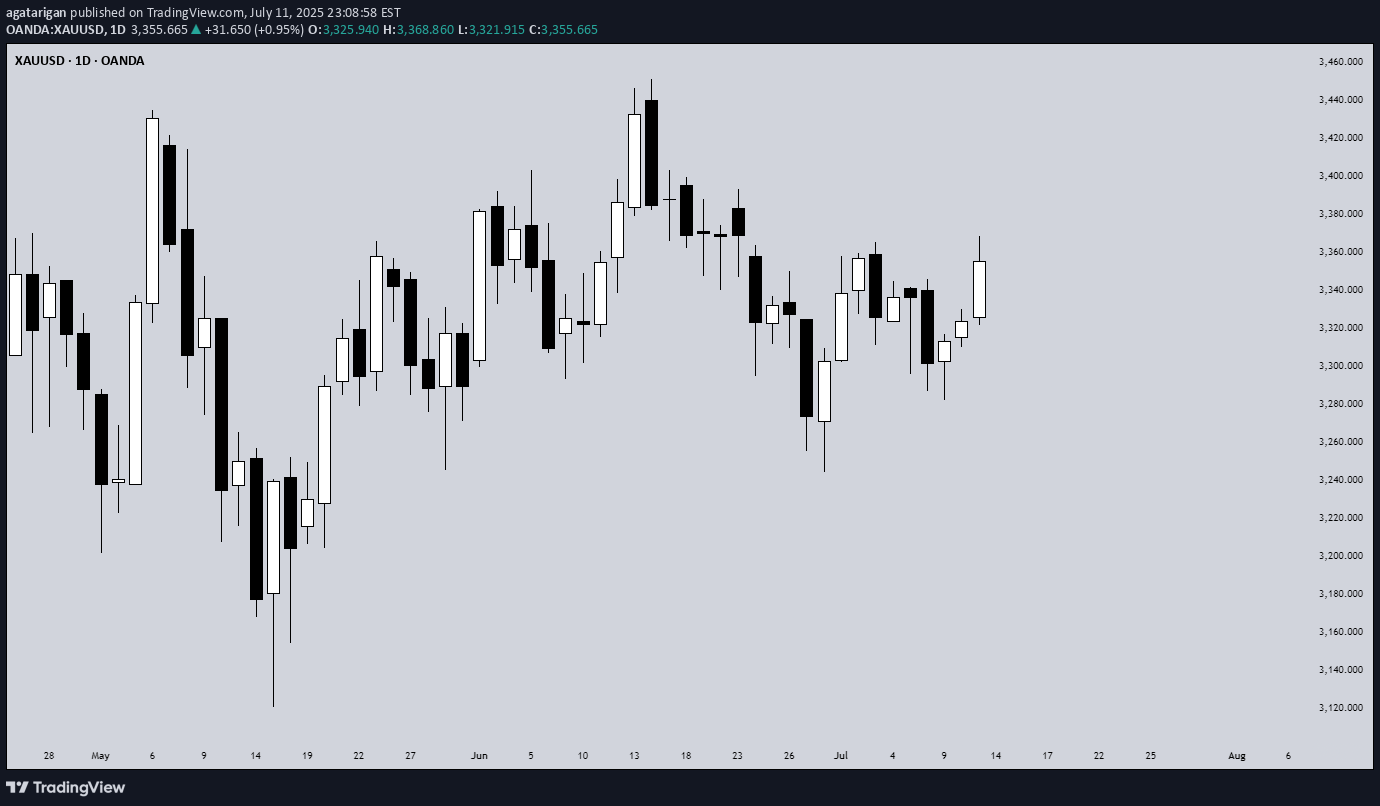
Most traders get caught up in complex indicator setups, thinking that more tools equal better results. We rely on moving averages to tell us if prices are trending up or down, and we depend on support and resistance levels to predict market movement. But what if I told you there's a simpler, more powerful way to read the market using pure price action? Today, I want to share my experience and understanding of bias and expectations for the next candle formation. This approach is refreshingly simple because we don't need to understand every single price movement - we just need to focus on what matters most. Method 1: Opening Price Comparison The first method is beautifully straightforward. For a bullish bias, the current opening price should be above the previous opening price. That's it. Sounds almost too simple, right? But simplicity often holds the greatest power in trading. For Gold yesterday, we simply needed to compare the latest opening price on the Daily timeframe with the previous opening price. It's that simple. Method 2: Mid-Level Analysis The second approach involves comparing mid-levels between candles. We compare the mid-level of the previous candle with the mid-level of the candle before that. I know it might sound a bit complicated when explained this way, but once you visualize it on your chart, the concept becomes crystal clear. Still on Gold, we just compare the 50% or mid-level of the previous candle with the candle two periods back from the latest candle on the daily chart. Method 3: Expansion Expectations The third method helps us anticipate expansion in price. Traditional complex methods require analyzing numerous factors, but this simplified approach only needs two candles before the current one. Here's how it works: we use the high and low of the candle two periods back, and the open and close (body) of the previous candle. If the previous candle's body sits within the high-low range of the two-candle-back formation, we can expect price expansion. The beauty of this method is that we don't care whether the price is bullish or bearish - we simply expect expansion to occur. Think of it like a compressed spring: when price gets squeezed within a previous range, it often seeks to break out in either direction. We're not predicting the direction, just the likelihood of significant movement. Still on Gold, I randomly selected all inside candles on the Daily timeframe. Remember, the purpose is only to expect expansion, not direction. If you want to use this for directional bias, make sure you apply the additional analysis required. Remember, there are no guarantees in trading, but this method provides valuable insight into potential market expansion. Advanced Combinations for Enhanced Analysis Combining Methods 1 and 2 creates our most accessible approach since you only need two candles. When both the opening price and mid-point from two candles ago indicate bullish conditions, we can expect the current candle to follow an OLHC bullish pattern. You can see the 3 examples I've provided in the image, and all of these are applicable across all timeframes, both daily and 4-hour. Combining all three methods offers a more sophisticated analysis, particularly useful for anticipating market reversals. This involves marking the current and previous opening prices, comparing mid-levels from the last two candles, and identifying the high/low range from two to three candles back. Now I'm adding Inside Candles from 2-3 periods back (My personal rule is maximum 3 candles before the current candle, or this analysis will lead to analysis paralysis). The Bullish and Bearish Rules Bullish Rule 1: Opening price above the previous opening price Mid-level of the previous candle above the mid-level of the previous candle before that. Inside candle formation (optional) Bearish Rule 1: Opening price below the previous opening price Mid-level of the previous candle below the mid-level of the previous candle before that. Inside candle formation (optional) The Secret Sauce: Timeframe Harmony Here's where the "devil is in the details" comes into play. You might find perfect bullish conditions on your chart, but the market still reverses. The secret lies in using this method on Daily and 4-hour timeframes simultaneously. Simply understand it from the chart. Simply understand it from the chart. If Rule 1 conditions are met on the daily chart, they must also align on the 4-hour chart. When the 4-hour contradicts the daily, follow the 4-hour signal as it might indicate a "sell on strength" or "buy on weakness" scenario. The formula is simple: [Daily Rule 1] must align with [4-Hour Rule 1] I've never tested this on 1-hour charts because the Daily and 4-hour combination provides sufficient accuracy for my trading approach. Enhanced Rules for Precision Rule 2 makes the inside candle formation mandatory rather than optional. Sometimes you'll encounter mixed signals where the mid-level suggests one direction while the opening price suggests another. The solution? Drop down to a lower timeframe for additional confirmation. I don't recommend using this method below the 4-hour timeframe, but you can certainly apply it to Monthly or Weekly charts for long-term bias determination. The key is analyzing both Daily AND 4-hour timeframes together, not just one or the other. When timeframes conflict, often just one key level provides the confirmation you need - typically a previous Monthly or Weekly high or low. Final Thoughts Pure price action mastery isn't about having the most sophisticated setup or the most indicators on your chart. It's about understanding the fundamental relationship between opening prices, mid-levels, and candle formations across meaningful timeframes. This approach has served me well because it cuts through market noise and focuses on what price is actually telling us. Start with these three methods, practice identifying the patterns, and gradually build your confidence in reading pure price action. Remember, consistent profitability comes from mastering simple, reliable methods rather than chasing complex strategies. Keep practicing, stay disciplined, and let price action guide your trading decisions. Good Luck! :)
Is It Possible to Predict Market Direction with Certainty?

شخصی از من در مورد پیش بینی حرکات بازار با اطمینان پرسید. در پاسخ به سوالی در مورد تشخیص سفارشات بزرگ و پیش بینی جهت بازار ، بیایید بررسی کنیم که چگونه بازارها واقعاً فعالیت می کنند و چگونه به عنوان یک معامله گر رشد می کنند. ماهیت حرکت بازار بازارها از طریق رفتار جمعی حرکت می کنند ، نه دستورات فردی. حتی هنگامی که شاخص های احساساتی شکاف نزدیک به 50:50 بین موقعیت های کوتاه/طولانی را نشان می دهند ، بازارها هنوز هم می توانند در یک جهت به شدت روند داشته باشند. چرا؟ زیرا حرکت بازار به این بستگی دارد: در پرخاشگری سفارشات (سفارشات بازار در مقابل سفارشات) زمان بندی اعدام تجارت اندازه موقعیت و توزیع آنها عوامل روانی بر رفتار انبوه تأثیر می گذارد مثال: تصور کردن BTCUSD با احساسات ظاهراً متعادل. با این حال ، اگر موقعیت های طولانی در درجه اول سفارشات حد منفعل باشد در حالی که شلوارک های تهاجمی در بازار با توقف های تنگ است ، قیمت با وجود نسبت "متعادل" می تواند به شدت کاهش یابد. توهم یقین هیچ راهی برای پیش بینی جهت بازار با اطمینان وجود ندارد. بازار شامل میلیون ها شرکت کننده با: روشهای مختلف تجزیه و تحلیل بازه های زمانی مختلف (پوست سر به سرمایه گذاران بلند مدت) انگیزه های متنوع (محافظت ، حدس و گمان ، سرمایه گذاری) واکنش های منحصر به فرد به همین خبر مثال در دنیای واقعی: در طی major رویدادهای خبری مانند جلسات FOMC ، اغلب می بینید که قیمت ها در هر دو جهت به شدت در حال چرخش هستند. چرا؟ زیرا حتی با همان اطلاعات ، معامله گران بر اساس آنها تفسیر و واکنش متفاوتی دارند: نیازهای نمونه کارها تحمل خطر بازه زمانی تجارت نمای کلی بازار ایجاد عادت های تجاری بهتر به جای اینکه به دنبال یقین باشید ، روی توسعه عادات تجاری خوب تمرکز کنید: 1. مدیریت ریسک اول از اندازه موقعیت مناسب استفاده کنید (هرگز بیش از 1-2 ٪ در هر تجارت خطر نکنید) توقف ها را بر اساس سطح فنی تنظیم کنید ، نه اعداد دلخواه مثال: در صورت پشتیبانی/مقاومت در برابر تجارت ، مکان فراتر از سطح قابل توجه بعدی متوقف می شود ، نه فقط در تعداد دور 2. بازده نامتقارن هدف از معامله هایی که سود بالقوه از ضرر بالقوه فراتر می رود هدف 1: 2 ریسک-پاداش حداقل مثال: در صورت خطر 100 دلار ، حداقل هدف شما باید 200 دلار سود داشته باشد 3. قوام در استراتژی - حتی وقتی استراتژی های دیگر جذاب به نظر می رسند به برنامه معاملاتی خود بپیوندید - تمام معاملات را مستند کنید و مرتباً بررسی کنید - مثال: یک ژورنال تجاری را با تنظیم ، ورود ، خروج و درسهای آموخته شده نگه دارید 4. ساختن عادت های خوب هر روز را با تجزیه و تحلیل بازار شروع کنید بررسی major اخبار و تأثیر بالقوه قبل از تجارت ، قوانین ورود/خروج را روشن کنید بررسی منظم عملکرد معاملات برنامه مثال: - 8:00 صبح: نمای کلی بازار - 8:30 صبح: تنظیمات بالقوه را مرور کنید - 9:00 صبح: رویدادهای خبری را بررسی کنید -4:00 بعد از ظهر: بررسی پایان روز مشکلات رایج برای جلوگیری از 1. تعویض استراتژی ها به طور مکرر بر اساس عملکرد اخیر دنبال چندین معامله گر با رویکردهای مختلف راه حل: حداقل 3 ماه به یک رویکرد متعهد شوید 2. غلبه بر گرفتن معاملات از کسالت یا FOMO راه حل: محدودیت های تجاری روزانه/هفتگی را تعیین کنید 3. تجارت انتقام جویی تلاش برای بازیابی سریع ضررها راه حل: بعد از ضرر استراحت کنید ، بررسی کنید که چه اشتباهی رخ داده است به یاد داشته باشید: بازار به آنچه می اهمیت نمی دهد. این امر بر اساس اقدام جمعی حرکت می کند ، نه خواسته های فردی. به جای تلاش برای پیش بینی آنها ، روی سازگاری با شرایط بازار تمرکز کنید. موفقیت شما در تجارت با توجه به میزان شما تعیین نمی شود ، اما با توجه به اینکه آنچه را که می دانید از طریق عادت های مداوم و منظم استفاده می کنید.
Awal Terjunnya Harga Emas atau Awal ATH Baru?

تحلیل قبلی من بیان کرد که برآورد من روی قیمت بود XAUUSD افزایش به نزدیکترین هدف در 2426530، سپس به قدیمی High است که اکنون توسط قیمت شکسته شده و به یک high جدید یا ATH جدید در قیمت طلا تبدیل شده است. این بار، طلا همان طور که توسط +FVG ثابت شده است، مقاومت قیمتی بسیار قوی ارائه کرده است که از نظر قیمت رعایت نمی شود و آن را IFVG می کند. این نیز بین 16 تا 23 مه 2024 اتفاق افتاد. انتظار من این است که اگر پرسیده شود "قیمت کجا رفت؟"، پاسخ من در نزدیکترین هدف باشد. پس از آن، اگر آرایه Premium در برابر قیمت مقاومت کند و قیمت به پایین ترین حد خود برسد، به احتمال زیاد نزدیک ترین نقدینگی سمت فروش، هدف قیمت بعدی بود. هدف نهایی من در این تحلیل، نقدینگی سمت فروش است که در پایین نمودار قرار دارد. اگر بازه زمانی ماهانه را باز کنید، نقدینگی سمت فروش از FVG پایین است که احتمالاً به عنوان سطح ورودی برای موسسات مالی بینالمللی استفاده میشود. از نظر موسسات مالی بین المللی، که یکی از آنها Credit Agricole است، همچنان همان چیزی است که در ایده قبلی گفتم، طلا همچنان مورد علاقه است زیرا فارکس طبق گفته آنها خوب عمل نمی کند (زمان نگهداری آنها ممکن است باشد. بیش از 1 ماه به دلیل وجوهی که دارند تا میلیون ها دلار). نتیجه در این تحلیل انتظار کاهش قیمت است XAUUSD تا هدف اول در 2380 (50 درصد محدوده). برای کاهش بیشتر، من هنوز منتظر هستم تا data در چند روز آینده ظاهر شود. با تشکر از شما برای خواندن ایده هایی که من منتشر کردم، اگر ada سؤالی دارید، لطفاً مستقیماً در نظرات بپرسید و امیدوارم این اطلاعات بتواند برای شما مفید باشد. 😁 تجارت مبارک و موفق باشید!
سلب مسئولیت
هر محتوا و مطالب مندرج در سایت و کانالهای رسمی ارتباطی سهمتو، جمعبندی نظرات و تحلیلهای شخصی و غیر تعهد آور بوده و هیچگونه توصیهای مبنی بر خرید، فروش، ورود و یا خروج از بازارهای مالی نمی باشد. همچنین کلیه اخبار و تحلیلهای مندرج در سایت و کانالها، صرفا بازنشر اطلاعات از منابع رسمی و غیر رسمی داخلی و خارجی است و بدیهی است استفاده کنندگان محتوای مذکور، مسئول پیگیری و حصول اطمینان از اصالت و درستی مطالب هستند. از این رو ضمن سلب مسئولیت اعلام میدارد مسئولیت هرنوع تصمیم گیری و اقدام و سود و زیان احتمالی در بازار سرمایه و ارز دیجیتال، با شخص معامله گر است.