
M_Dehghani
@t_M_Dehghani

تریدر چه نمادی را توصیه به خرید کرده؟
سابقه خرید
تخمین بازدهی ماه به ماه تریدر
پیام های تریدر
فیلتر
نوع سیگنال
M_Dehghani

ردپاهای موسسات یا نهنگ ها در این دو زمینه از جمله بازار مردم/USDT پدید آمده است. از دیدگاه قیمت ، اگر شاهد واژگونی قیمت باشیم ، می توانیم از یک واکنش و پاسخ عالی در منطقه 1 ، به ویژه برای افراد/USDT انتظار داشته باشیم. یکی از عوامل مهم در این زمینه VRVP است که دقیقاً در بلوک سفارش 1 قرار دارد.
M_Dehghani

"بسیار خوب، امروز می توانیم به دنبال معامله ای برای فروش در مناطق مورد نظر برای جفت ارز btcusdt باشیم. می توانیم این معاملات را در دو مرحله در نظر بگیریم که تا نقدینگی مورد نظر قابل پیگیری است. هر دوی این معاملات با 1 به سودآور هستند. نسبت 3 در بدترین شرایط که می توان آن را یک معامله موفق تلقی کرد، این معاملات بر اساس اصول تئوری wyckoff بازگشتی در نقاط ورودی و روش پول هوشمند است.
M_Dehghani
همانطور که در تصویر می بینید، قیمت در سطحی است که انتظار می رود در ابر نفوذ کند و به طور بالقوه به لبه پایین ابر پایین بیاید. لازم به ذکر است که این نمودار روزانه است و روند کلی بازار برای من نزولی به نظر می رسد. دیدن قیمت 24000 دلار دور از دسترس نیست.
M_Dehghani

به نظر من، ما در حال حاضر در یک منطقه امن از نظر کاهش قیمت، در منطقه بلوک سفارش هستیم. علیرغم تغییر اخیر الگوی wyckoff، هنوز هم پتانسیل بالایی برای افزایش قیمت تا سطوح تعریف شده در تصویر وجود دارد.
M_Dehghani

همانطور که در تصویر می بینید، این ارز هم اکنون در ناحیه بلوک سفارش قرار دارد و با تایید روش wyckoff، شانس بالایی برای افزایش قیمت به دو سطح نقدینگی بالای آن دارد.
M_Dehghani

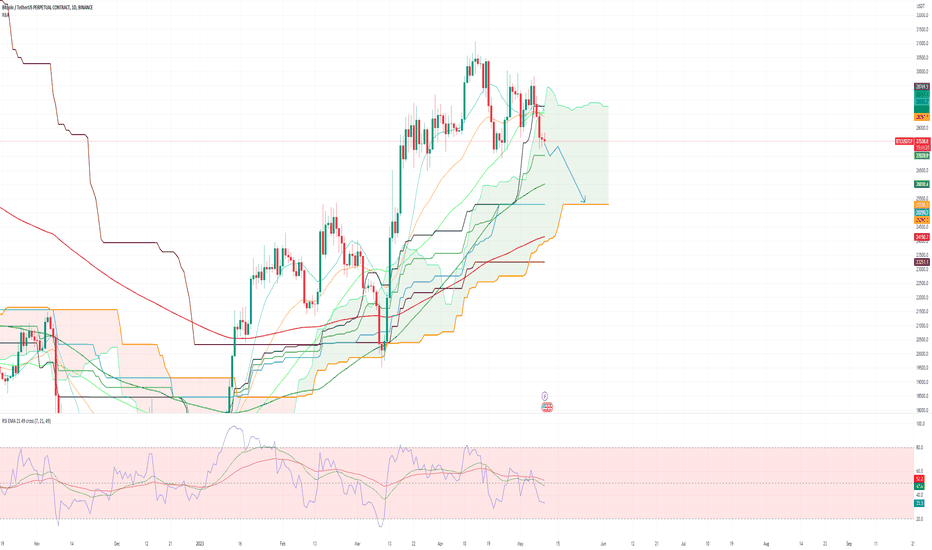
به نظر می رسد در بازه زمانی هفتگی به دنبال فرصت خرید هستیم. اما به نظر من اگر از من بپرسید ممکن است از این نقطه بازار بالاتر نرود و باید با قیمت های پایین تری خرید کنیم. همانطور که در تصویر مشخص است، در بازه زمانی روزانه شاهد روند نزولی این ارز هستیم و با تشکیل موج نزولی و برخورد به محدوده 29789، انتظار داریم به محدوده نقدینگی 29616 برسد. این تحلیل به مرور زمان به روز می شود.
سلب مسئولیت
هر محتوا و مطالب مندرج در سایت و کانالهای رسمی ارتباطی سهمتو، جمعبندی نظرات و تحلیلهای شخصی و غیر تعهد آور بوده و هیچگونه توصیهای مبنی بر خرید، فروش، ورود و یا خروج از بازار بورس و ارز دیجیتال نمی باشد. همچنین کلیه اخبار و تحلیلهای مندرج در سایت و کانالها، صرفا بازنشر اطلاعات از منابع رسمی و غیر رسمی داخلی و خارجی است و بدیهی است استفاده کنندگان محتوای مذکور، مسئول پیگیری و حصول اطمینان از اصالت و درستی مطالب هستند. از این رو ضمن سلب مسئولیت اعلام میدارد مسئولیت هرنوع تصمیم گیری و اقدام و سود و زیان احتمالی در بازار سرمایه و ارز دیجیتال، با شخص معامله گر است.