
شستا
سرمایه گذاری تامین اجتماعی
| تریدر | نوع سیگنال | حد سود/ضرر | زمان انتشار | مشاهده پیام |
|---|---|---|---|---|
radmanesh.coRank: 180 نیاز به اشتراک | خرید | حد سود: تعیین نشده حد ضرر: تعیین نشده نیاز به اشتراک | 9/5/2025 | نیاز به اشتراک |
 محمدرضا موسویRank: 271 نیاز به اشتراک | خرید | حد سود: تعیین نشده حد ضرر: تعیین نشده نیاز به اشتراک | 9/2/2025 | نیاز به اشتراک |
 وارن بافتRank: 194 نیاز به اشتراک | خرید | حد سود: ۱٬۷۵۸ حد ضرر: تعیین نشده نیاز به اشتراک | 8/26/2025 | نیاز به اشتراک |
 BourseMag|مجله بورسRank: 416 | خرید | حد سود: تعیین نشده حد ضرر: تعیین نشده | 7/19/2025 | |
 کارگزاری تدبیرگران فرداRank: 303 | خرید | حد سود: تعیین نشده حد ضرر: تعیین نشده | 7/12/2025 |
Adjusted Price Chart of شستا and شستا Signal Trend
سود 3 Months :
Who made the most profit from شستا?

آپ ترند بورس
وارن بافت
ializ93

تحلیل نامه بورس
محمدرضا موسوی
سیگنالهای شستا
Filter
Signal Type
Trader Type
Time Frame
نوع پیام

تحلیل ناب 🏁🎯🔎
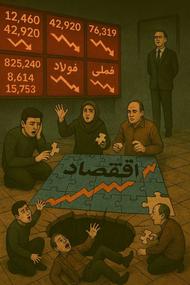
- Picture of the Stock Exchange: Dark well on the stock exchange, With symbols such as Shasha, Steel, Family. Investors in the falling, While stock exchanges blink with misleading numbers. An indifferent observer with closed eyes stands in distant.

تحلیل ناب 🏁🎯🔎
The very important question and answer requires legal accuracy and transparency. Let me explain very explicitly: --- ⚠️ Can a particular person or entity be definitively attributed to the price manipulation of a particular symbol? In the formal and legal environment of the Iranian capital market, no institution or person has been publicly convicted of price manipulation unless proven and public information has been proven (such as some brokerage or funds). But in the analytical and empirical environment, there is evidence that some legal entities, quasi -government, or even specific market players have a role in suspicious behaviors. --- Why don't some symbols grow natural? The main reasons are: 1. 🔒 Control of the total index Symbols like steel, family, Shasta, Fars have high weight in the index. The sudden growth of these can be: - Give the wrong signal to the market - to stimulate inflationary expectations - Create media and political pressure Therefore, indexing institutions prefer these symbols to fluctuate within the controlled range. --- 2. 💰 Financing of government or specific institutions Some symbols belong to state -owned or quasi -state companies. Their over -growing growth is possible: - to increase financial obligations - Or, on the contrary, their price drop will reduce the value of bank collateral As a result, the price of these symbols is controlled by financial and political considerations rather than real demand. --- 1. 🧠 Preventing a cash out of parallel markets If the stock market becomes attractive, capital will be out of markets like gold, currency, car and housing. This is: - Makes inflation control harder - Balance of parallel markets > Therefore, stock market growth must be limited and controlled so that parallel markets do not fall. --- 1. 🕳️ Lack of independent and transparent supervision Stock Exchange and Supervisory Institutions, in some cases: - Delay, enter suspicious transactions - Or they don't enter at all because they are the parties to the powerful institutions As a result, price manipulation is done in some symbols without accountability. --- 🧠 Summary If you name a particular symbol, I can check for you: - Is that suspicious price behavior? - What institutions are active in their transactions? - And what can make it limited? But the direct attribution of manipulation to a particular person or entity requires a formal and legal document - which is not usually published in the public space. However, analysis of trading behavior, volume, and type of orders can give very clear clues.
تحلیل ناب 🏁🎯🔎
According to official and analytical reports, the examination of suspicious algorithmic behavior in the Schwet and Steel symbols shows that the two symbols have been listed in recent weeks and have been found to be algorithmical manipulation. --- 🔍 Shasta: suspicious behavior with abnormal volumes According to the Voice of the Exchange on September 1: - Shasta's symbol is one of the symbols with a suspicious volume of transactions. - The volume of sales is diverted from the normal market trend, which is a sign of volume or oscillating algorithms. - This behavior is usually aimed at deceiving small investors and creating an artificial process. --- 🔍 steel: suspicious transactions with impact on the overall index In the target portfolio report on January 1: - The steel symbol with the family and Shasta has the most positive impact on the overall index. - But besides it, the volume of steel transactions was 2 to 5 times the monthly average, which is a sign of algorithmic manipulation in volume and price. - This abnormal volume is commonly used by trading robots to direct the total index and NAVs of funds. --- 🧠 Final conclusion Both School and Steel symbols have behaviors in recent weeks that are in line with well -known algorithmic manipulation patterns: | Symbol | Suspension Symptoms | Possible algorithm type | ------ | ---------------- | ------------------- | | Shasta | Unusual volume, artificial queue SPOOFING, Volumetrary | | Steel | Repeated Trading, Artificial Impact on Index | Elings, Index makers
تحلیل ناب 🏁🎯🔎
According to the technical diagrams of steel and Shasta symbols of valid sources, these two symbols have behaviors in recent weeks that are in line with algorithmic manipulation patterns. Let's go to the analysis of each: --- 📉 Steel (Isfahan Mobarak Steel) Based on chartix data: - 90 -day drop: about 41.8 % reduction in price. - 7 days growth: about 12.3 % increase, which can be a sign of oscillation. - Daily trading volume: More than 627 million shares, which is very high and enhances the likelihood of using volume algorithms. - distance to the historical ceiling: About 43.57 %, which means it is still in the correction phase. Suspicious Behavior: Severe fluctuations in short -term, high volume, and rapid price return show that oscillating and indexing algorithms are probably active in this symbol. --- 📊 شستا (شرکت سرمایهگذاری تأمین اجتماعی) Based on chart data: - Shasta's chart in recent weeks shows artificial sales pressure and fabricated queues. - Price behavior in daily timing is associated with abnormal candlesticks and unbalanced volumes. - On some days, heavy orders are registered in the sales queue, but immediately deleted, which is a sign of SpoFing algorithms. 📌 Suspicious behavior: Formal ordering, artificial fluctuations, and pricing trend distorting with the aim of deceiving micro investors. --- 🧠 Summary | Symbol | Type of suspicious algorithm Symptoms | | ------ | --------------------- ----------- | Steel | Eligger, volume maker High volume, severe fluctuation, fast return | | Shasta | SPOOFING, queuing Formal Orders, Artificial Sales Pressure
تحلیل ناب 🏁🎯🔎
I came up with artificial intelligence questions about price manipulation and the impact of symbols on the value of other assets of symbols. I asked about the value of the asset and the effect of leverage assets ... --- 🔍 Solidarity of "lever" with stock exchanges symbols According to the recent technical and fundamental analysis, the following three symbols have the most impact on the price trend and the NAV of the leverage fund: --- 📈 Why are these symbols important? - Steel: Because the lever in the basket weighs high weight and its fluctuations affect the NAV. The analysis shows that the technical support of steel is being tested and their failure can put more sales pressure. - Shasta: Due to the pressure of artificial sales and price correction, it reduces NAVs such as leverage. Because Shasta is in the fund's portfolio, every drop directly affects the value of the fund's assets. - Shapna: Due to price drop and loss of support, it has a moderate negative impact on the nav leverage. Of course, since the weight of the shapna in the basket is less than the steel and Shasta, its effect is limited. --- 📊 NAV Funds Fund Recent charts show that the NAV of the leverage fund last week was about 2 % of the three -month drop and is still in the correction area. This decline was mainly due to the decline in the price of steel, Shasta and Shapna symbols. ------ 🔍 Technical and Famous Fundamental Analysis According to the latest reports: - In the weekly time: Family has been involved in important resistances such as Kijun Senc and the Cumo Cloud ceiling after failing the downtrend line. This means that if it can be stabilized, there is a good chance of growing. - In the daily timing: It is close to the support of the uptrend and breaks dynamic resistances like SSL. This indicator is the possibility of a positive return in the short term. - From a fundamental point of view: depending on the global price of the laxative, so the global metal market fluctuations directly affect its performance. --- 📊 Famous impact on lever fund Based on the combination of the Charisma-Marram Fund assets: - Famil is one of the most weighty symbols in the chair basket. - Any fluctuation in the price of the family, especially in descending conditions, can reduce the NAV of the fund. - In recent weeks, with a relative drop in the price of the family, the lever fund has had about a three -month drop in NAV. --- 🧠 Conclusion Famly acts like a thermometer for lever boxes. If the ascending trend is stabilized, it can lead to the growth of the lever NAV. But if it entered the correction phase again, the negative pressure on the NAV would continue.
تحلیل ناب 🏁🎯🔎
--- 📦 Composition of Charisma lever assets - September 1 | Type of assets | Mill (million rials) Percentage of total assets | ---------------------- -------------------- ------------------------ | Top five shares 34,332,361 | 21.49 % | | Other stocks 109,180,763 | 68.36 % | | Partnerships | 2,167,505 | 1.36 % | | Review and Bank 651,591 | 0.41 % | | Other assets 5,421,786 | 3.39 % | | Investment Fund | 0 | 0 % | > Total asset value: about 151,753 billion rials --- 🔟 Five shares with the highest weight in the portfolio Although the detailed details of the top five shares are not mentioned in this report, But according to past trends, Probably include symbols such as Female, Steel, Shasta, Rampena, and Ghadir, which are usually at the top of the portfolio. --- 📊 Significant points - High focus on the stock market (about 90 %) indicates high risk of funds and suitable for mid -term and long -term investors - Decrease in liquidity share (only 0.41 %) means that the fund is currently brought into the market for almost all capital - Increasing the share of partnerships compared to previous months, a sign of effort to control risk in market fluctuations ---
تحلیل ناب 🏁🎯🔎
📈 Technical analysis of up -to -date shasta 🔹 Current Status: - Final Price: About 1 Toman - Recent Trading Ceiling: 1 Toman - Key resistance: 1 Toman (static and psychological resistance) - Trading volume: High and with the entry of legal - Recent Kandels: Showing Press Pressure at higher levels 🔹 Resistance Failure scenario ۱۰۰۰: If Shasta could pass through high volume and confirmation, the following goals were as follows: | Technical purpose | Price level | Explanation | | -------------- | ---------- | -------- | | The first goal | 1 Toman | Fibonacci resistance and previous ceiling | The second goal | 1 Toman | Historical ceiling and heavy resistance | Third goal | ۱۵۰۰۰ Toman | In the event of positive news and growth of the overall index ✅ Crossing 2 with consolidation can activate a new wave of liquidity entry. --- 🧠 Fundamental analysis of political news 🔹 Positive news effect: - Reducing international tensions; improving inflation expectations - Possibility of Economic Opening → Increased demand for large stocks - Strengthening the Nima exchange rate; 🔹 Shasta's fundamental status: - Various assets in petrochemical, insurance, metals, energy - High dependence on the exchange rate and world prices - Sustainable profitability in recent reports - P/E approximately 7.4 → still in the valuable range 📌 If the political space leads to economic opening, Shasta can move to the mid -term horizon with the growth of NAV and increased demand. --- 🎯 Strategic summary | Scenario | Price Behavior | Suggested Strategy | | -------- ------------ -------------------- | Resistance Failure | Growth up to 1 and then 1 | Staircase entry with a loss limit | | Moneybaking to 1 | Opportunity for re -purchase Login in Correction with Volume Confirmation | Correction of the General Market Falling up to 1 or less | Conservative exit or entry with a loss limit
تحلیل ناب 🏁🎯🔎
Symbol #Shasta (Social Security Investment Company) One of the largest and most popular symbols of the Iranian stock market is That due to the diversity of portfolio and dependence on various industries, It has always been the focus of market participants. Let's take a look at the current situation and its vision for next week. 📊 --- 📌 Current Status of Shasta (until September 1): - Final Price: About 1.5 Toman - Transaction volume: More than 1 million shares - Market Value: About 2 trillion dollars - p/e ttm: about 1.5 (Relatively low, indicating relative value) - Cash Profit (DPS): 1 Toman with a distribution rate of 1 % --- 📈 Short -term fundamental analysis: - Shasta owns several large stock and non -non -extensive holdings, Including: Tapiko, Tipico, Tasiko, Saba Supply, Cement Supply, and Wright. - Price to NAV ratio in different ways Is between 1 % and 1 %, This indicates a significant discount on the intrinsic value. - Due to the rise in dollar and inflation, Shasta export -oriented subsidiaries They can be more profitable. --- 🔮 Forecast for next week: - Given the increase in real demand and proximity to the assembly, There is a possibility of limited growth in the short term. - If there is a positive news about political agreements or reduced tensions, Shasta can move as a market leader symbol. - but in the event of negative news or sales pressure on the market, Due to high liquidity, it may be faster.

بورس نیلوفری

The brilliance of the Golden Performance of Tasiko in the annual assembly / dividend 2 Tomanico The annual general public collection of Sadr Supply Investment Company (Tasiko) ended in the fiscal year of May 21, 1404 with the participation of senior executives in Shasta and Tasiko and other shareholders. The Company's ordinary general meeting with the presence of managers ان Behrouz Creator, Vice President of Social Security Investment Company (Shasta) and Rabis Assembly, Mohammad Sajjad Siahkarzadeh, Deputy Financial and Human Capital of Shasta as supervisor, Saeed Vice President, Vice President of Supervisors and Supervision of Shasta Companies, Seyyed Ali Reza Political Rad, Managing Director and Managing Director. اری At the annual general meeting of Sadr Supply Investment Company (Tasiko) ending May 31, 1404, the performance indicators of this holding were examined. In this basis, consolidated operational revenue reached 34.445 billion tomans, which is a significant growth compared to the previous period. Also, the cost of the goods sold was 26.075 billion tomans and GDP was $ 14.910 billion with a gross margin of 24 %. Public, administrative and sales costs, as well as other operating costs, raised operating profits to about 14.151 billion USD. The pre -taxation of 13.132 billion tomans and after the tax deduction, the consolidated net profit reached 11.950 billion tomans. Sayed Alireza Policy Rad, CEO of Sadr Supply Investment Company (Tasiko) stated: I joined the complex in the middle of the route, but Tasiko's rails in the mining and mining industries were professionally and cleverly carried out. Reports also show that the company is on the path to sustainable growth and it is important to us to maintain this process. Holding strategy was finalized and approved in year 6, and the level of concentration of decision -making was determined, the areas we should get out of or enter into were determined, and this executive document was approved according to the capacity of the collection. ید For this year, three main axes are on the agenda, reducing the diversity of activities, expanding exports and strengthening financing capacity, as well as the exploitation of the Taftan Gold Mine, which is estimated to be extracted by about 5 kg of gold a month. The growth of the financing sector has begun in year 6 and is more diverse today, and almost all the funds absorbed in the company's development projects have been employed. @shastamedia

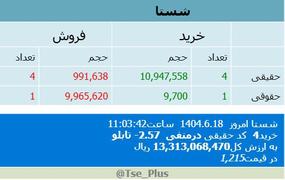
🟢🟢 #Shosha 💹 @tse_plus 📅 1404/6/18 ⌚ 11:03:42 🔖 1,215 #Purchase 4 real code in Nafi -2.57 boards Valued at 13,313,068,470 Rials Per capita purchase of each code 3,325,321,350 Rials
Disclaimer
Any content and materials included in Sahmeto's website and official communication channels are a compilation of personal opinions and analyses and are not binding. They do not constitute any recommendation for buying, selling, entering or exiting the stock market and cryptocurrency market. Also, all news and analyses included in the website and channels are merely republished information from official and unofficial domestic and foreign sources, and it is obvious that users of the said content are responsible for following up and ensuring the authenticity and accuracy of the materials. Therefore, while disclaiming responsibility, it is declared that the responsibility for any decision-making, action, and potential profit and loss in the capital market and cryptocurrency market lies with the trader.