
کارگزاری تدبیرگران فردا
@g_1332669919

What symbols does the trader recommend buying?
Purchase History
پیام های تریدر
کارگزاری تدبیرگران فردا
#Initial _ supply #Kimazi Kimazi's initial release (Kimya Kalai Razi Company) Initial release date: Wednesday 26 Azar 1404 Initial release method: two-stage Valuation price: 25,905 rials Maximum quota of each code: 85 shares 🆔 @Tadbirgaran_farda 📞|021-82428 📱|@tadbirgaran_farda 🌐|www.tadbirbroker.ir
کارگزاری تدبیرگران فردا
Daily analysis weekly ending on Friday, December 21, 1404, number 224: Technical analysis of 18 carat gold ✅ Shasta technical analysis ✅ Technical and business analysis Technical analysis of the US dollar ✅ What are Murabaha financing bonds? ✅ Price changes in the past week Weekly basket 🆔 @Tadbirgaran_farda 📞|021-82428 📱|@tadbirgaran_farda 🌐|www.tadbirbroker.ir
کارگزاری تدبیرگران فردا
World Copper Industry Day Copper is not just a metal; It is one of the main engines of Iran's mineral economy. Iran is considered one of the world's copper powers with huge reserves and large mines such as Sarchesheme and Songun. From the annual production of 300,000 tons of copper to the export of several billion dollars, this industry is one of the most stable sectors of the country's economy. An industry that continues to grow despite sanctions and global price fluctuations. In the stock market, "Famli" and other copper symbols have always been one of the attractive options for analysts and investors. copper; A metal with an old history, but its role today is more important than ever. 🆔 @Tadbirgaran_farda 📞|021-82428 📱|@tadbirgaran_farda 🌐|www.tadbirbroker.ir
کارگزاری تدبیرگران فردا
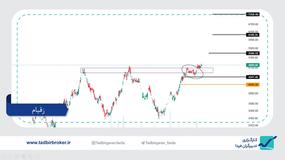
🟡 We examined Zaghiam in performance chart, logarithmic scale and daily time frame on 09/09/1404: Zaghiam's price fluctuations have a neutral structure from a medium-term perspective. During the recent upward movement, we see the price of Zaghiam reaching the ceiling of the neutral range and creating a dense range of fluctuations. (black circle) Zaghiam has managed to get out of this dense range and is stabilizing the price above the resistance level. If this stabilization is completed and Zaghiam is associated with further growth, the targets of 525, 615 and 725 Tomans are available. According to the chart and in case of price correction, there is support around 435 Tomans. The bullish view of this analysis was violated by the price drop and stabilization below 409 Tomans.
کارگزاری تدبیرگران فردا
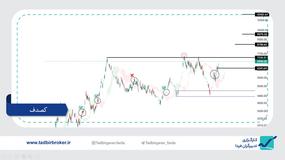
🟡 We examined the shell in the functional chart, logarithmic scale and daily time frame: Shellfish price fluctuations have an upward structure. Analysis of micro-fluctuations shows that after reacting to the support range of around 450 Tomans, Kasdaf has been able to have a good growth. As a result of this growth, we see the price crossing the Como cloud and its high stabilization; This behavior increases the possibility of further growth. The past review of the chart shows that out of the last 4 times that the price has crossed the Como cloud, we have seen a higher price growth 3 times; This increases the probability of success. On the other hand, as a result of price growth, we have approached the previous ceiling range; Due to the fact that in the past we have witnessed the price penetration above the ceiling of 730 tomans (red circle), it is likely that the price will cross the ceiling this time as the price approaches this range. The targets are 870, 1000 and 1300 tomans respectively. If we see a correction in the price, there is a support area around 635 Tomans, which if it is accompanied by a positive reaction and legal support leads to the confirmation of the support range, it will lead to the validity of the mentioned goals. Analyst: Sharif Bakhsh 🆔 @Tadbirgaran_farda
کارگزاری تدبیرگران فردا
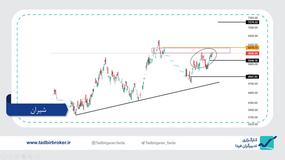
🔵 We examined Shiran in performance chart, logarithmic scale and daily time frame: During the recent upward movement, we see the weak growth of Shiran's symbol. The weakness of the trend is evident in the range of the black curve, and the location of this weakness is on the resistance range of 600 Tomans. This has led to the riskiness of Sheeran's fluctuations. In order for Shiran to continue its growth, it is necessary to cross the level of 608 Tomans, in this case, the target of 730 Tomans is available. If Shiran cannot cross the resistance of 600 Tomans and faces a price drop and stabilization below 555 Tomans, a confirmation has been issued to neutralize the trend and Sheeran will probably continue neutral fluctuations between the two ranges of 600 and 500 Tomans. In summary: Currently, the trend of Sheeran fluctuations is positive, but it is followed by weakness. If you are a symbol shareholder, it is recommended to maintain with a loss limit of 555 Tomans. If you are planning to enter, entering at the current price is extremely risky and we recommend entering with a small volume. To enter with a higher probability of success, wait for the price to stabilize above the resistance level. Analyst: Sharif Bakhsh 🆔 @Tadbirgaran_farda
کارگزاری تدبیرگران فردا
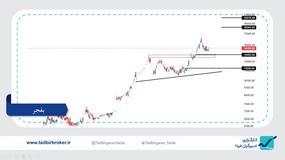
We examined Bafjar in performance chart, logarithmic scale and daily time frame: The price fluctuations of Befjar symbol have an upward structure. Due to the fact that Befjar has recently removed an important resistance, it is now in the phase of price stabilization and pullback to break the level. The important support area ahead of the corrective path is around 1350 Tomans. If the share reacts positively to this range, potentials for further growth were created. In this case, by examining the fluctuations and using the Fibonacci tool, price targets of 1825 and 2030 Tomans are available. If the mentioned support area is lost, the next support area is around 1160 Tomans. In short: due to the upward volatility of buying this share, it is low risk, but it is recommended to enter in a stepwise manner and in the support area, and also after confirmation of the upward trend again. This report is not a buy or sell signal. (disclaimer) Analyst: Sharif Bakhsh 🆔 @Tadbirgaran_farda 📞|021-82428 📱|@tadbirgaran_farda 🌐|www.tadbirbroker.ir
کارگزاری تدبیرگران فردا
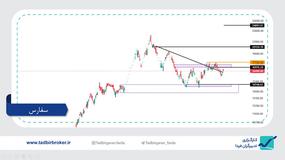
🟡 We examined Sefars in performance chart, logarithmic scale and daily time frame: At the end of the short-term and downward fluctuations of Sefars, when the price reaches the support range of around 14,000 Rials, we see the positive reactions of the shares. As a result of the mentioned positive reactions, the potential of forming a double floor pattern has been created. The important point is the inability of Sefars to break the range of the neck line of the pattern as well as the short-term downward trend line. The recent points have led us to have a view of neutral fluctuations between the two price ranges of 16,975 and 14,745 Rials for Seferas. In order for Seferas to take the structure of upward fluctuations again, it is necessary to be accompanied by price growth and confirmation issuance. Issuance of confirmation of growth occurs when Sefars stabilizes the price above 17722 Rials, in this case the short-term downward trend line is broken. In case of approval, the target of 20120 Rials and in the next stage the target of 24000 Rials was available. This report is not a buy or sell signal. (disclaimer) Analyst: Sharif Bakhsh 🆔 @Tadbirgaran_farda 📞|021-82428 📱|@tadbirgaran_farda 🌐|www.tadbirbroker.ir
کارگزاری تدبیرگران فردا
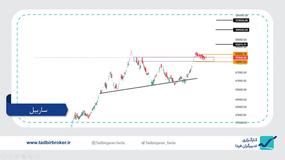
🔵 We examined Sarbil in performance chart, logarithmic scale and daily time frame: Sarbil has an upward swing structure. After the sharp upward swing of Sarbil, we see the breaking of the resistance level. After the surface was broken, Sharp's swing was completed and Sarbil made a dense pullback towards the broken surface with a gentle slope. If the demand to buy Sarbil in this area leads to price growth and stabilization above 82,840 Rials, the pullback has been completed and approval for further growth has been issued. In case of approval, targets of 92850, 109940 and 123000 rials are available. If, contrary to the analytical point of view, we face a price drop and stabilization below 75,990 rials, the upward structure of fluctuations has changed to neutral and there was a possibility of a further price drop. This report is not a buy or sell signal. (disclaimer) Analyst: Sharif Bakhsh 🆔 @Tadbirgaran_farda 📞|021-82428 📱|@tadbirgaran_farda 🌐|www.tadbirbroker.ir
کارگزاری تدبیرگران فردا
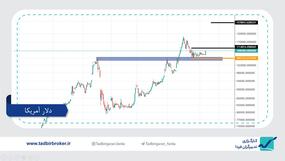
🔵 We examined the US dollar in the logarithmic scale chart and daily time frame: After the price correction and the dollar price reaching the support range of around 105,000 tomans, we have seen the price drop. Placing the price in the support area indicates the existence of a view in the support area, but due to the uncertainty of the main decision of the traders, there is a concentration of the price. We are now witnessing the rapid upward growth of the dollar and taking action to move the price out of the compression range. This shows that there is still a bullish outlook on the dollar and buyers are stronger than sellers. According to the charts, the dollar can have a target of around 127,000 tomans. For more certainty, it is necessary for the dollar to stabilize above 111,000 Tomans, in this case, an upward pivot is formed on the support area, which confirms the resumption of the upward trend. The loss limit from the analytical point of view is price drop and stabilization below 105,000 Tomans. This report is not a buy or sell signal. (disclaimer) Analyst: Sharif Bakhsh 🆔 @Tadbirgaran_farda 📞|021-82428 📱|@tadbirgaran_farda 🌐|www.tadbirbroker.ir
Disclaimer
Any content and materials included in Sahmeto's website and official communication channels are a compilation of personal opinions and analyses and are not binding. They do not constitute any recommendation for buying, selling, entering or exiting the stock market and cryptocurrency market. Also, all news and analyses included in the website and channels are merely republished information from official and unofficial domestic and foreign sources, and it is obvious that users of the said content are responsible for following up and ensuring the authenticity and accuracy of the materials. Therefore, while disclaiming responsibility, it is declared that the responsibility for any decision-making, action, and potential profit and loss in the capital market and cryptocurrency market lies with the trader.