
xxx5w4nxxx
@t_xxx5w4nxxx

What symbols does the trader recommend buying?
Purchase History
پیام های تریدر
Filter
Signal Type
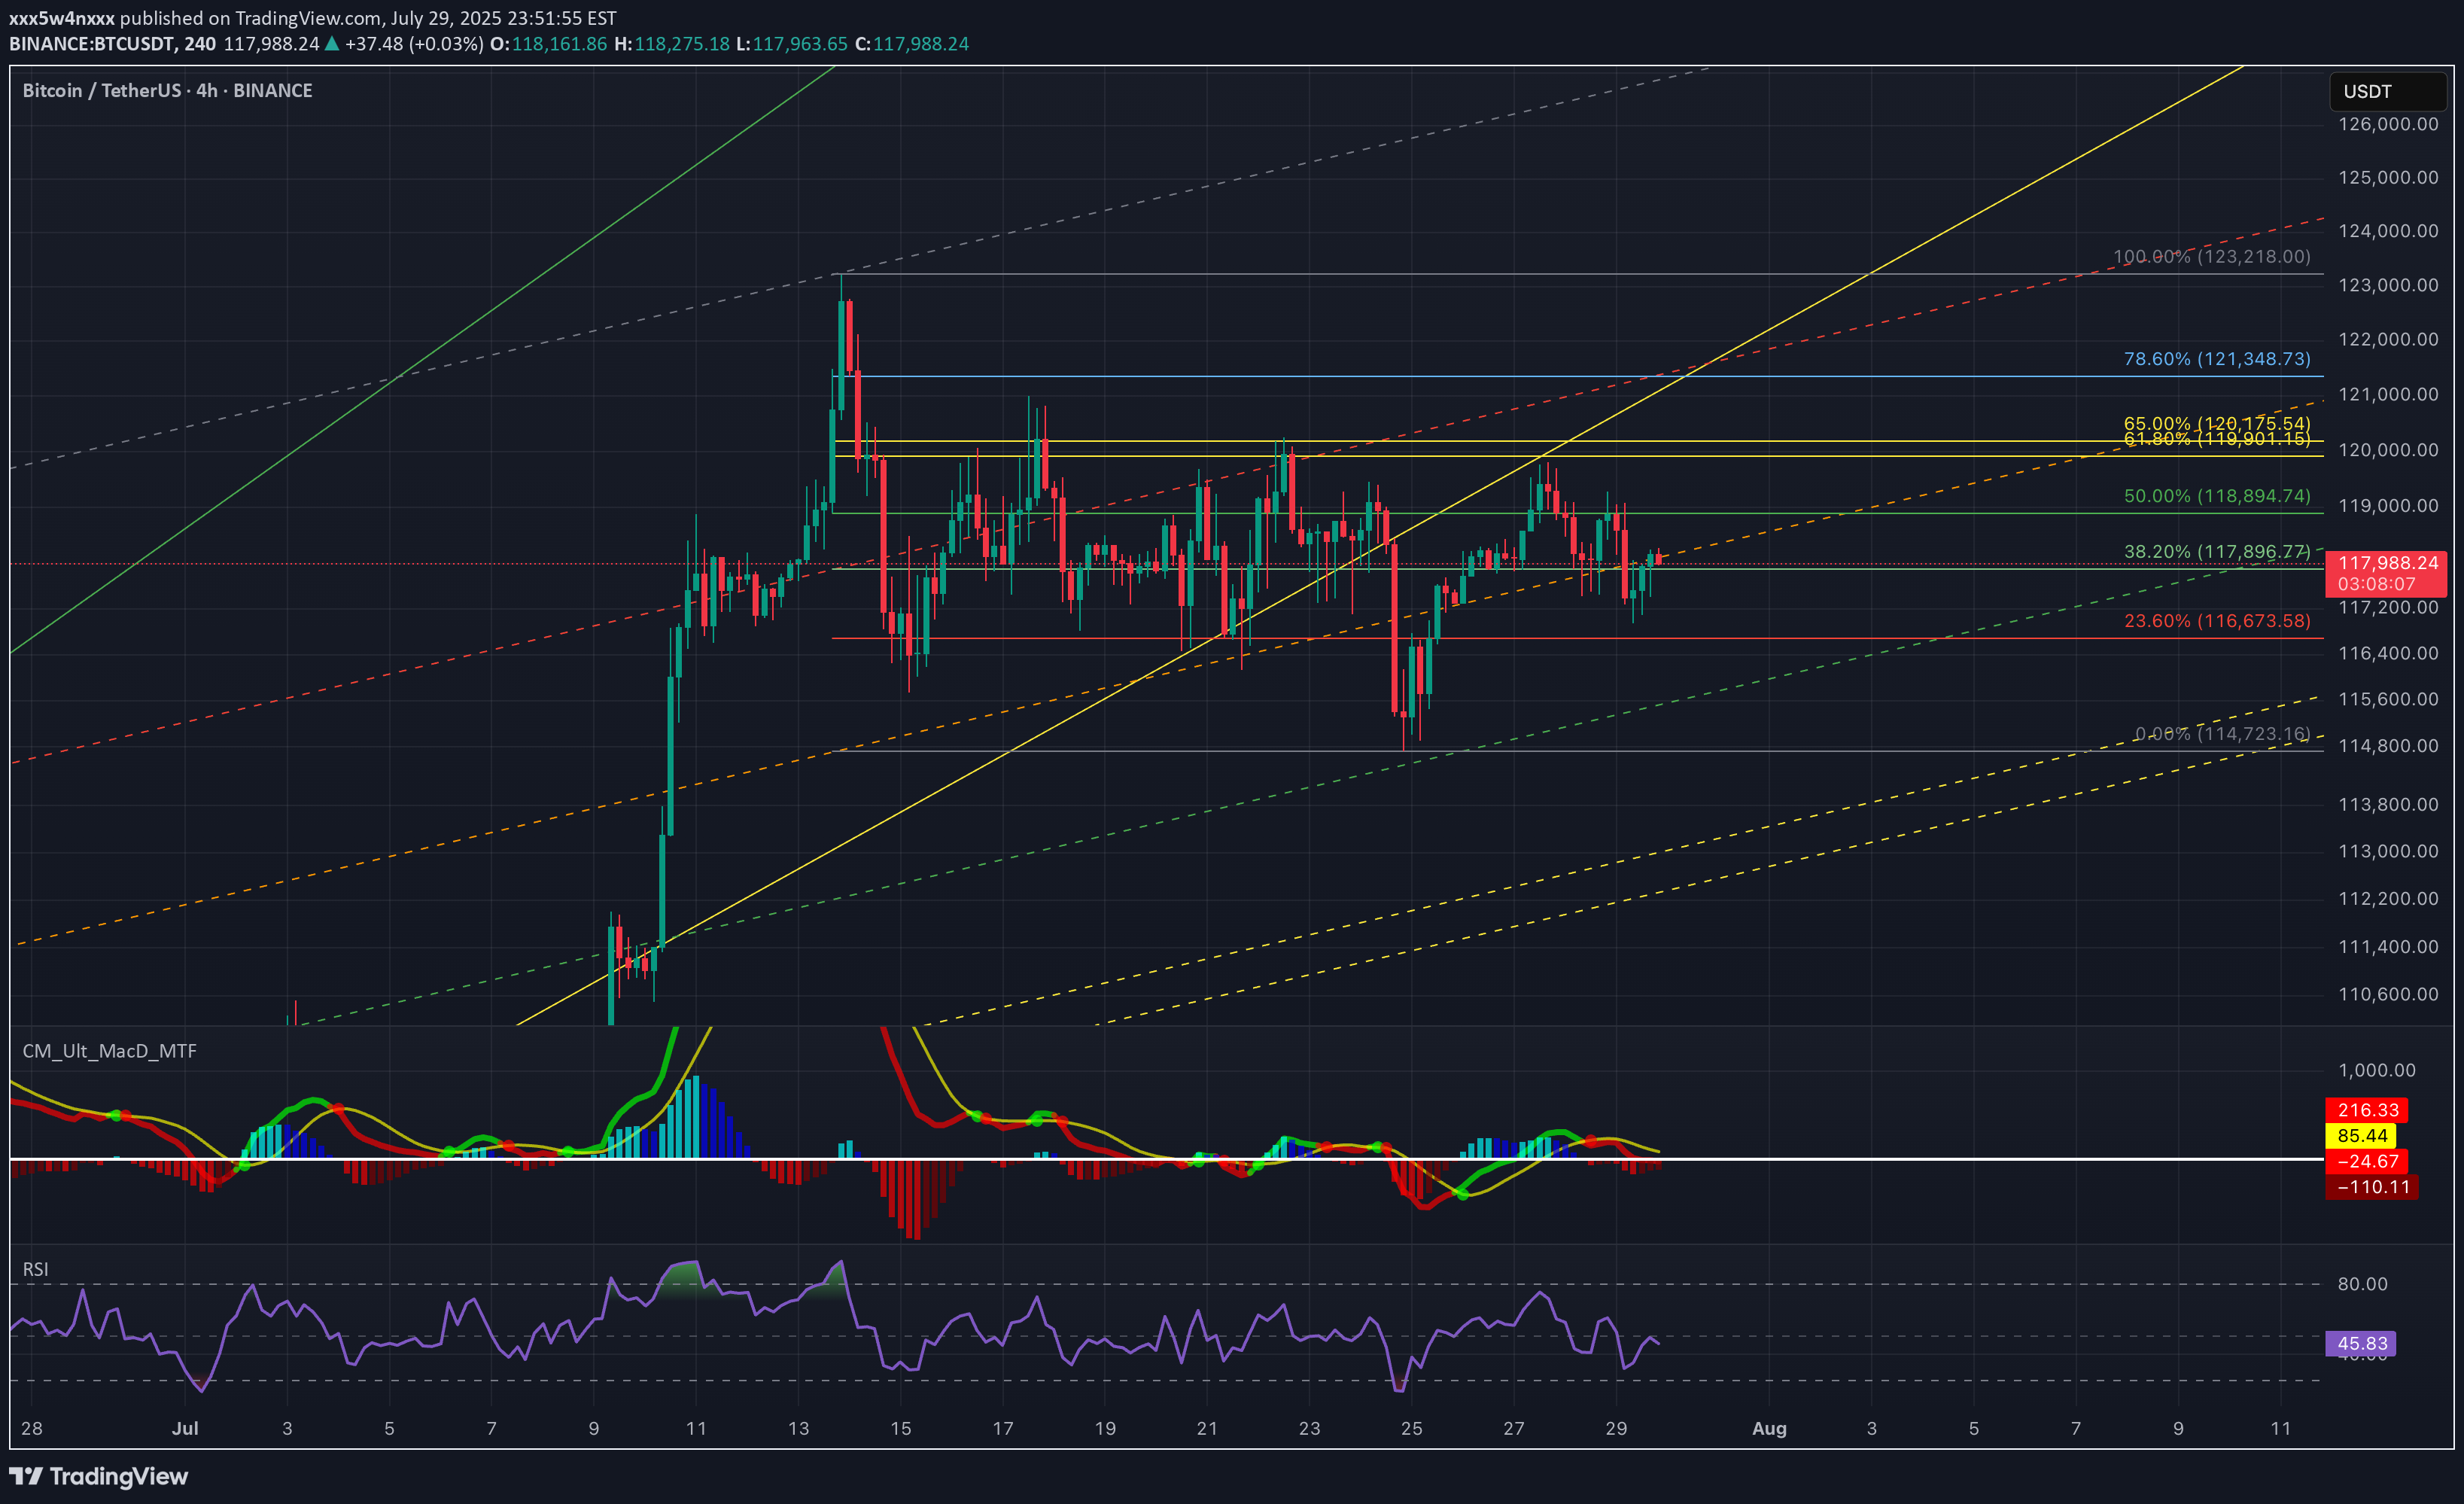
Back on July 27, I shared a path 120K → 114K → 127K Price has followed this playbook closely and now we’re at a critical zone again. On daily timeframe, structure is still in an uptrend, but momentum is fading. Price is consolidating between 119.9K–120.1K (Fib 61.8–65%) and 117.8K–116.6K (Fib 38.2–23.6%). MACD bearish crossover and histogram is still growing. RSI is neutral at 51 but definitely losing bullish energy. If 117.8K breaks cleanly, we may revisit 114.7K (demand zone + full Fib retracement) before bulls reclaim control. If we look at lower timeframe (4H). It is forming a tight range, but a lower high + weakening MACD suggests a bit more downside short term. Also, RSI at 46 confirms that consolidation with mild bearish tilt. Key levels that I am currently looking are 118.8K–117.8K for the short-term intraday range play. And 116.6K & 114.7K for the support & potential bounce zone. The scenario is still in play - Rejection at 120K - Retest 114K–116K zone 🚀 Then potential launch toward 127K (measured move + channel top) Only a daily close above 120.1K with volume invalidates this retrace idea. TL;DR 🟥 Resistance: 119.9K–120.1K 🟧 Neutral zone: 117.8K–118.9K 🟩 Support: 116.6K - 114.7K 🟦 Target: 127K if bulls reclaim the high ground Still playing the patient game. Let’s see if 114K gets tagged one more time. What do you guys think?
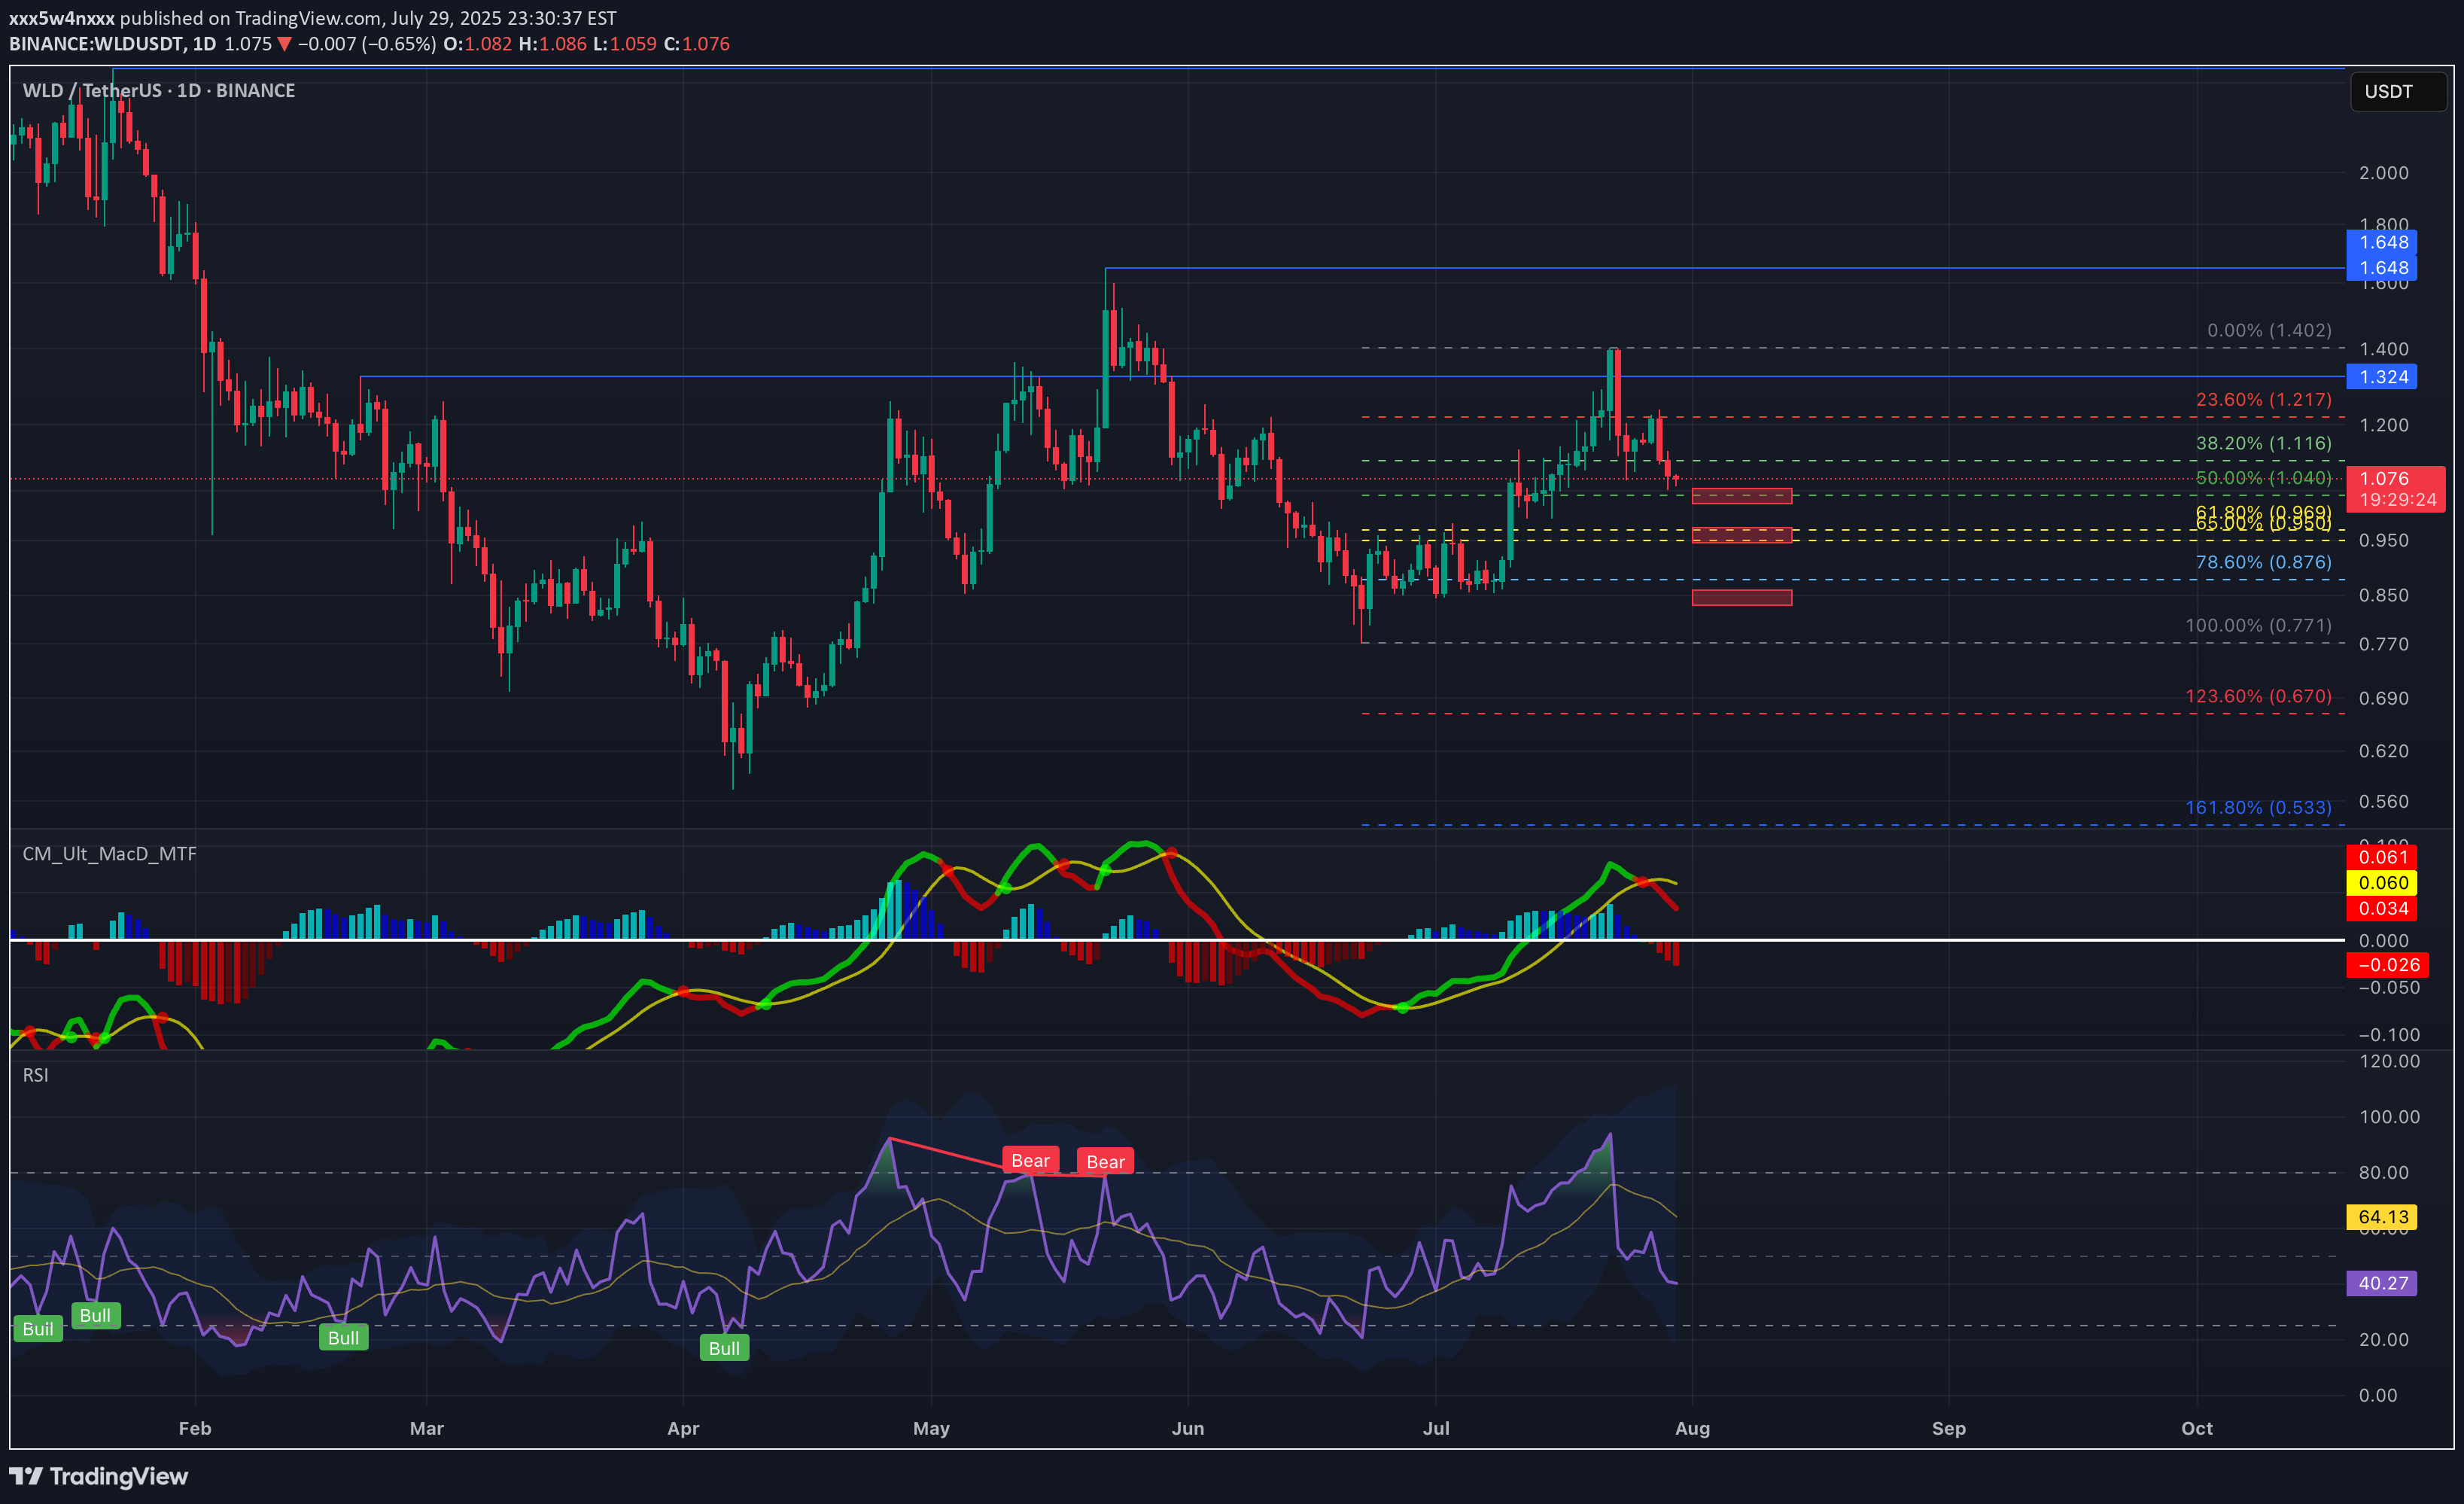
After rejecting the key resistance, price is retracing and currently hovering around the 50% Fib level (1.040). Currently, MACD crossover below signal and RSI rolling down from overbought. So, momentum has turned bearish. I'm watching the 0.968–1.000 zone (Fib 61.8% + demand) as a critical bounce or breakdown area. A bullish reaction here could trigger a rebound toward 1.324, 1.648, and more. Break below 0.960 opens room toward 0.876 or lower. The plan is to go LONG if price shows strength near 0.968 (bullish engulfing, divergence) 📌 Bearish bias short-term, but key support test coming. Staying flexible.
Disclaimer
Any content and materials included in Sahmeto's website and official communication channels are a compilation of personal opinions and analyses and are not binding. They do not constitute any recommendation for buying, selling, entering or exiting the stock market and cryptocurrency market. Also, all news and analyses included in the website and channels are merely republished information from official and unofficial domestic and foreign sources, and it is obvious that users of the said content are responsible for following up and ensuring the authenticity and accuracy of the materials. Therefore, while disclaiming responsibility, it is declared that the responsibility for any decision-making, action, and potential profit and loss in the capital market and cryptocurrency market lies with the trader.