
v_king_x
@t_v_king_x

What symbols does the trader recommend buying?
Purchase History
پیام های تریدر
Filter
Signal Type
v_king_x

gold sort timePrice Action AnalysisThe first aspect to assess is the price action of Gold on the 5-minute time frame. Traders need to examine the overall trend, support and resistance levels, and any significant price patterns that may emerge. By doing so, they can gain insights into potential areas where a long entry might be suitable.
v_king_x

PLS FOLLOW FOR MORE V-KINGIntroduction In this analysis, we will delve into the long entry opportunities for Gold (XAUUSD) on the TradingView platform, focusing on the 5-minute time frame for the trading session on 6th July 2023. Gold, a highly sought-after precious metal, is often considered a safe-haven asset and attracts significant attention from traders and investors. By examining the price action and relevant indicators, we aim to identify potential favorable long entry positions.Price Action Analysis The first aspect to assess is the price action of Gold on the 5-minute time frame. Traders need to examine the overall trend, support and resistance levels, and any significant price patterns that may emerge. By doing so, they can gain insights into potential areas where a long entry might be suitable.On the chosen date, 6th July 2023, the price action reveals that Gold has been in an uptrend, forming higher highs and higher lows. This indicates a bullish bias in the short term. Additionally, there appears to be a clear support level at a key price level, reinforcing the bullish sentiment.Indicators and Oscillators To enhance our analysis, we can incorporate various indicators and oscillators available on TradingView. These tools help traders identify potential entry points, assess market momentum, and confirm or negate the signals provided by the price action analysis.One popular indicator for gold trading is the Moving Average Convergence Divergence (MACD). By examining the MACD line and the signal line, traders can gain insights into the strength and direction of the trend. A bullish crossover of these lines may serve as a confirmation for a long entry opportunity.Another valuable tool is the Relative Strength Index (RSI). It measures the overbought or oversold conditions of an asset and helps traders gauge the momentum in the market. A reading above 50 on the RSI could suggest a bullish bias and potentially support the long entry position.Furthermore, incorporating Bollinger Bands can assist in identifying periods of increased volatility. A narrowing of the bands followed by a breakout to the upside might signal an imminent upward move, reinforcing the long entry opportunity.Risk Management No analysis would be complete without considering proper risk management. Traders must define their risk tolerance, set stop-loss levels, and determine their target profit levels. By doing so, they can protect their capital and manage potential losses while maximizing potential gains.Conclusion In conclusion, based on the price action analysis, along with the assistance of various indicators and oscillators such as MACD, RSI, and Bollinger Bands, a long entry opportunity for Gold (XAUUSD) on the TradingView platform, using the 5-minute time frame on 6th July 2023, appears favorable. However, traders must exercise caution and implement appropriate risk management strategies to navigate the markets effectively.
v_king_x

follow for more VKINGv_king_x (any social site)Title: GOLD (XAUUSD) TradingView Analysis - 5-Minute Time Frame Long Entry - July 5, 2023Introduction:In this trading analysis, we will explore the potential long entry opportunity for GOLD (XAUUSD) on the 5-minute time frame, specifically on July 5, 2023. By examining the recent price action and relevant indicators, we aim to provide a comprehensive description of the trading scenario and discuss the factors supporting a bullish outlook for GOLD.Market Overview:GOLD, often considered a safe-haven asset, has attracted traders and investors for its historical value as a store of wealth. The precious metal's price dynamics are influenced by various factors, including economic data, geopolitical events, inflation concerns, and market sentiment. Technical analysis, combined with fundamental insights, can provide a well-rounded perspective on GOLD's short-term price movements.5-Minute Time Frame Analysis:On July 5, 2023, we focus on the 5-minute time frame to capture short-term price fluctuations. It is crucial to note that this analysis is intended for traders seeking opportunities within a day rather than long-term investors.Recent Price Action:Analyzing recent price action is the first step towards understanding the market sentiment. A review of the previous trading sessions indicates that GOLD has been exhibiting bullish tendencies. The price has been forming higher highs and higher lows, suggesting an upward trend. This bullish structure indicates that buyers have been dominant and that the overall sentiment is positive.Support and Resistance Levels:Identifying key support and resistance levels is essential for planning entry and exit points. Based on the recent price action, we can observe that GOLD has established a strong support level around $1,750, which has held firm against multiple attempts to break below. On the upside, the immediate resistance is seen around $1,800.Indicators:To complement the price action analysis, we consider technical indicators to gain further insights into the market. Commonly used indicators include Moving Averages, Relative Strength Index (RSI), and Bollinger Bands.Moving Averages:The 50-period and 200-period moving averages are widely followed by traders. In this scenario, we observe that GOLD's price is trading above both moving averages, suggesting a bullish bias. The 50-period moving average is acting as immediate support, reinforcing the positive sentiment.RSI:The Relative Strength Index (RSI) is a momentum oscillator that measures the speed and change of price movements. A reading above 50 indicates bullish momentum. Currently, the RSI for GOLD on the 5-minute time frame is above 50, indicating a favorable outlook for the precious metal.Bollinger Bands:Bollinger Bands are used to identify price volatility. During this analysis, we observe that the price is approaching the upper Bollinger Band, suggesting that GOLD might experience an upward breakout. This breakout, coupled with the bullish price structure, adds to the argument for a long entry.Risk Management:When trading any financial instrument, risk management is of utmost importance. Before entering a trade, it is crucial to determine the appropriate stop-loss level and potential profit target. Stop-loss orders can be placed below the nearest support level to minimize potential losses in case the trade goes against expectations.Conclusion:In conclusion, based on the analysis of GOLD (XAUUSD) on the 5-minute time frame, a long entry appears to be a favorable trading opportunity on July 5, 2023. The bullish price structure, supported by the presence of key support levels, moving averages, RSI, and Bollinger Bands, all contribute to a positive outlook for the precious metal. As with any trading decision, it is essential to incorporate sound risk management strategies to mitigate potential losses and maximize profit potential. Traders should
v_king_x
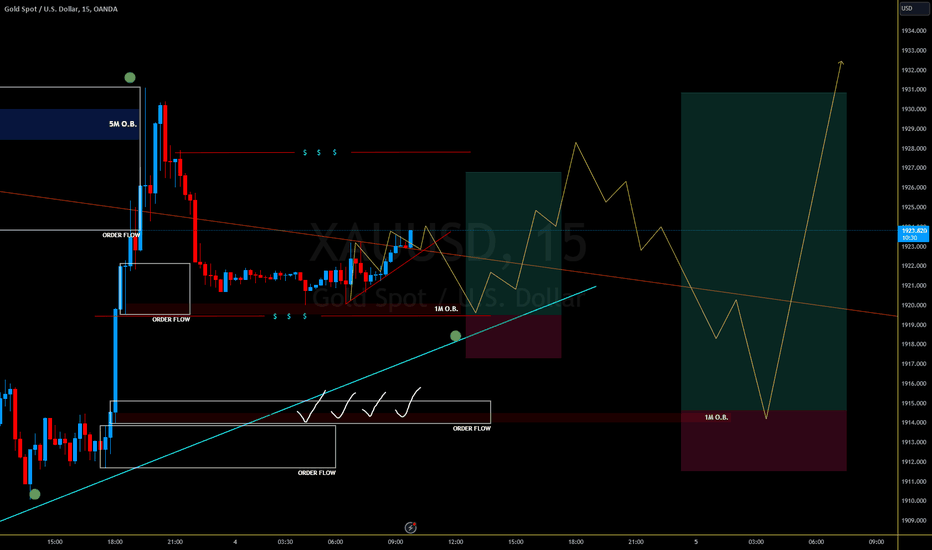
The XAU/USD trading pair is one of the most closely watched and actively traded currency pairs in the global financial markets. XAU represents gold, which is considered a safe-haven asset, while USD represents the US dollar, the world's reserve currency. This pair reflects the relative strength or weakness of the US dollar against the value of gold.On the 5-minute timeframe of TradingView, traders can observe short-term fluctuations in the XAU/USD pair, providing valuable insights into the market dynamics and potential trading opportunities. The 5-minute timeframe allows for precise analysis of price movements and the identification of intraday trends.As of the 4th of July 2023, the XAU/USD pair on the 5-minute chart displayed certain characteristics worth noting. The chart depicted a series of candlestick patterns, which indicate the opening, closing, high, and low prices within each 5-minute interval.In the context of the XAU/USD pair, the 5-minute chart can reveal important information about market sentiment and short-term price action. Traders often utilize technical indicators such as moving averages, oscillators, and trend lines to assist in their analysis.During this specific timeframe, it is crucial to keep an eye on key support and resistance levels. Support levels are price levels at which demand is expected to be strong enough to prevent further price declines. Resistance levels, on the other hand, are price levels at which selling pressure is anticipated to be significant enough to prevent further price increases.By observing the 5-minute chart, traders can identify potential entry and exit points for their trades. This short timeframe allows for quick decision-making and potentially rapid execution of trades. Traders who employ short-term trading strategies, such as scalping or day trading, often rely on the 5-minute timeframe to capture smaller price movements.It is important to note that the XAU/USD pair can be influenced by various factors. Economic data releases, geopolitical events, central bank policies, and market sentiment all play a role in shaping the movements of this currency pair. Therefore, traders must stay informed about these fundamental factors to make informed trading decisions.Moreover, risk management is a crucial aspect of trading the XAU/USD pair on the 5-minute timeframe. Traders should define their risk tolerance, set appropriate stop-loss levels, and employ proper position sizing to protect their capital.In conclusion, the 5-minute timeframe on TradingView provides traders with a detailed view of short-term price movements and potential trading opportunities in the XAU/USD pair. By analyzing candlestick patterns, employing technical indicators, and considering fundamental factors, traders can make informed decisions about entering or exiting trades. However, it is important to exercise caution, manage risks effectively, and stay updated on market developments to navigate the dynamic nature of the XAU/USD market successfully.
Disclaimer
Any content and materials included in Sahmeto's website and official communication channels are a compilation of personal opinions and analyses and are not binding. They do not constitute any recommendation for buying, selling, entering or exiting the stock market and cryptocurrency market. Also, all news and analyses included in the website and channels are merely republished information from official and unofficial domestic and foreign sources, and it is obvious that users of the said content are responsible for following up and ensuring the authenticity and accuracy of the materials. Therefore, while disclaiming responsibility, it is declared that the responsibility for any decision-making, action, and potential profit and loss in the capital market and cryptocurrency market lies with the trader.