
tommie1337
@t_tommie1337

What symbols does the trader recommend buying?
Purchase History
پیام های تریدر
Filter
Altın Kritik Dirençte: Patlama mı, Geri Çekilme mi?
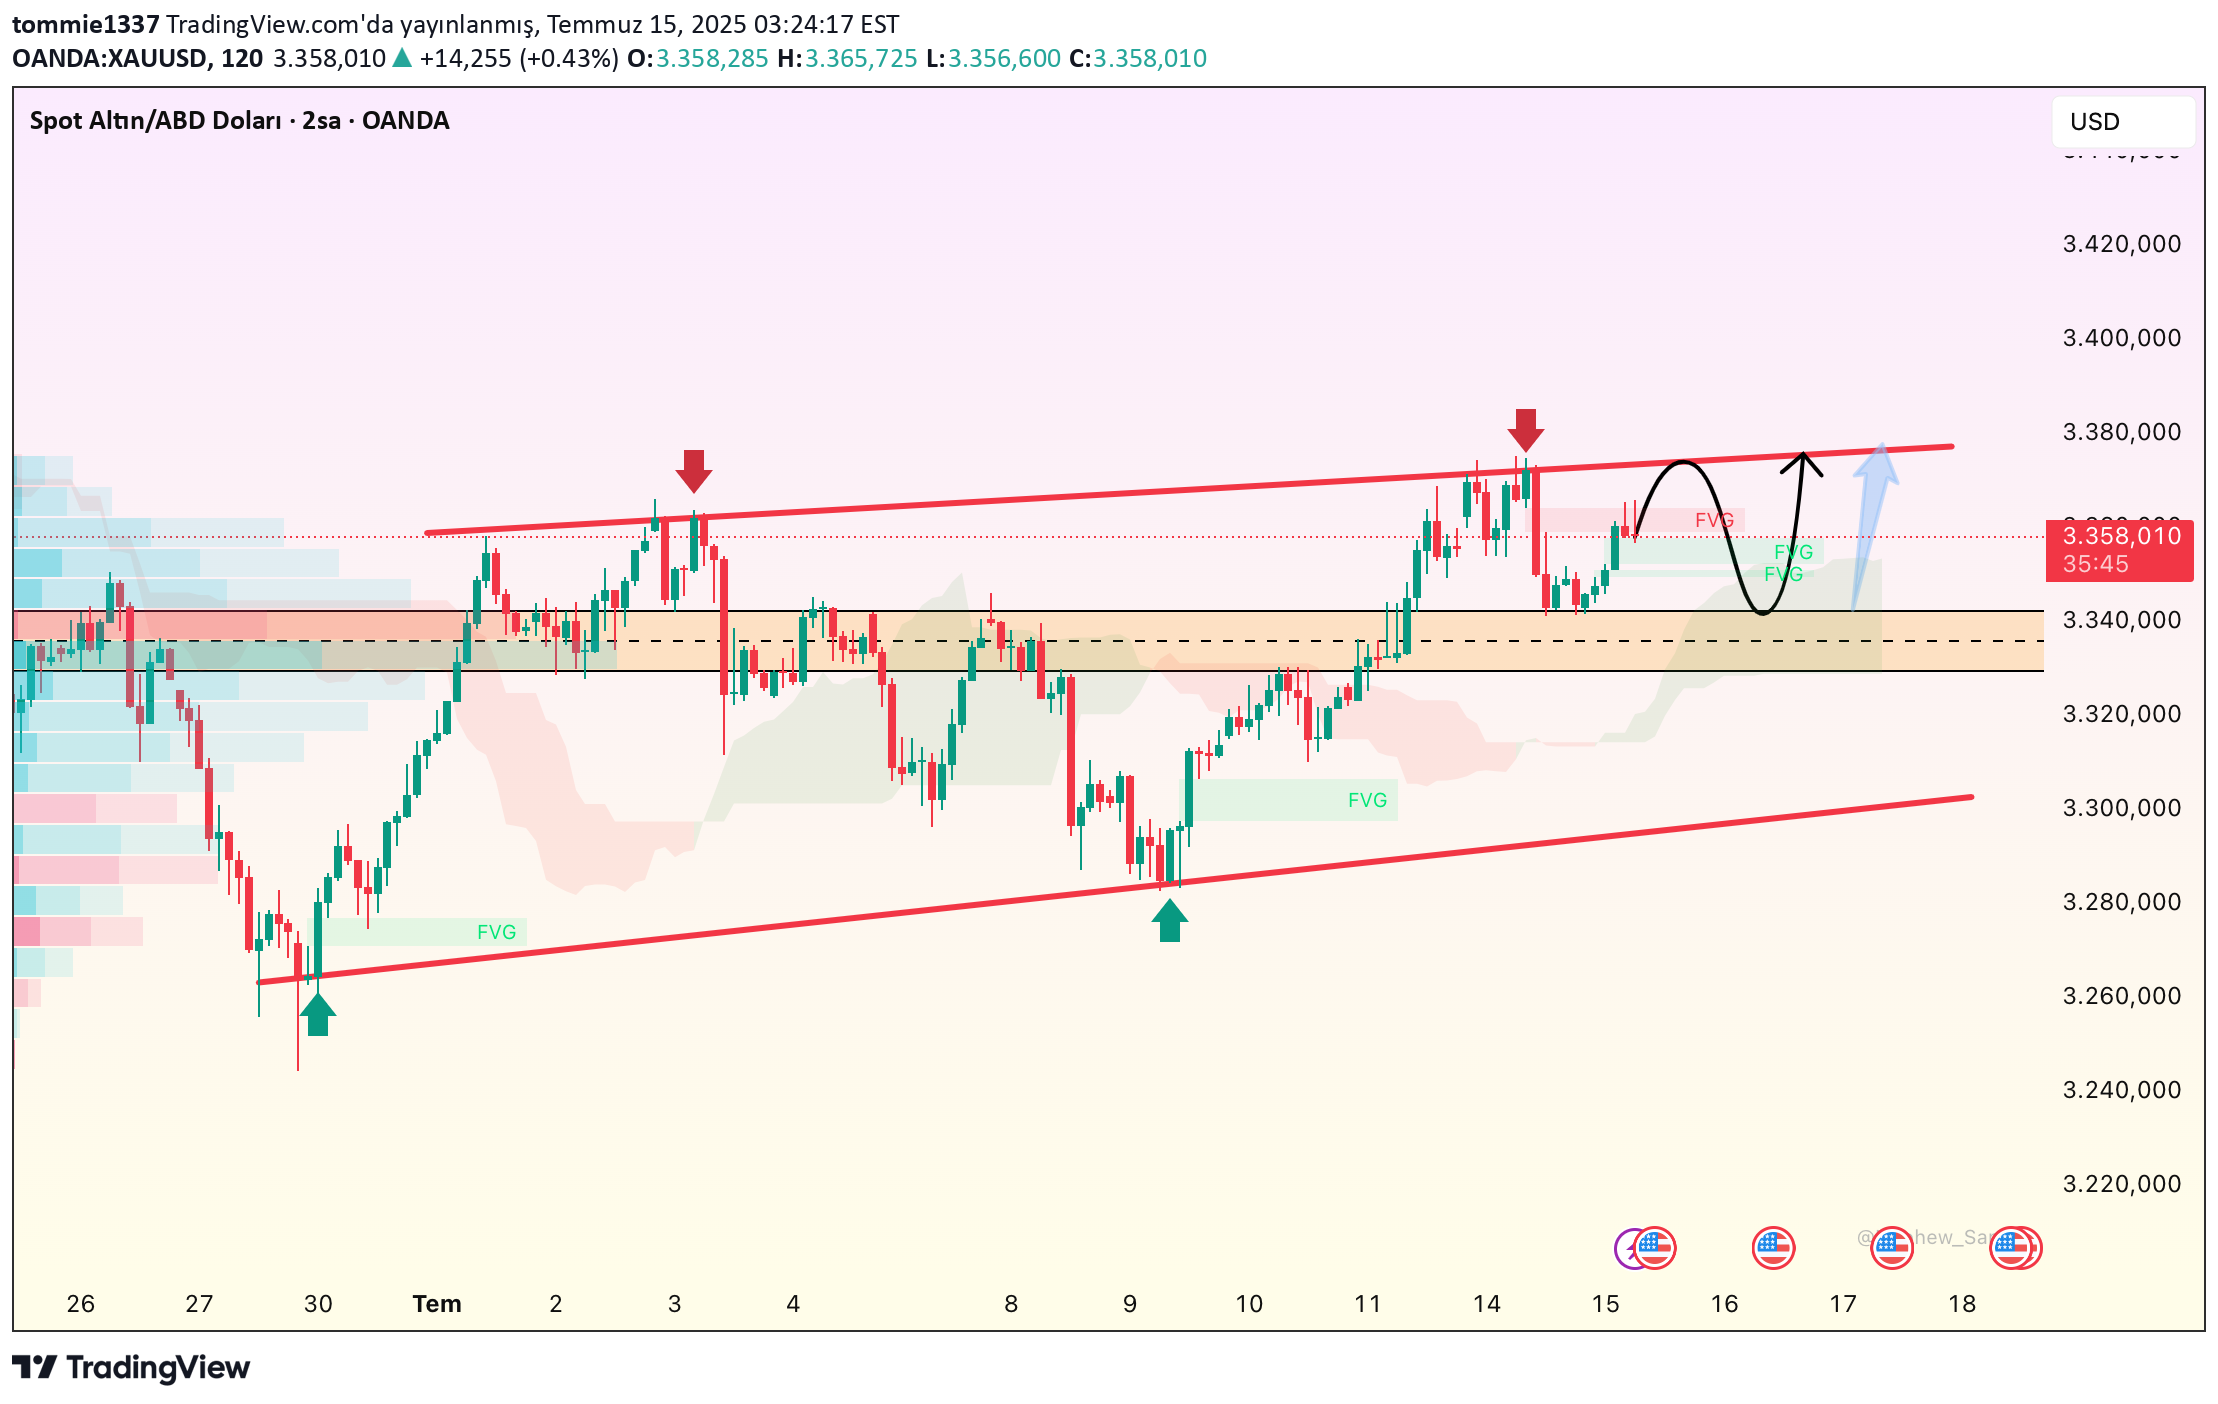
XAUUSD The price is currently faced with a strong resistance that has been tested many times before in the range of 3.365 - 3.370 USD/ounce. Prior to the fVG in the region of 3,330, the technical response to the rise in the Gold, the decision is currently in the decision phase. The latest candle formations show that buyers gain strength; Long -bodied and short -tailed candles point to an upward support supported by demand. In addition, Ichimoku cloud and FVG support forms the technical basis of the rise trend. But attention! The US CPI data and the speeches of the FED members to be announced today may cause sudden changes in the market. If the inflation data comes above expectations, the dollar may strengthen and pull down the bottom. It is useful to be careful at this level: the daily closing over 3.370 can carry the gold to the 3,390 - 3.400 range; However, if the resistance cannot be broken, a correction below 3.340 may be inevitable.
Altında Yön Arayışı Sürüyor: Kritik Seviyeler Gözde
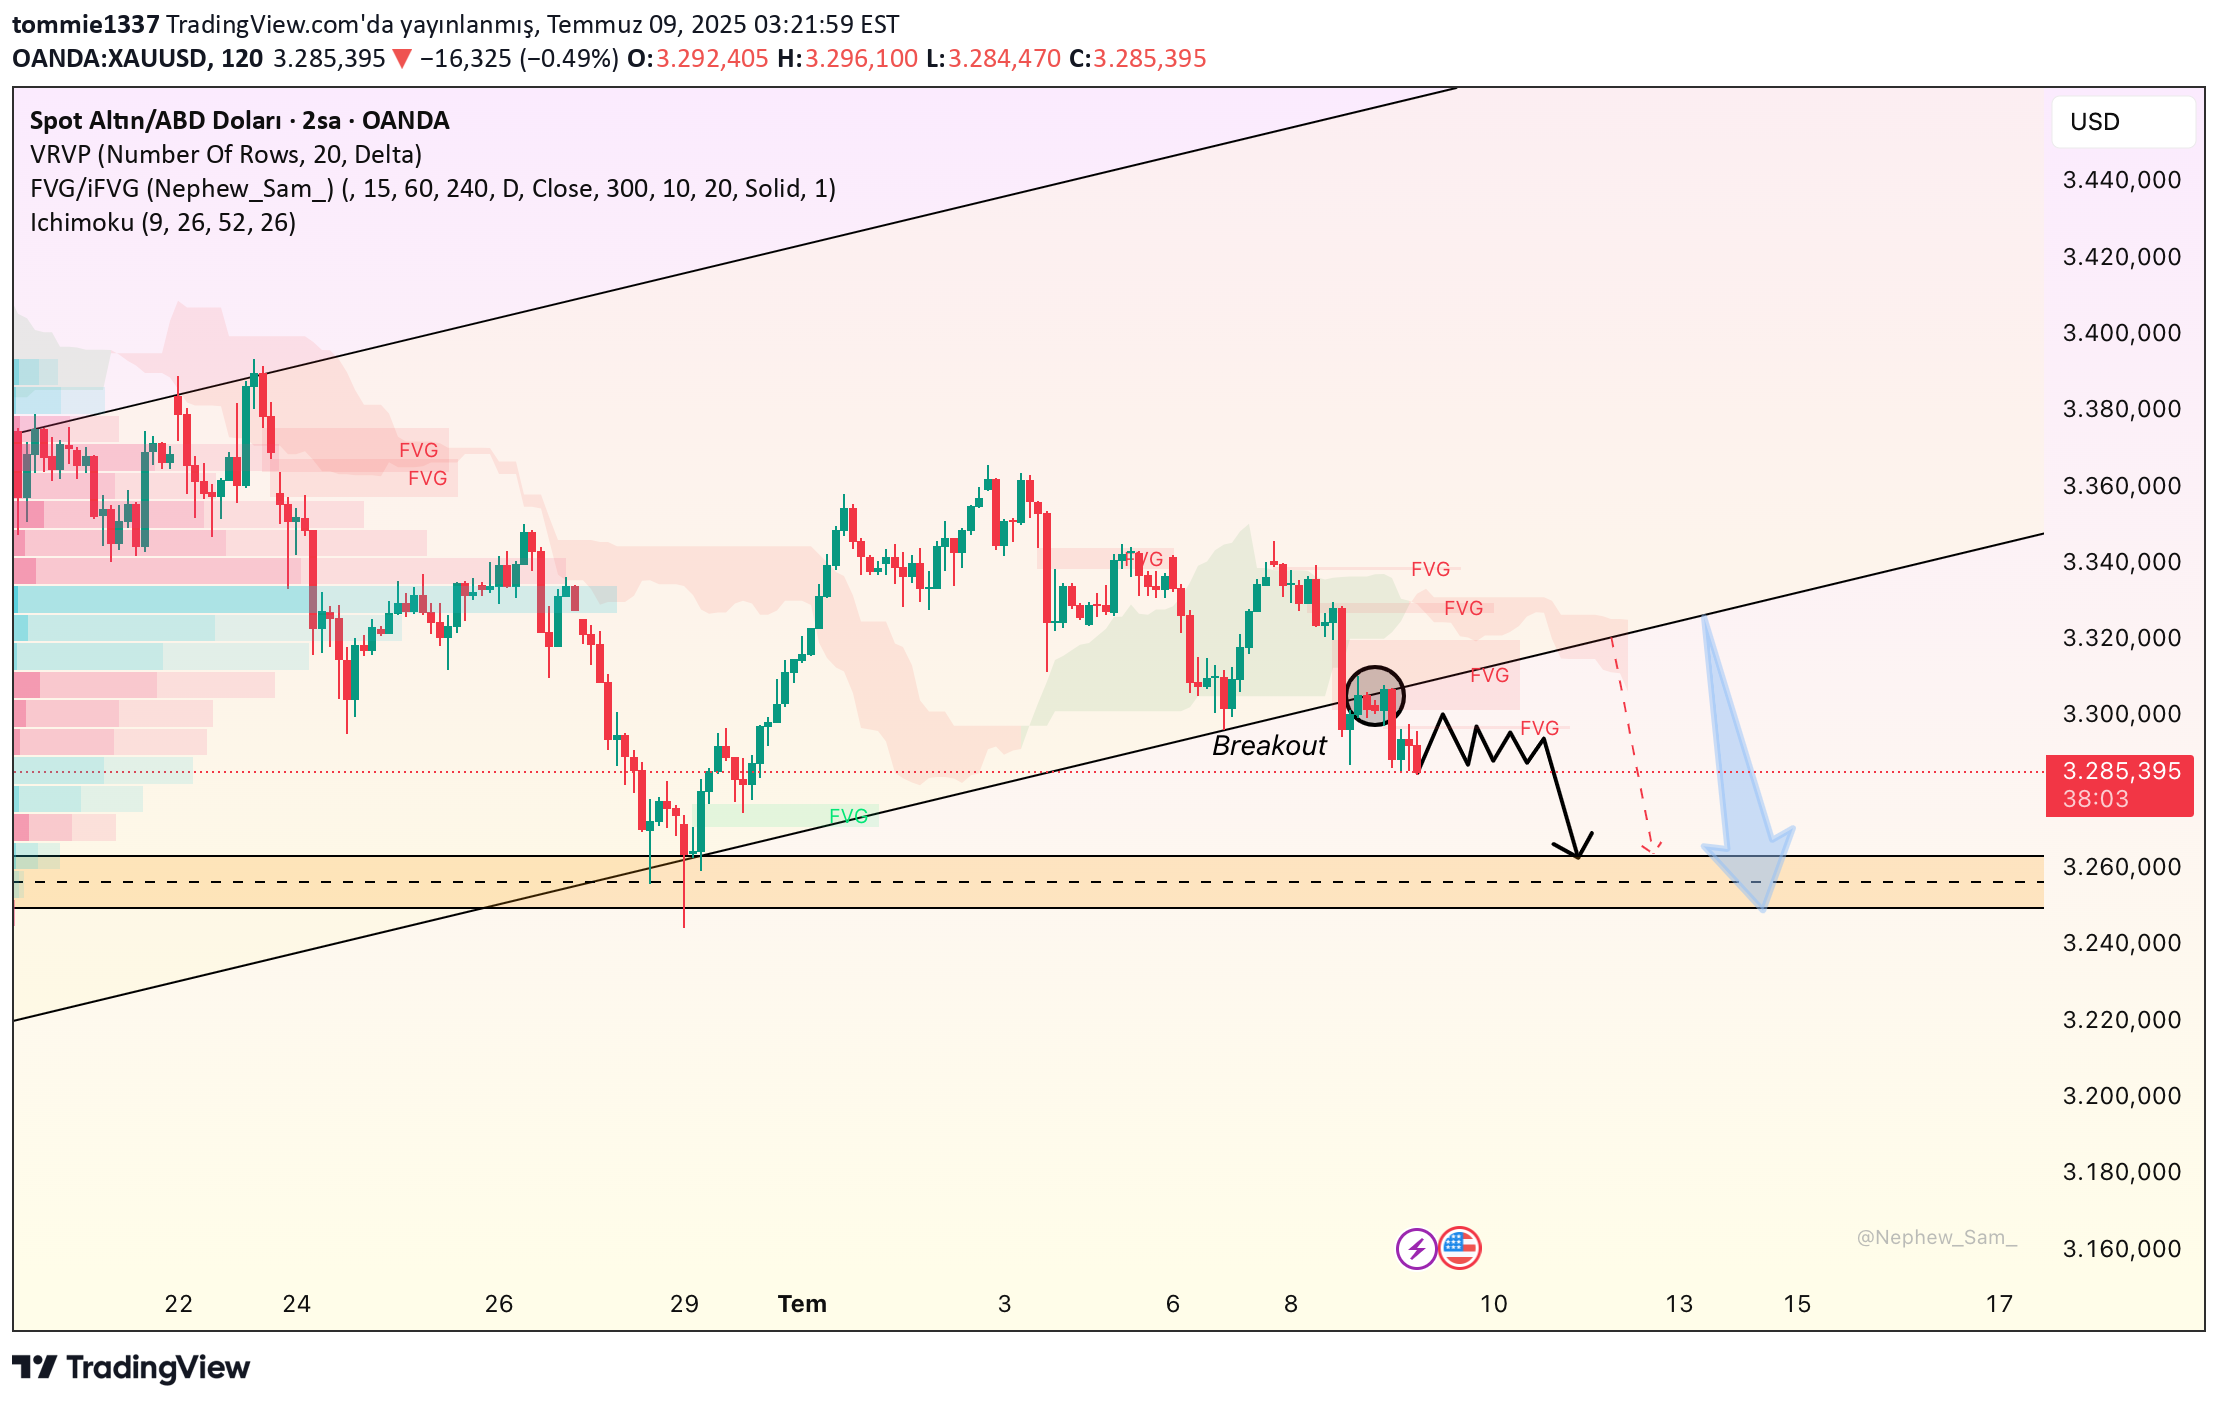
Gold prices are fluctuating in a range in recent days. While technical indicators give signals of indecision, investors are focused on the policies of the central banks. The 3,285 level is currently prominent as short -term support; If this level goes down, the decline may accelerate up to 3.250. On the other hand, a closing above 3.320 can give hope to the bulls again. Volume indicators indicate a lack of liquidity in the band - this means that volatility may increase.
Disclaimer
Any content and materials included in Sahmeto's website and official communication channels are a compilation of personal opinions and analyses and are not binding. They do not constitute any recommendation for buying, selling, entering or exiting the stock market and cryptocurrency market. Also, all news and analyses included in the website and channels are merely republished information from official and unofficial domestic and foreign sources, and it is obvious that users of the said content are responsible for following up and ensuring the authenticity and accuracy of the materials. Therefore, while disclaiming responsibility, it is declared that the responsibility for any decision-making, action, and potential profit and loss in the capital market and cryptocurrency market lies with the trader.