
timwest
@t_timwest

What symbols does the trader recommend buying?
Purchase History
پیام های تریدر
Filter
EV Tax Credit Did Nothing For $TSLA Stock
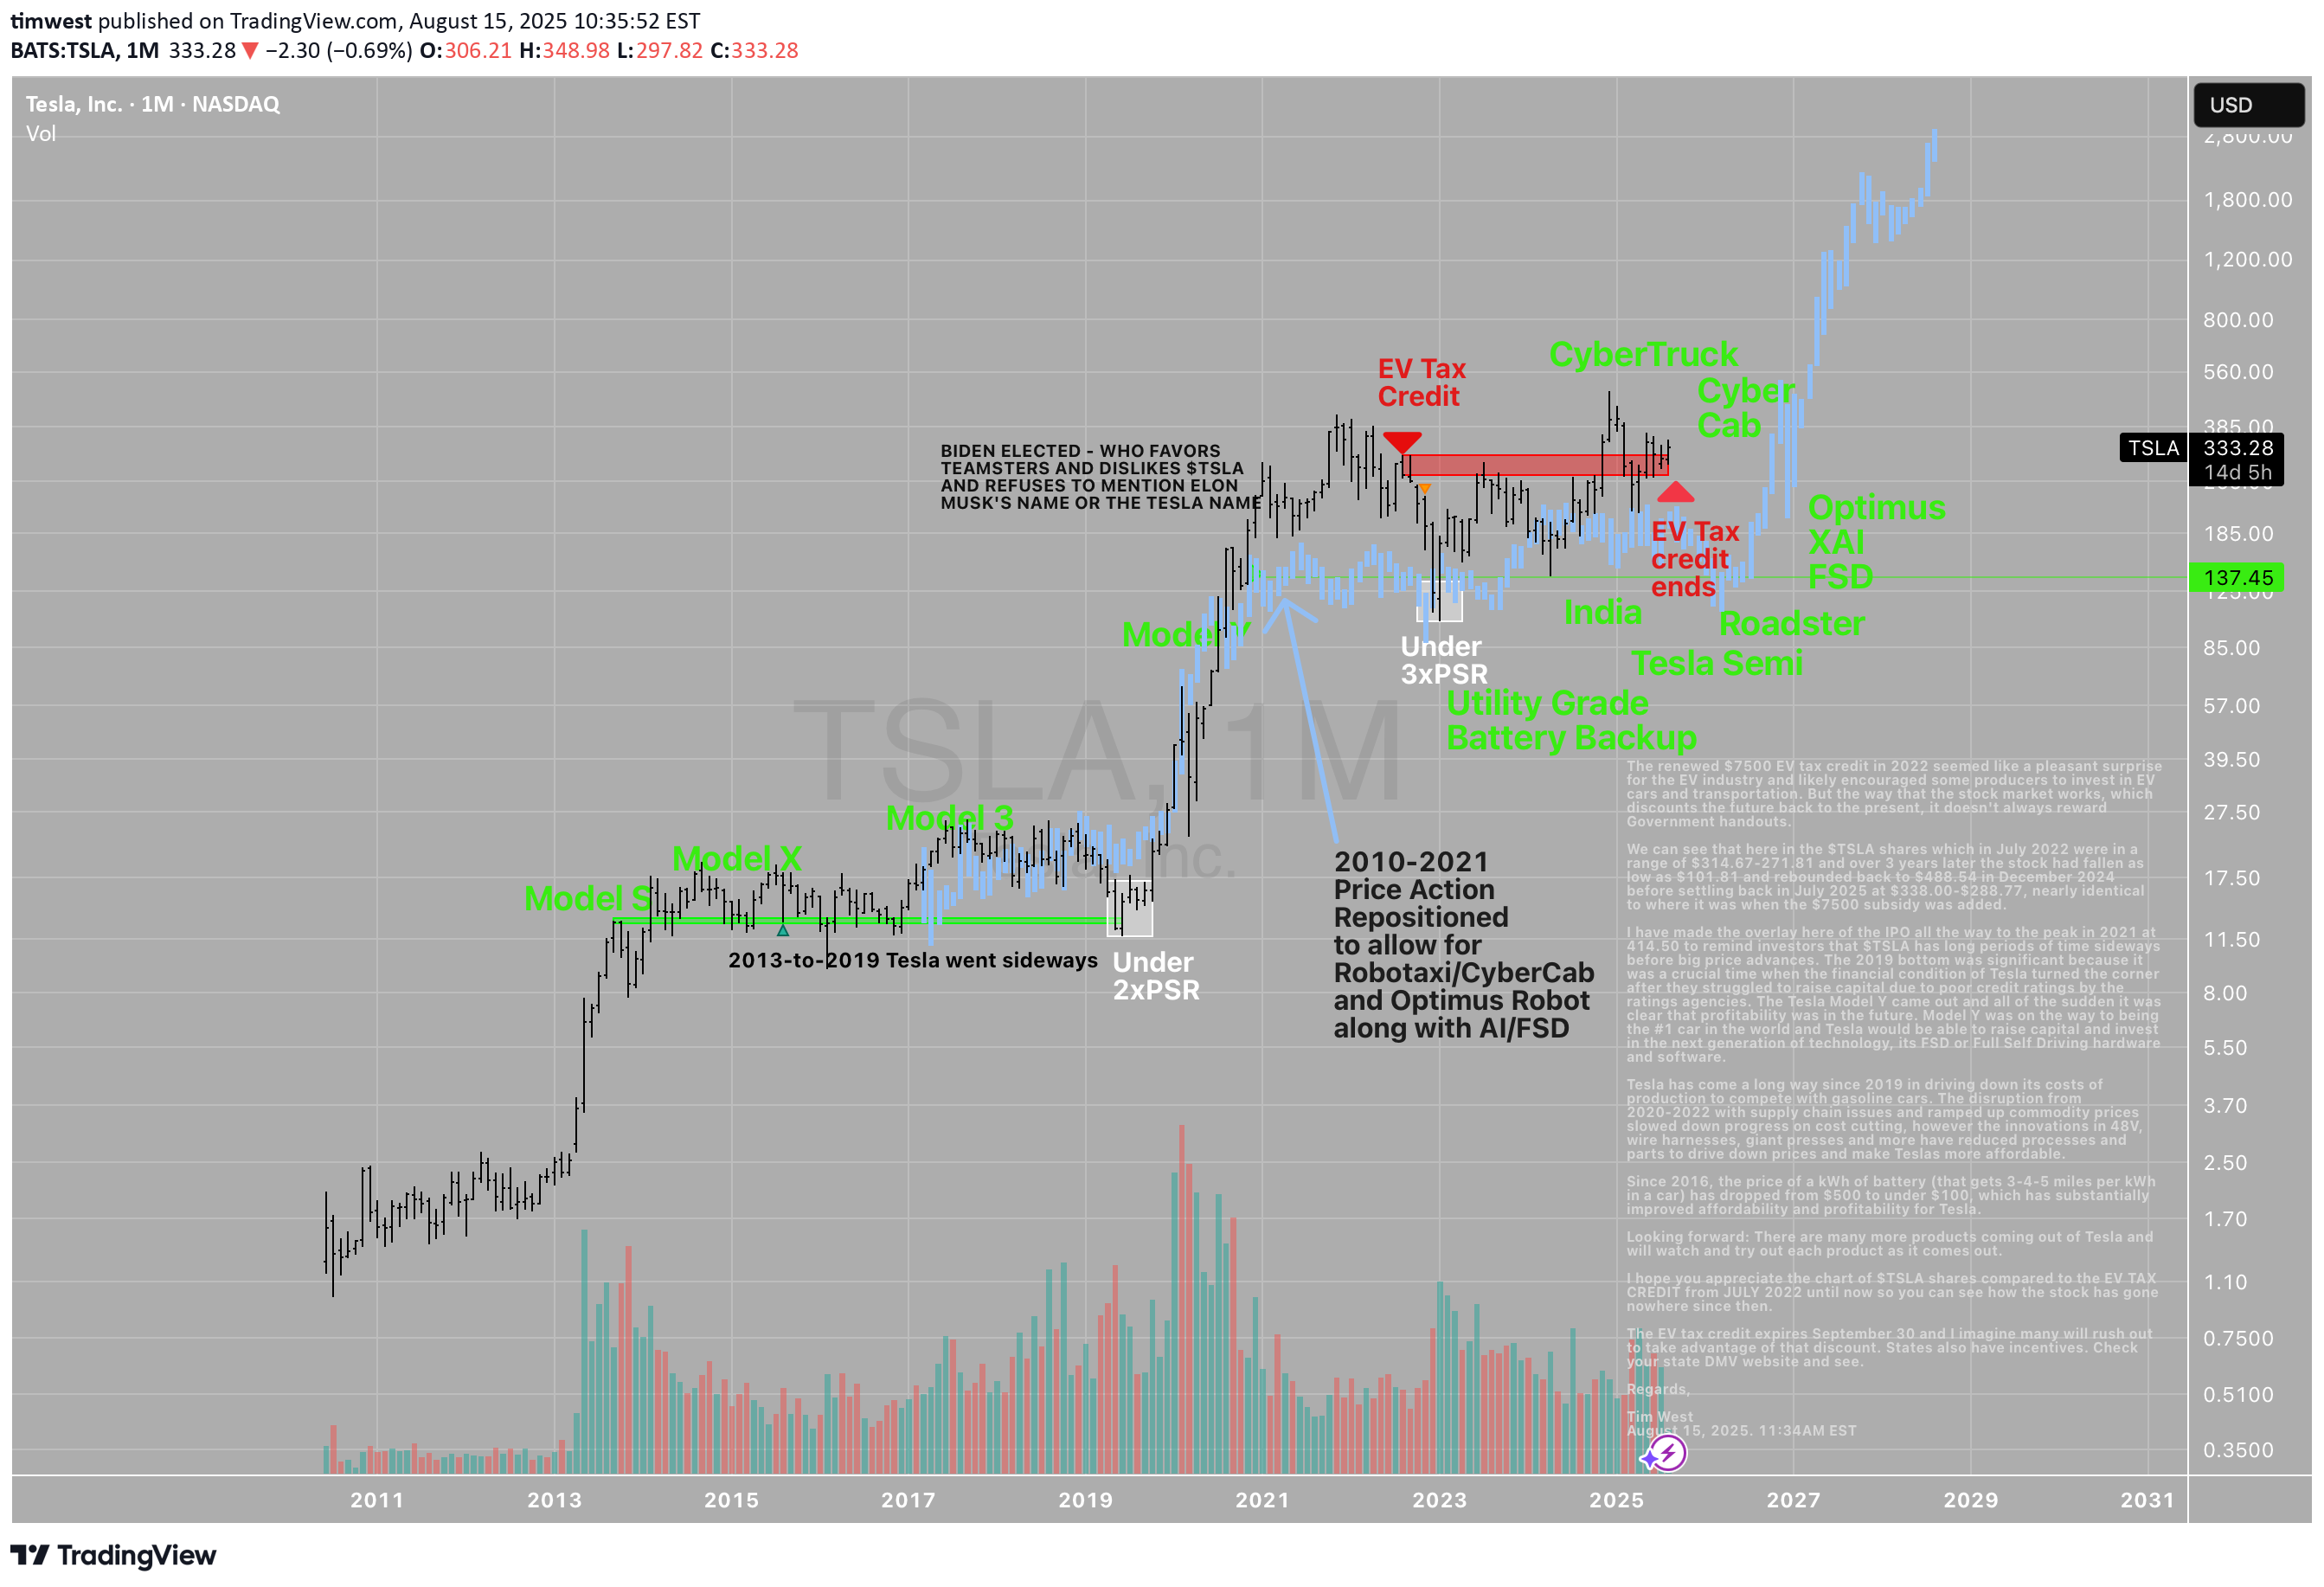
The renewed $7500 EV tax credit in 2022 seemed like a pleasant surprise for the EV industry and likely encouraged some producers to invest in EV cars and transportation. But the way that the stock market works, which discounts the future back to the present, it doesn't always reward Government handouts. We can see that here in the TSLA shares which in July 2022 were in a range of $314.67-271.81 and over 3 years later the stock had fallen as low as $101.81 and rebounded back to $488.54 in December 2024 before settling back in July 2025 at $338.00-$288.77, nearly identical to where it was when the $7500 subsidy was added. I have made the overlay here of the IPO all the way to the peak in 2021 at 414.50 to remind investors that TSLA has long periods of time sideways before big price advances. The 2019 bottom was significant because it was a crucial time when the financial condition of Tesla turned the corner after they struggled to raise capital due to poor credit ratings by the ratings agencies. The Tesla Model Y came out and all of the sudden it was clear that profitability was in the future. Model Y was on the way to being the #1 car in the world and Tesla would be able to raise capital and invest in the next generation of technology, its FSD or Full Self Driving hardware and software. Tesla has come a long way since 2019 in driving down its costs of production to compete with gasoline cars. The disruption from 2020-2022 with supply chain issues and ramped up commodity prices slowed down progress on cost cutting, however the innovations in 48V, wire harnesses, giant presses and more have reduced processes and parts to drive down prices and make Teslas more affordable. Since 2016, the price of a kWh of battery (that gets 3-4-5 miles per kWh in a car) has dropped from $500 to under $100, which has substantially improved affordability and profitability for Tesla. Looking forward: There are many more products coming out of Tesla and will watch and try out each product as it comes out. I hope you appreciate the chart of TSLA shares compared to the EV TAX CREDIT from JULY 2022 until now so you can see how the stock has gone nowhere since then. The EV tax credit expires September 30 and I imagine many will rush out to take advantage of that discount. States also have incentives. Check your state DMV website and see. Regards, Tim West August 15, 2025. 11:34AM EST
Gold is surging while Crude Oil is lagging

Here is a ratio chart of Gold XAUUSD and Crude Oil USOIL.Historically you can see it goes to extremes. Especially in 2020 when crude oil went to zero (and negative). I cut that spike out of the chart so hopefully it shows here.When the Global Financial Crisis in 2008-2009 hit, crude oil hit $140 and gold was low which set up the bottom of this chart on the lower-left. Crude was expensive and gold was cheap.The opposite happened during Covid when crude plunged and gold stayed relatively calm. These are generational trades that can make traders rich but they take too long for the average small investor to stay focused and take advantage of these setups.With Gold now at the upper end of the range of this ratio, it is time to start looking elsewhere to protect your wealth.Can this ratio continue higher? Yes, of course. I point it out as a starting point for your trading. If you are just getting long gold up here now, you need to understand where the historical range is for this ratio and decide if you want energy to keep you warm and let you travel or do you want a store of money. It is always a trade-off between the two. You can't live with only one of these commodities.Cheers.Tim12:33PM EST, October 22, 2024
$AAPL finished 19 weeks of rally from its 19 week mode
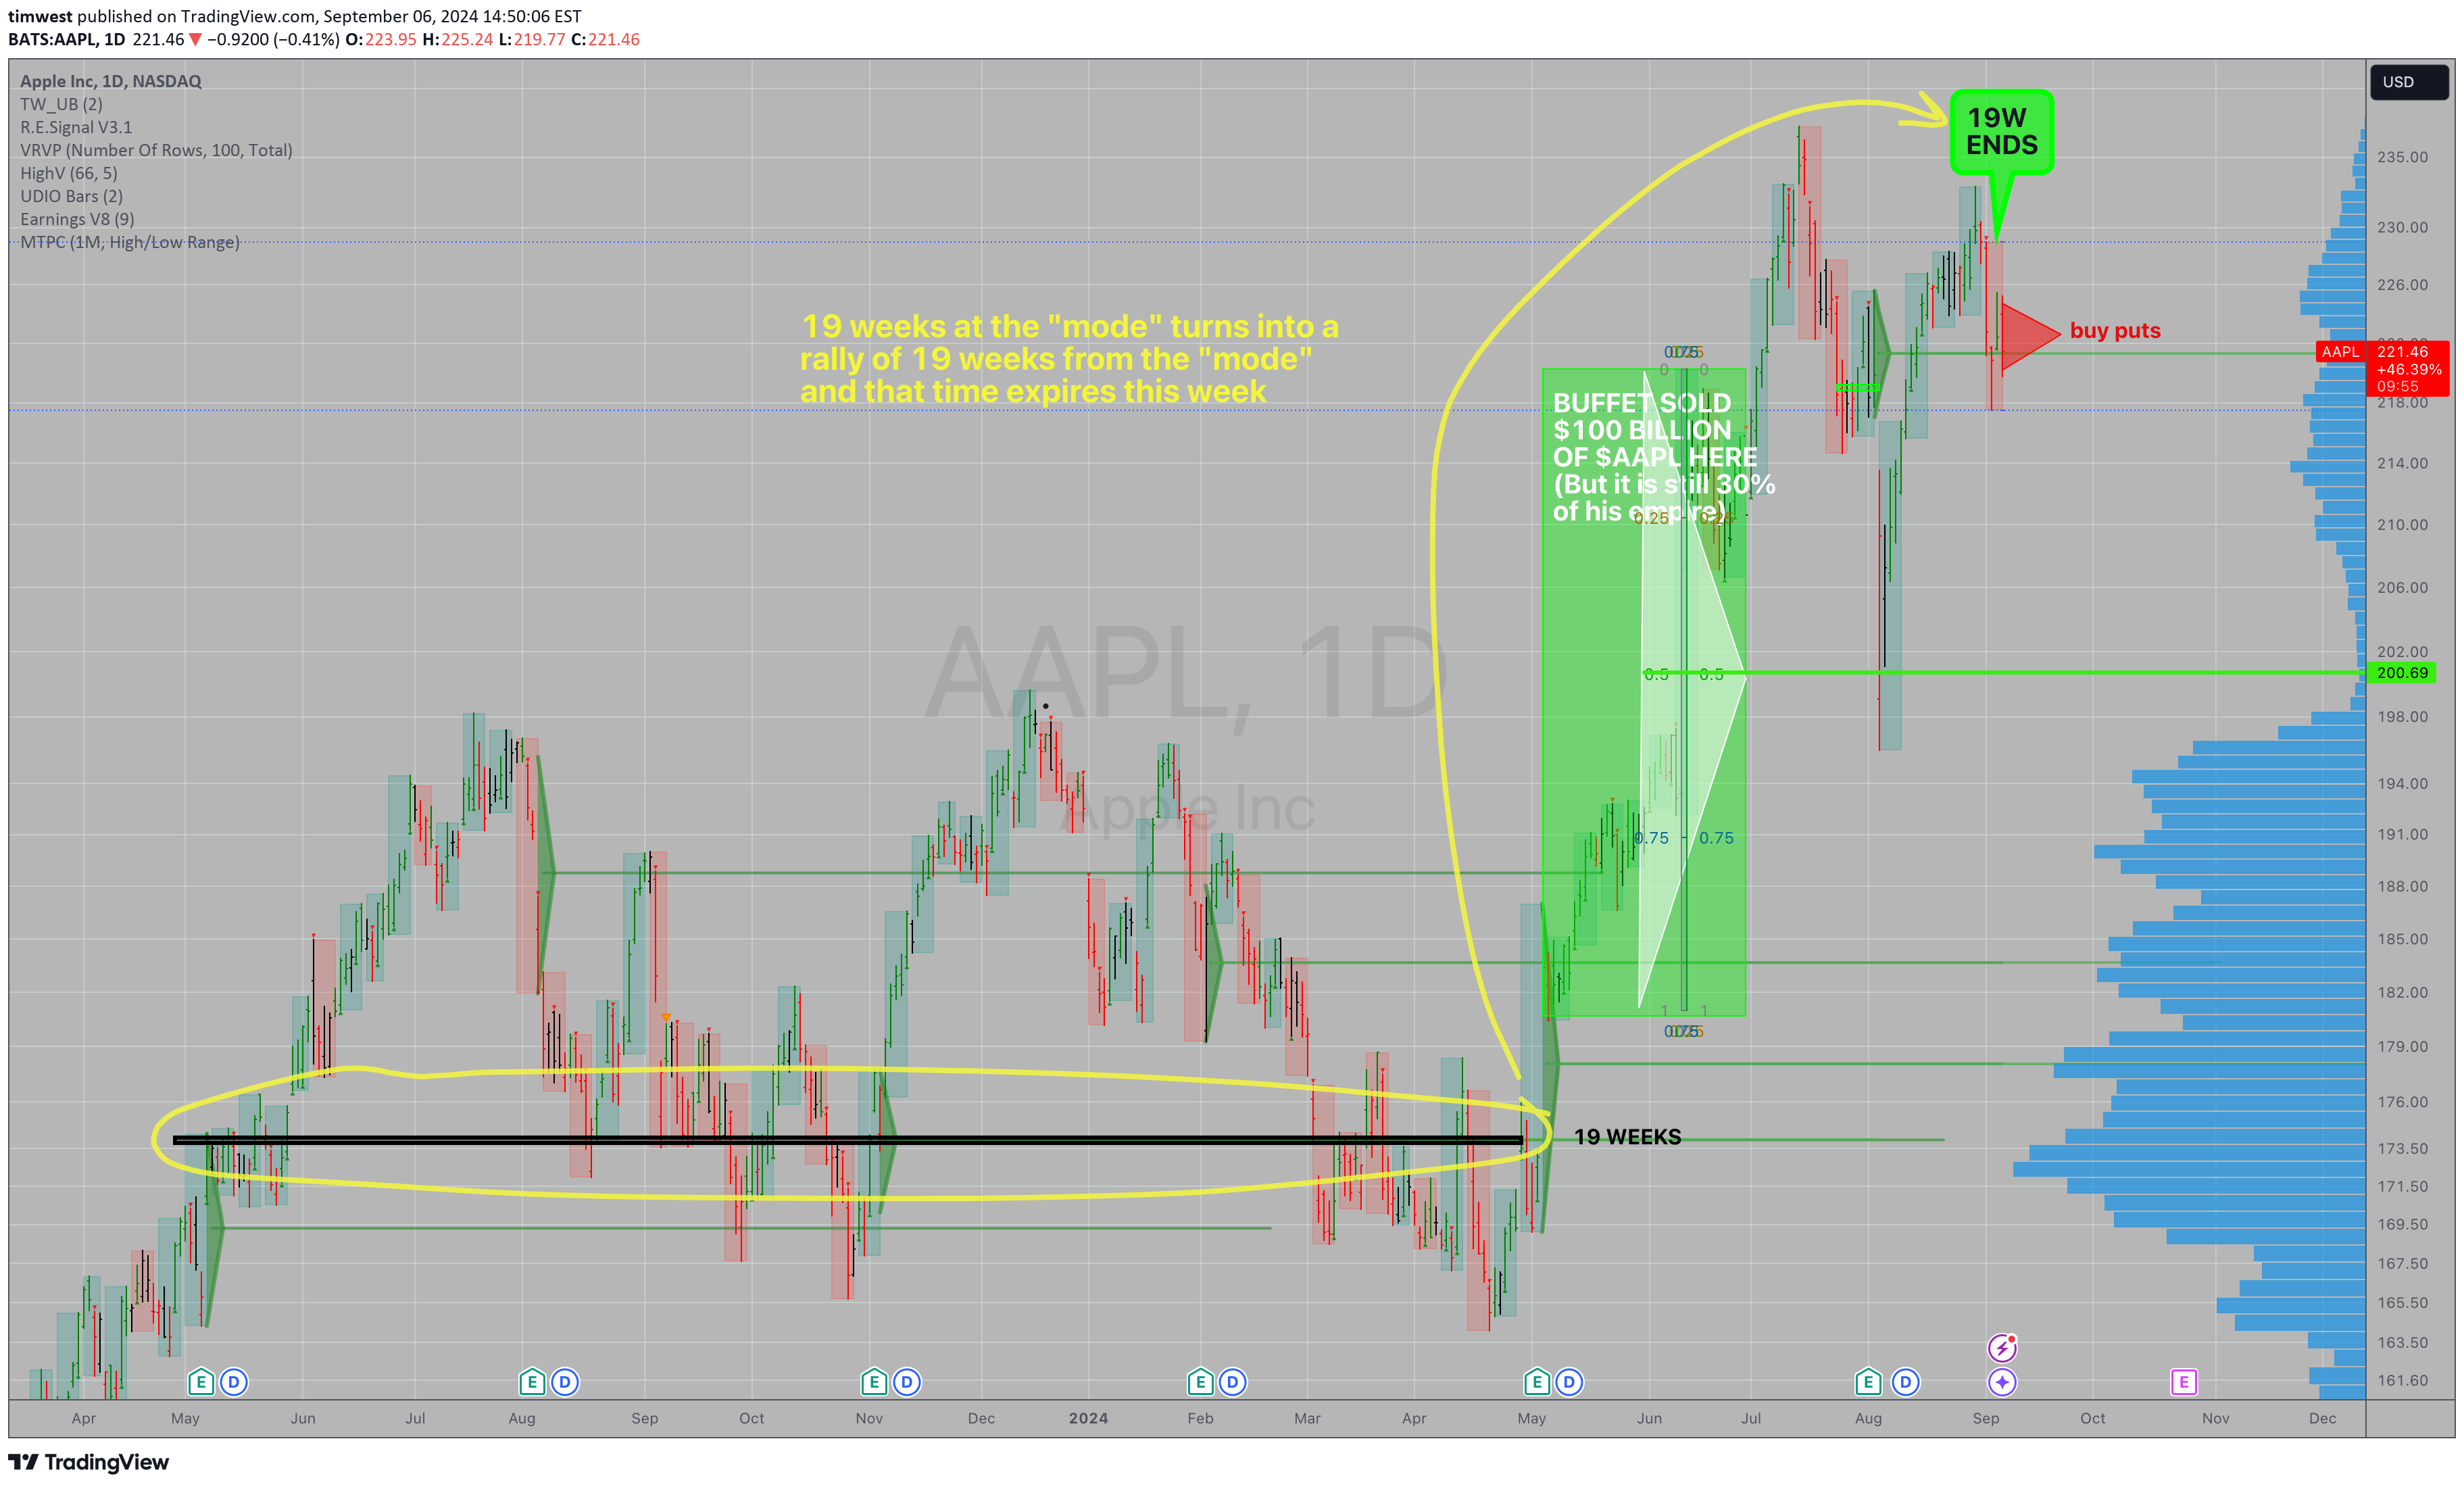
AAPL is already IN a weekly downtrend. AAPL is below the mode since the high AAPL peaked 7 weeks ago AAPL had a weekly range expansion down this week to trigger a sell signal AAPL had a RESZ rally into 50-75% resistance this week after RgExp down Stop loss $226, downside $195 I also labeled Warren Buffett's sale of $100 billion worth of AAPL , but he also still has a 30% position in AAPL in his portfolio The stop is close and the downside is meaningful Granted, Apple has its new product release happening soon which will keep potential sellers from selling but it may make potential buyers hold off on buying Time will tell Tim 3:47PM EST 9/6/2024 $220.85 last -1.53
$QQQ Nasdaq with Rate Hiking Cycle Dates
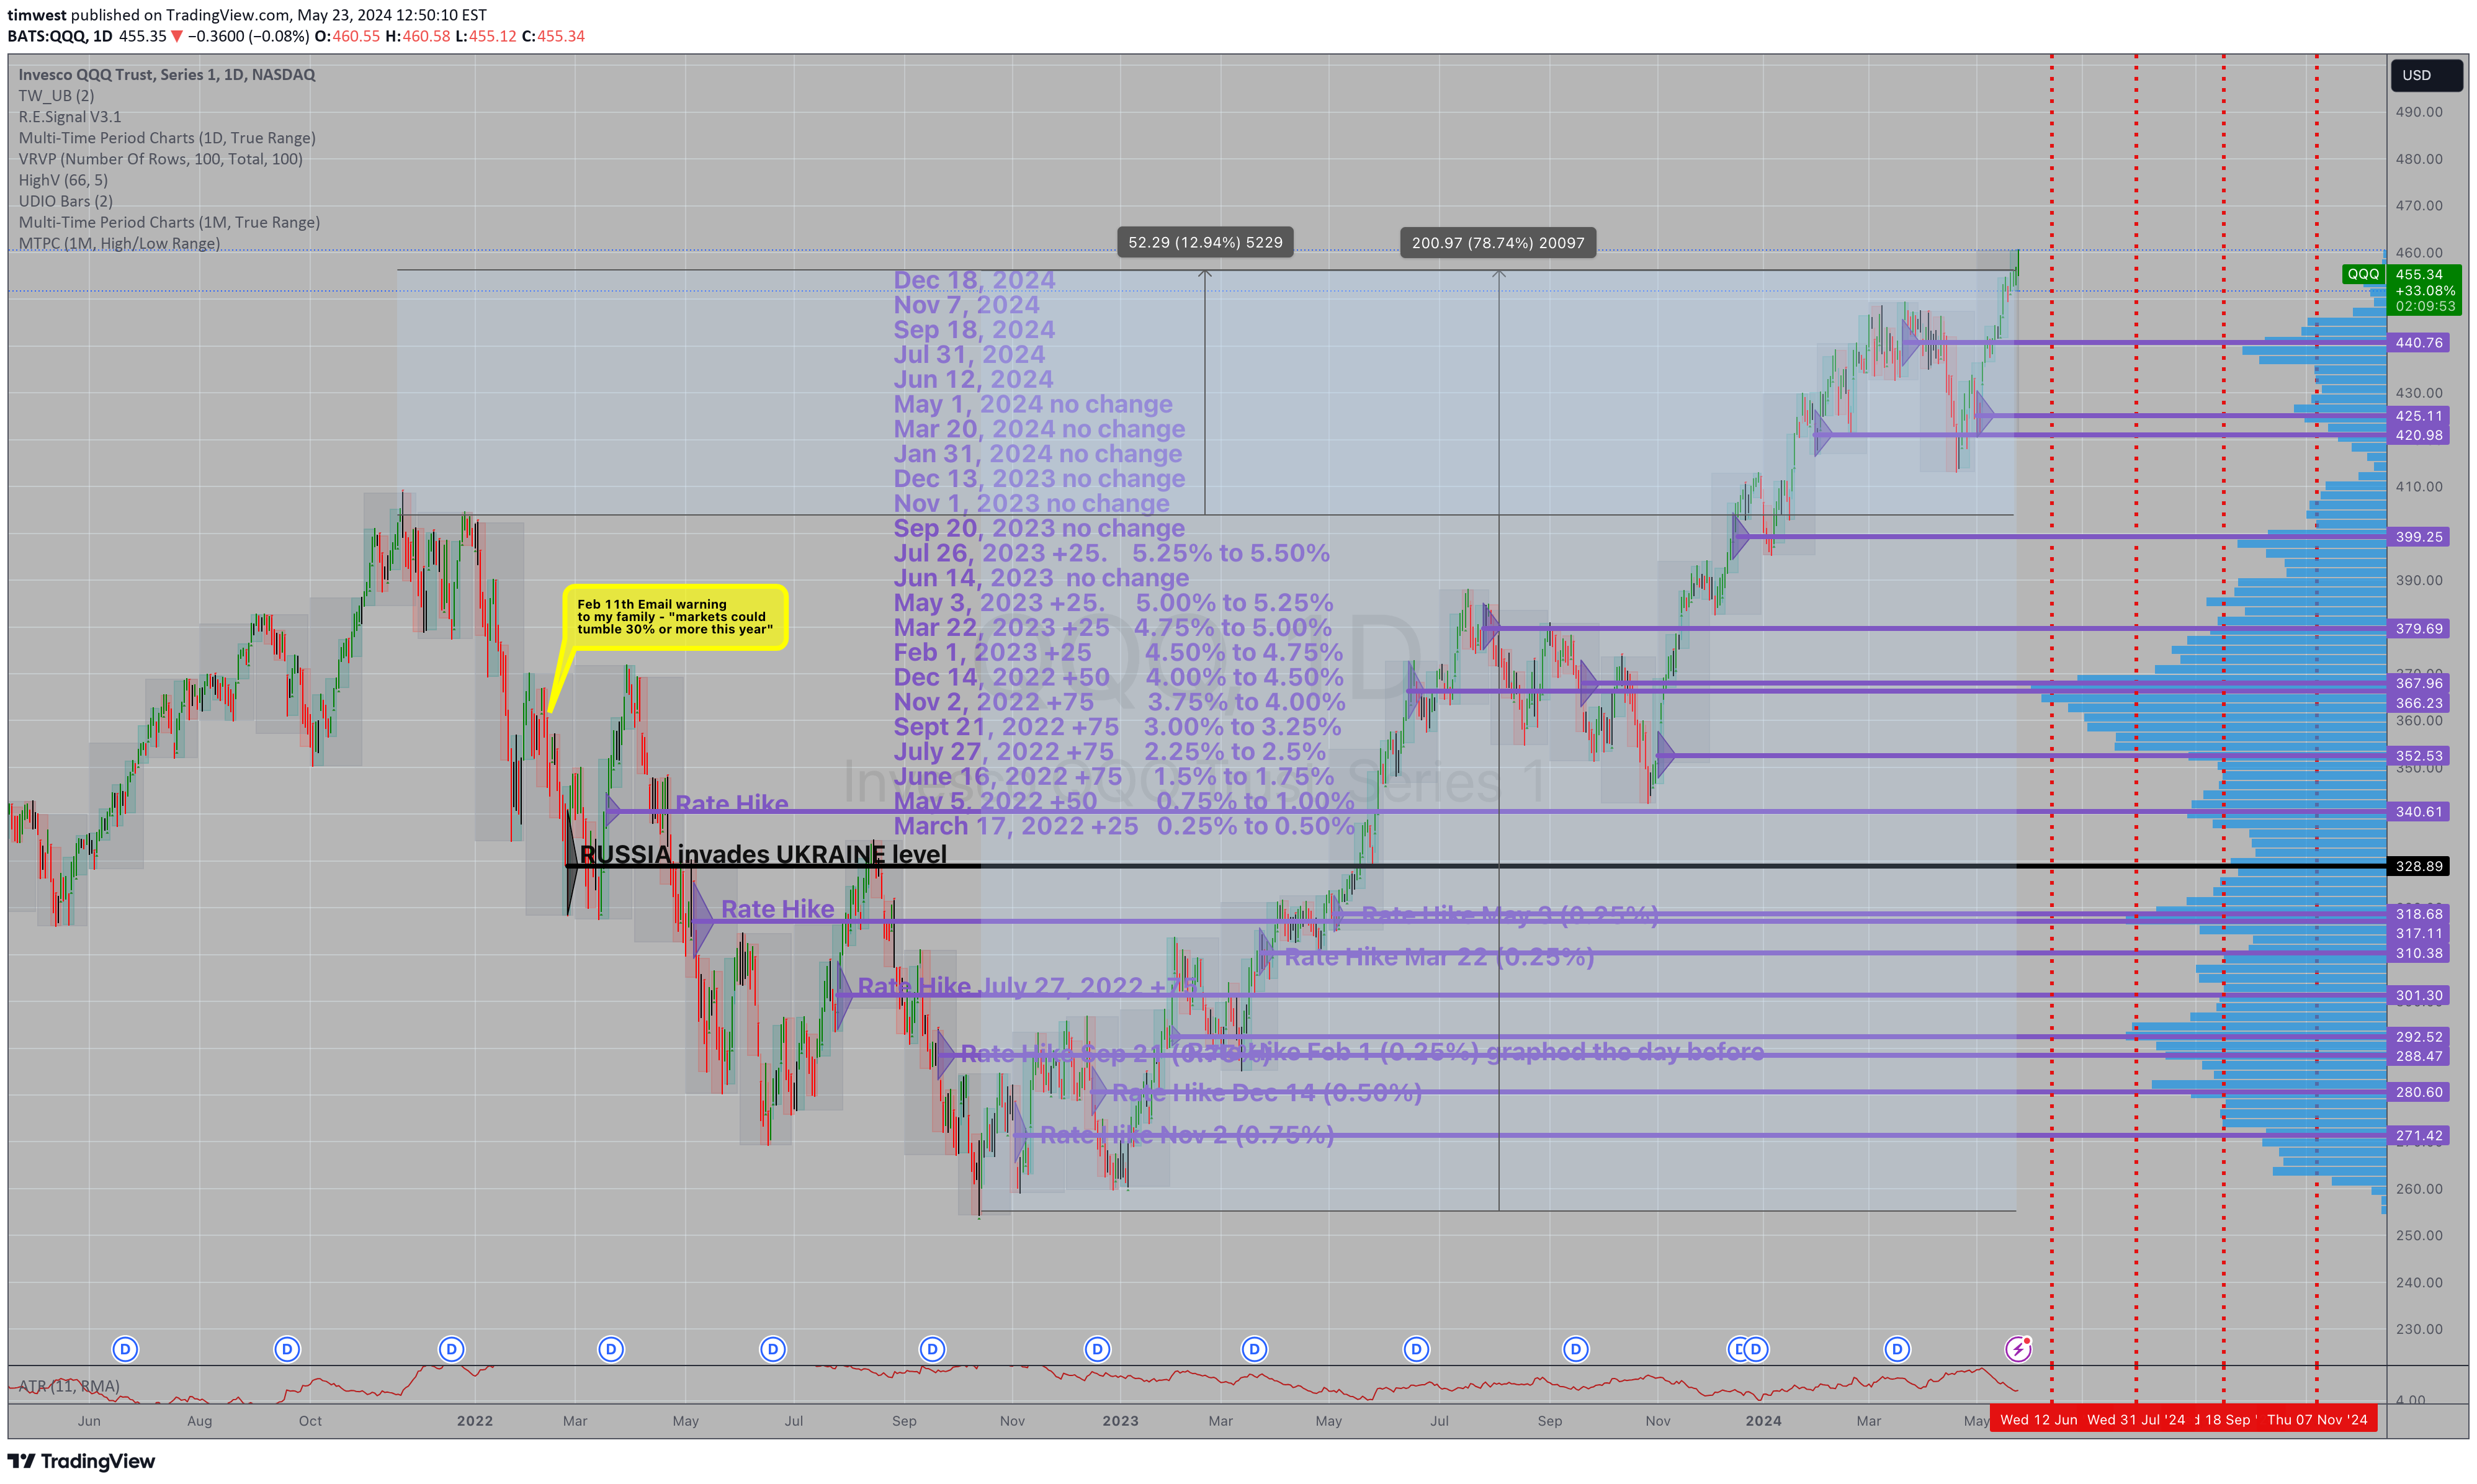
Going along with my usual 'Key Hidden Levels' in the markets perspective that NEWS is an important price level to mark on charts so it is visible to everyone, I have created the update to the "Rate Hiking Cycle" chart. The purple triangles and lines are the range of the day of the announcement and the mid-point of the day plotted horizontally forward. With this data you can see how past levels where the Fed Rate Decision occurred has provided either support or resistance to the movement of the market. Typically it hasn't been as obvious the the observer of a chart all by itself without these markings. At some point these important news levels will be visible for all of us investors so we can see and understand more quickly how the market is absorbing or dealing with the news. I hope you enjoy this chart an continue to update it for yourself. I will work to get these dates into the system so you can all see them on every chart. Wishing you all the best in your investing and trading. Tim 1:48PM, Thursday May 23, 2024Notice the pullback in the market QQQ to the last Fed Rate Decision level? You NEED to have this information or you are flying blind in the market. July 22, 2024 2:56PM ESTMore updated chart of the Fed Rate Announcement Levels I can post this the day after each FED announcement. 9/24/2024 4:32PM EST Tim
Disclaimer
Any content and materials included in Sahmeto's website and official communication channels are a compilation of personal opinions and analyses and are not binding. They do not constitute any recommendation for buying, selling, entering or exiting the stock market and cryptocurrency market. Also, all news and analyses included in the website and channels are merely republished information from official and unofficial domestic and foreign sources, and it is obvious that users of the said content are responsible for following up and ensuring the authenticity and accuracy of the materials. Therefore, while disclaiming responsibility, it is declared that the responsibility for any decision-making, action, and potential profit and loss in the capital market and cryptocurrency market lies with the trader.