
teconlab
@t_teconlab

What symbols does the trader recommend buying?
Purchase History
پیام های تریدر
Filter
teconlab
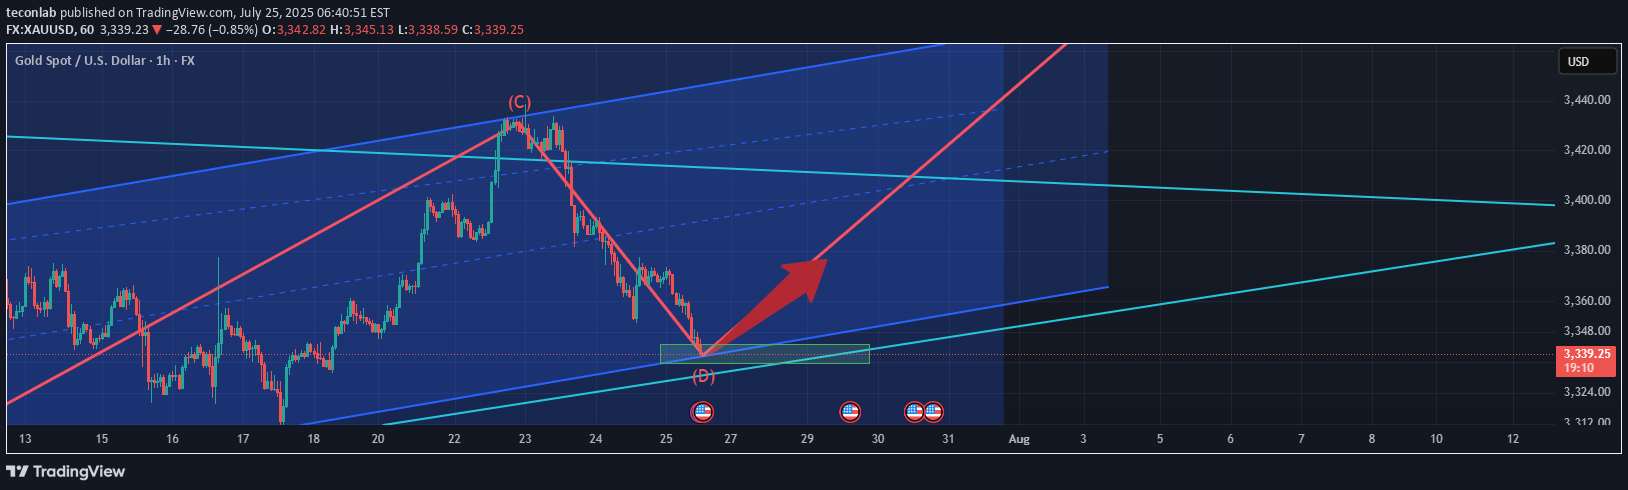
Minor dip to 3330~3320, then skyrocketing to the Moon!

Hello Traders, The first wave of the uptrend is complete. The second wave will dip to 3330~3320, followed by the third wave uptrend. Check the reference signal for take-profit levels. Upcoming Macro Events : - U.S. CPI (August 12): The main catalyst for volatility, likely to impact USD and real yields. A higher-than-expected CPI could strengthen gold, while a soft print might pressure the bull case. - RBA Rate Decision (August 12): A dovish outcome could weaken the USD, indirectly supporting gold. - Global Data (GDP, PPI): China’s economic data and UK GDP could influence risk sentiment and USD strength. Gold is in a critical phase with bullish technical setup and positive sentiment, but volatility is expected due to key macro events. Traders should focus on support levels, monitor the CPI data, and remain cautious of bearish reversals if the consolidation fails.Perfect touch. Holding Long position can take some days. Stop loss will move to the enterpoint. If the next drop happens The next BuyLimit orders are at 3327, 3323, 3320TP hit. Great profit
teconlab
Roadmap to 3982: Key Long Entries and Profit Zones

The initial long entry zone is between 3290 and 3275 . From this range, an uptrend is expected to begin, targeting 3416 , which is our first exit point to close the initial long position. After that, we wait for the next long entry , ideally around 3333 to 3319 . A new upward movement from this range is expected to reach 3455 . At this level, we continue to hold the position while placing the stop loss at the entry level to protect profits. The next take profit target is 3650 , which may be reached by the end of 2025 or in 2026. The final target is 3982 , which is likely to be hit in 2026, as the market may not have enough strength to reach it in 2025.The market has moved as expected so far. Our first take-profit target is around 3414, and we will buy again during the next dip.
teconlab
Gold Approaching a Key Support, Potential Long Opportunity
Hi, The setup is pretty clear from the chart. Price has reached the lower boundary of the channel, which could offer a solid entry point for a long position, with a defined stop loss and take profit.There is a possibility of Drop more than this level. So the Long pisition is closed.
teconlab
First Drop to 3307–3289, Then Buy for the Next Uptrend

Our system has identified a strong short signal across short-term, medium-term, and long-term timeframes as of July 3, 2025, with confidence levels above 89%. All durations are aligned, indicating a synchronized momentum shift. Entry Point : 3354.43 Short-Term TP : 3334.30 Medium-Term TP : 3320.89 Long-Term TP : 3307.47~ 3289 📉 Based on the current market structure and signal convergence, TeconLab expects XAUUSD to drop into the 3307–3289 range, where a potential reversal zone is likely to form. 🛡️ Safest Entry for Buy: The 3289 level is considered the most favorable area for entering long positions after the expected correction completes. 📈 After reaching this zone, our system anticipates a new uptrend to begin, offering a fresh opportunity for upside movement. The TP Zigzag path displayed on the chart outlines the projected decline with target steps, preparing for a potential bullish reversal afterward.Short positions have reached their take-profit levels, and long positions have been opened.
teconlab
Riding Wave (5) Toward 3380 Before ABC Correction

📌 Market ContextThe current chart shows wave (5) of a larger impulsive structure is still in progress, with price rising from the bottom of wave (4). After a clean wave (1)-(2)-(3)-(4), the market is now pushing upward, targeting the 3380 zone as a likely wave (5) completion.🟢 Entry Levels (End of Wave 2)First Entry: 3298Second Entry: 3279.6Update for signal:Close you Long positions and wait for the Entry point:3290~3280
teconlab
XAUUSD Long Setup – Watching 3247 Entry Zone

Hi Traders,The recent price action of XAUUSD has been a bit complex, but I hope this idea turns out to be profitable for everyone.Feel free to share your thoughts if you see anything differently.What I find most interesting is the entry zone around 3247–3245. If we take the wave count starting from May 15, 2025 (3120.76) and consider wave 5 to be completed on June 15, 2025 (3451.52), then wave 2 should ideally retrace to around 3247.On top of that, wave C of wave 2 seems to follow a clean 1–2–3–4–5 structure. If we treat the current move as a downtrend, wave 5 would likely complete right at 3247, which I find both accurate and technically compelling.I'll be watching 3247 closely and plan to go long from there.I’ll share the updated version of the signal shortly.
teconlab
[XAUUSD] GOLD – Bullish Setup in Play

🟡 *Key Context* - Geopolitical calm (Trump ceasefire remarks) lowered risk aversion, pushing Gold down — but key support is holding.- Fed uncertainty continues, yet technicals point to a possible reversal.📉 *Price Structure* - Price dropped into a falling wedge, testing 3285–3295 (H4 demand zone).- RSI bullish divergence + harmonic ABCD pattern seen on 30m.📌 *Trade Setup – Long Bias* 🔹Entry: 3285–3295 zone (watch for bullish candle confirmation) 🔹Stop Loss: Below 3280 (structure invalidation) 🔹Target 1: 3320–3330 🔹Target 2: 3390 (longer-term move)⚠️ Volume confirmation is key — wait for breakout strength. Avoid entries during news events. Risk must be managed tightly.#XAUUSD #Gold #TradingSignal #TeconLab #BuyTheDip
teconlab
XAUUSD: Post-Crash Buy Zone and Bullish Setup

Here's a structured breakdown of today's #XAUUSD (Gold) trading idea, including key levels, wave structure, and risk/reward zones for both short-term and swing traders.---🔹 Key Technical Zones (H1 & H4 Charts)Support Levels- 3,303 USD – Key support on H4; potential false breakout area - 3,324–3,327 USD – Wave 5 completion zone and high-probability buy area - 3,337–3,343 USD – Entry zone for early bullish setups - 3,340–3,345 USD – Clean long entry; targeting up to 3,450 USD Resistance Levels- 3,363–3,365 USD – Sell zone tied to wave 4/5 overlap - 3,375–3,383 USD – Mid-range resistance; key for short-term profits - 3,405–3,500 USD – Long-term bullish targets; includes ATH region ---🔹 Wave Count (H1 Structure)- Wave X – Recent sell-off ended a potential uptrend; suggests ongoing correction (WXY) - Wave Y – 5-wave drop toward 3,363–3,365 USD; acting as a short-term sell zone - Wave Z – Expected final leg down toward 3,324–3,327 USD (ideal buy zone) - Retracement Setup – Anticipated bullish retrace post-wave 5, with targets back at 3,363–3,376 USD ---🔹 Order Blocks & FVGsBuy Zones- 3,343–3,330 USD – FVG within an order block; strong bullish entry area - 3,319–3,317 USD – Deep support with short-term target at 3,349 USD Sell Zone- 3,363–3,365 USD – Key area for short setups, with targets at 3,342–3,330 USD ---🔹 Strategy & Key Takeaways1. Bullish Structure Still Intact - Rising channel remains valid on H4 - Holding 3,303 USD is critical for confirming bullish continuation 2. Trade Setup - Long entries near 3,340–3,345 USD - Target range: 3,450 USD and above - Tight stops around 3,325 USD recommended for low-risk exposure 3. Wave Completion Zones in Play - Monitor 3,324–3,327 USD (buy zone) and 3,363–3,365 USD (sell zone) for end-of-wave activity 4. Risk Management Is Key - Scale into positions - Respect intraday volatility and breakout traps
teconlab
Gold Market Analysis: Key Levels and Trends 23/June/2025

Core Themes 1. Geopolitical Drivers: Escalating tensions in the Middle East, particularly U.S. airstrikes on Iranian nuclear facilities, are fueling gold's "flight to safety" narrative. Analysts anticipate sustained demand for gold amid potential regional conflict. 2. Technical Bullish Bias: Gold is in an uptrend, respecting key support levels and forming higher lows within an ascending channel. Breakouts above resistance (e.g., $3,439–$3,501) could validate further gains. 3. Correction vs. Continuation: While short-term pullbacks are expected (e.g., testing $3,320–$3,200), the broader bullish structure suggests corrections are temporary. ---Key Technical Levels Support: - Immediate: $3,320 (lower channel boundary) - Deeper: $3,200 (critical level; break could extend corrections) Resistance: - Short-term: $3,378–$3,382 (upper channel boundary) - Mid-term: $3,439 (previous resistance; target for bullish continuation) - Long-term: $3,501 (potential next resistance; requires strong momentum) Fibonacci Retracements: - 23.6%: $3,360–$3,370 (support zone for long entries) - 50.0%: $3,400 (conservative take-profit target) - 61.8%: $3,415 (key golden ratio level; likely Wave (5) peak) - 100%: $3,435–$3,440 (aggressive target; upper channel line) ---Trade Setups & Strategies 1. Long Entry: - Target: $3,400–$3,435 (Fibonacci extensions) - Stop-Loss: Below $3,315 (break of key support) - Entry Zone: $3,360–$3,370 (near ascending channel support and 23.6% Fib) 2. Bullish Confirmation: - Breakout Above $3,378: Validates continuation toward $3,439 and $3,501. - Volume Increase: Confirms strength at key levels (e.g., $3,360–$3,370). ---Risk Management & Key Risks - Stop-Loss Placement: - Longs: Below $3,315 (protects against deeper corrections). - Shorts: Above $3,350 (avoids false breakouts). - Volatility: Monitor geopolitical developments (e.g., U.S.-Iran escalation) that could trigger rapid price swings. - Correction Risks: If gold fails to hold $3,320, a drop to $3,200 may occur, requiring tighter stops. ---Fundamental Outlook - Safe-Haven Demand: Rising tensions are likely to sustain gold's appeal. - Inflation & Rate Outlook: Persistent inflation concerns and potential rate cuts (if economic data weakens) could further support gold. - Negotiation Risk: De-escalation or Iran's concessions may pause the bullish momentum, leading to a reversal toward $3,340–$3,320. ---Conclusion Gold is in a strong bullish phase, driven by geopolitical risks and technical structure. Traders should focus on buying dips near $3,320–$3,370 with targets toward $3,439–$3,501. However, monitor the $3,320 support and geopolitical developments closely. If the trend breaks, a retest of $3,200 could follow. Always use stop-losses to manage risk. Final Note: The market is highly volatile, so position sizing and risk management are critical. Stay alert for news updates and technical confirmations (e.g., closes above $3,378)Stop loss is set at the entry point: 3359. I'm holding the position toward 3436, and will adjust the take profit based on market conditions. The final target is 3499.
teconlab
XAUUSD (Gold) Technical Analysis – June 13, 2025

🔍 Key ObservationsUptrend Structure:Gold remains in a rising channel (higher highs, higher lows).$3265 flipped from support to springboard for continued upside.$3365–$3375 has held as a solid support zone.Resistance Levels:💠 $3400 – psychological barrier and channel resistance.💠 $3480 – upper channel boundary, long-term target.💠 $3490 – historical ATH, may trigger pullbacks.Macro/Geopolitical Drivers:Israel–Iran tensions and soft U.S. data boost safe-haven demand.Central bank accumulation reinforces bullish case.Bearish Contingency:Failure to break $3432.57 (double top) could pull price down to:🔻 $3384.83 – intermediate support🔻 $3270.06 – final downside target📈 Trade Setup – Bullish Continuation📥 Entry Zones:$3377–$3380 support area (pullback entry)OR $3400 breakout confirmation (high-volume thrust)⛔ Stop-Loss:Below $3350 to guard against fakeouts🎯 Take-Profit Targets:TP1: $3444.75TP2: $34458.44TP3: $3472.14TP4: $3490 (ATH zone)📊 Risk/Reward:Favorable 3:1 (e.g., risking $25 to gain $75 from $3375 entry)🔑 Key Levels to WatchResistance: $3400, $3432.57, $3456, $3480, $3490Support: $3384.83, $3375, $3340, $3319🧭 Sentiment & Volume CuesBullish Confirmation:Volume spike above $3365–$3400Continued soft US data / geopolitical fearBearish Signals:Weak breakout at $3432.57Breakdown below $3384.83 with low volume✅ SummaryGold maintains bullish structure. Look for long entries around $3375–$3384.83 or wait for a strong breakout above $3400. Use tight stops and monitor both technical levels and macro triggers.🛑 Disclaimer: Trade with proper risk management. This analysis reflects technical outlooks and may change based on real-time events.T1 is hitHere are new updates from TeconLab AI Mentor Platform which wanted to share with you:🔹 Market Context:Gold remains in a strong uptrend, fueled by geopolitical tensions (Israel–Iran, Ukraine), central bank demand, and cooling U.S. inflation. Safe-haven buying is pushing prices near the ATH of $3,500, with recent highs at $3,446.8.🔹 Key Levels:Support: $3,395 / $3,380 / $3,340Resistance: $3,400 / $3,432.57 (double top) / $3,444–$3,456 / $3,500Targets: $3,500 short-term | $3,600–$3,700 long-term🔹 Technical Setup:RSI: Overbought (61–66) → possible pullbacksMACD & MAs: Bullish alignmentVolume: Rising above $3,365 supports continuation🔹 Scenarios:Bullish: Break above $3,400 → Test $3,444–$3,456 → $3,500 possibleBearish: Rejection at $3,432.57 → Pullback to $3,380 or lower🔹 Trade Ideas:Buy the dip: $3,395–$3,405 → TP $3,425–$3,440Breakout entry: Above $3,400 with volumeShort setup: Rejection near $3,444 → Stop above $3,456🎯 Risk–Reward Tip: Aim for 3:1 ratio. Protect long entries below $3,350.🛑 Watch for:De-escalation in global conflictsSurprise U.S. macro dataDXY rebound pressure📌 Summary: Gold is bullish with $3,500 in focus. Pullbacks remain buyable above $3,380, but stay alert for shifts in sentiment or geopolitical developments.📎 For educational purposes only. Use proper risk management.
Disclaimer
Any content and materials included in Sahmeto's website and official communication channels are a compilation of personal opinions and analyses and are not binding. They do not constitute any recommendation for buying, selling, entering or exiting the stock market and cryptocurrency market. Also, all news and analyses included in the website and channels are merely republished information from official and unofficial domestic and foreign sources, and it is obvious that users of the said content are responsible for following up and ensuring the authenticity and accuracy of the materials. Therefore, while disclaiming responsibility, it is declared that the responsibility for any decision-making, action, and potential profit and loss in the capital market and cryptocurrency market lies with the trader.