
splitmyIVandmelt
@t_splitmyIVandmelt

What symbols does the trader recommend buying?
Purchase History
پیام های تریدر
Filter
splitmyIVandmelt
AAPL - Weekly HV/IV Perspective
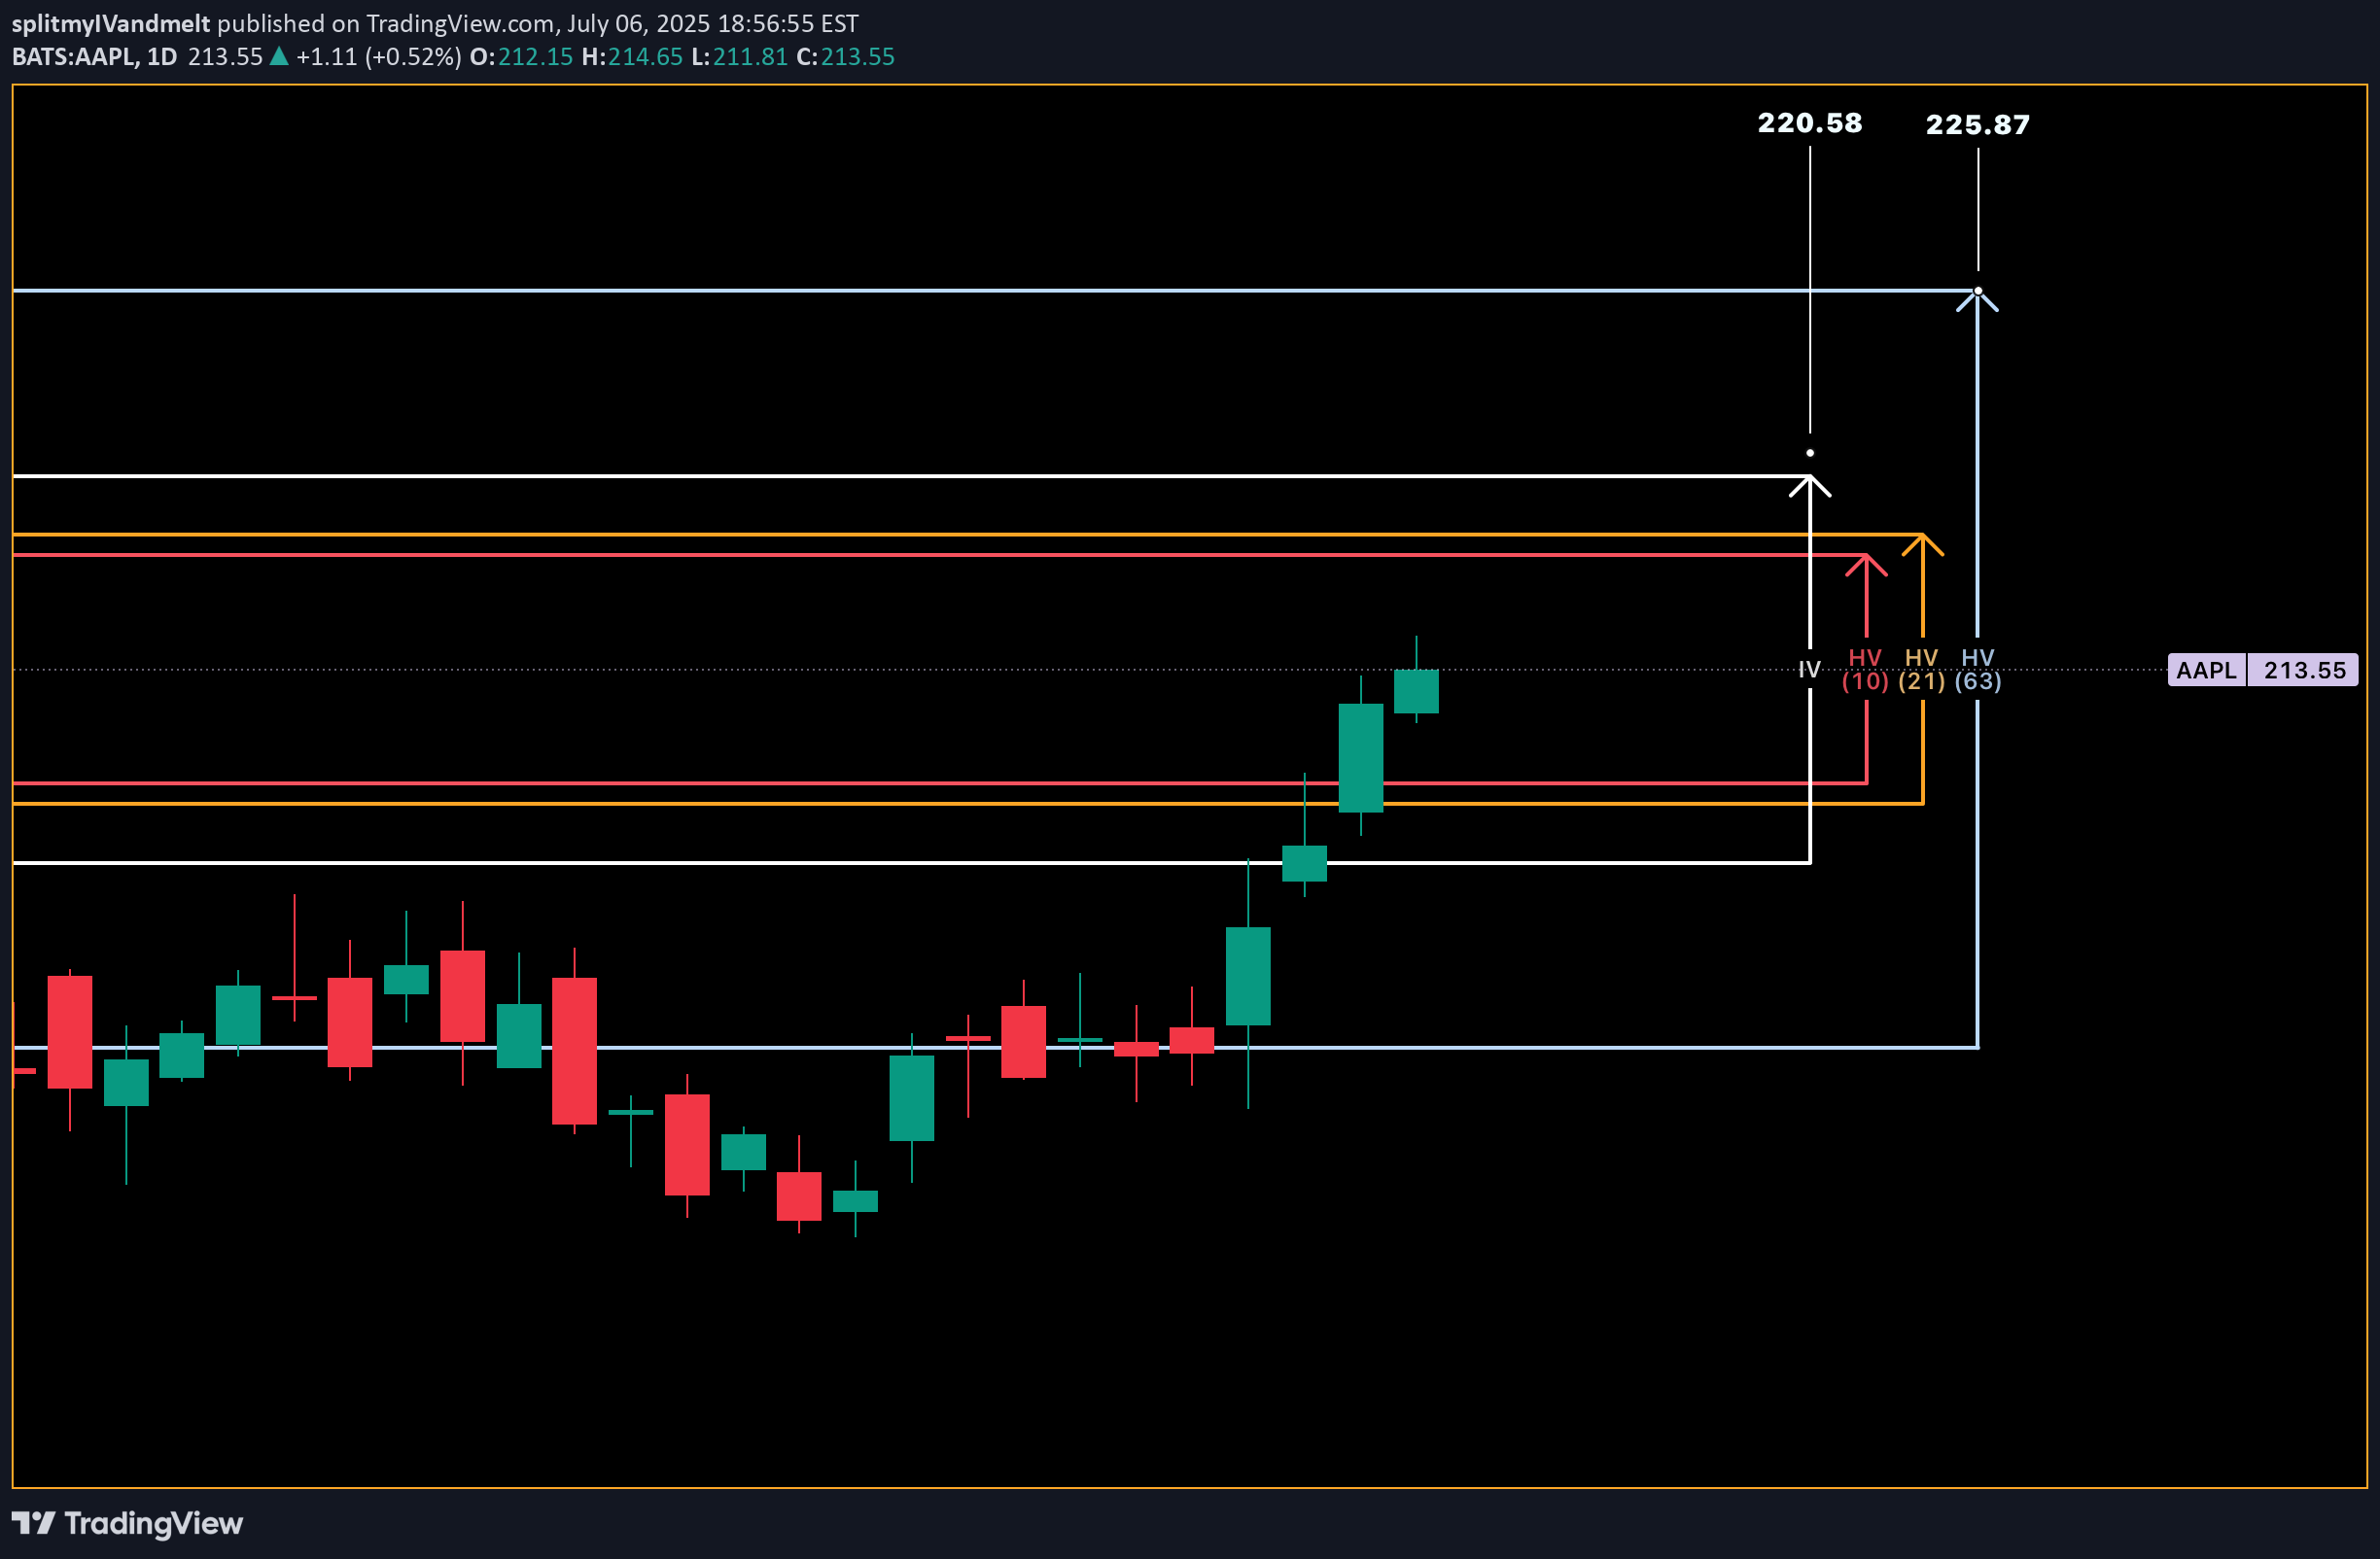
Good evening — I wanted to do one more write up with that being on AAPL as we enter the week with futures just opening. HV10 (16.58%) is trending -11.56% below IV (28.14%) showing a weekly price gap differential of -$2.89 on the stated implied move to what trending markets are doing. This current IV value entering the week sits 69% within the sliding year spectrum. Now, with Apple consolidating in range for almost eight weeks after selling off when it reached its 4T milestone in December of 2024, has now begun advancing back upwards in price. The strength here is obvious and the quality of company is well, Apple. My price targets on the week is first the upper band of stated IV ($220.58) then moving on towards the upper implied range of HV63 ($225.87). I believe the markets are going to push apple higher while balancing the indices out selling off in other areas. This would start to accelerate HV10, as it is now 91.23% coiled to its yearly lows and needs to unwind. Hopefully with a few short-term trending days increasing we find our regression. Please come back next week and see how our position and volatility progressed forward.
splitmyIVandmelt
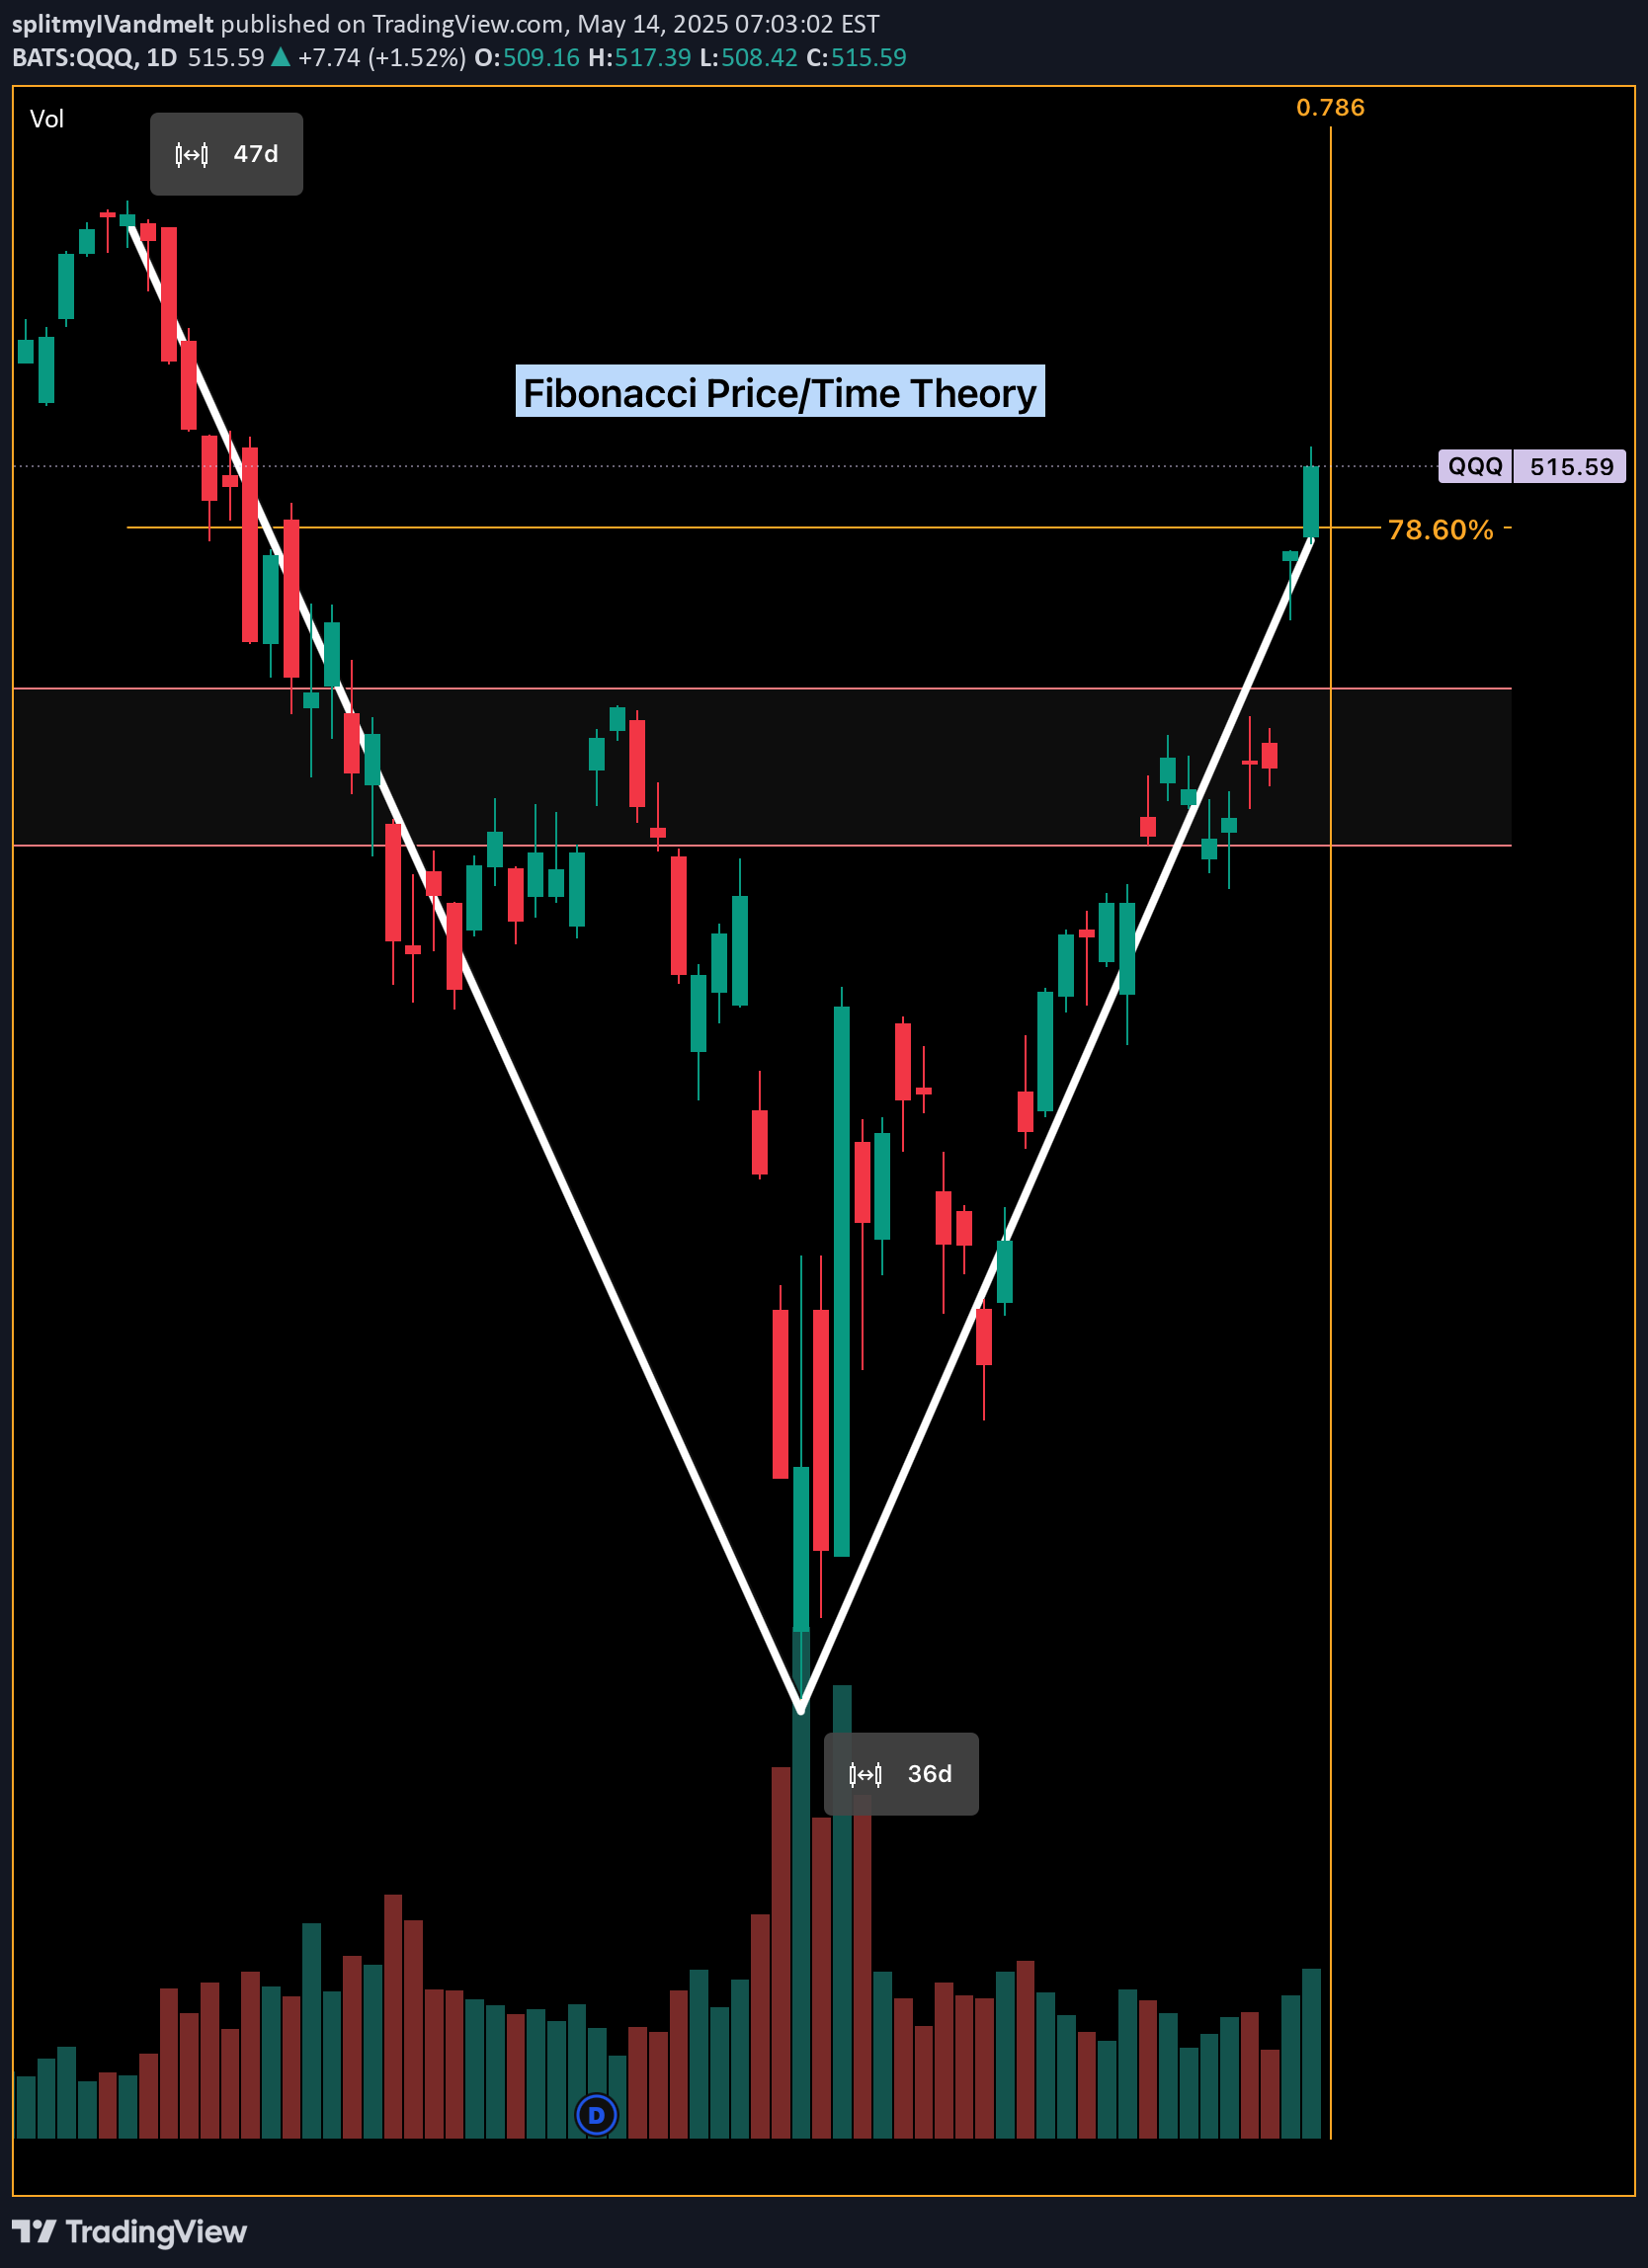
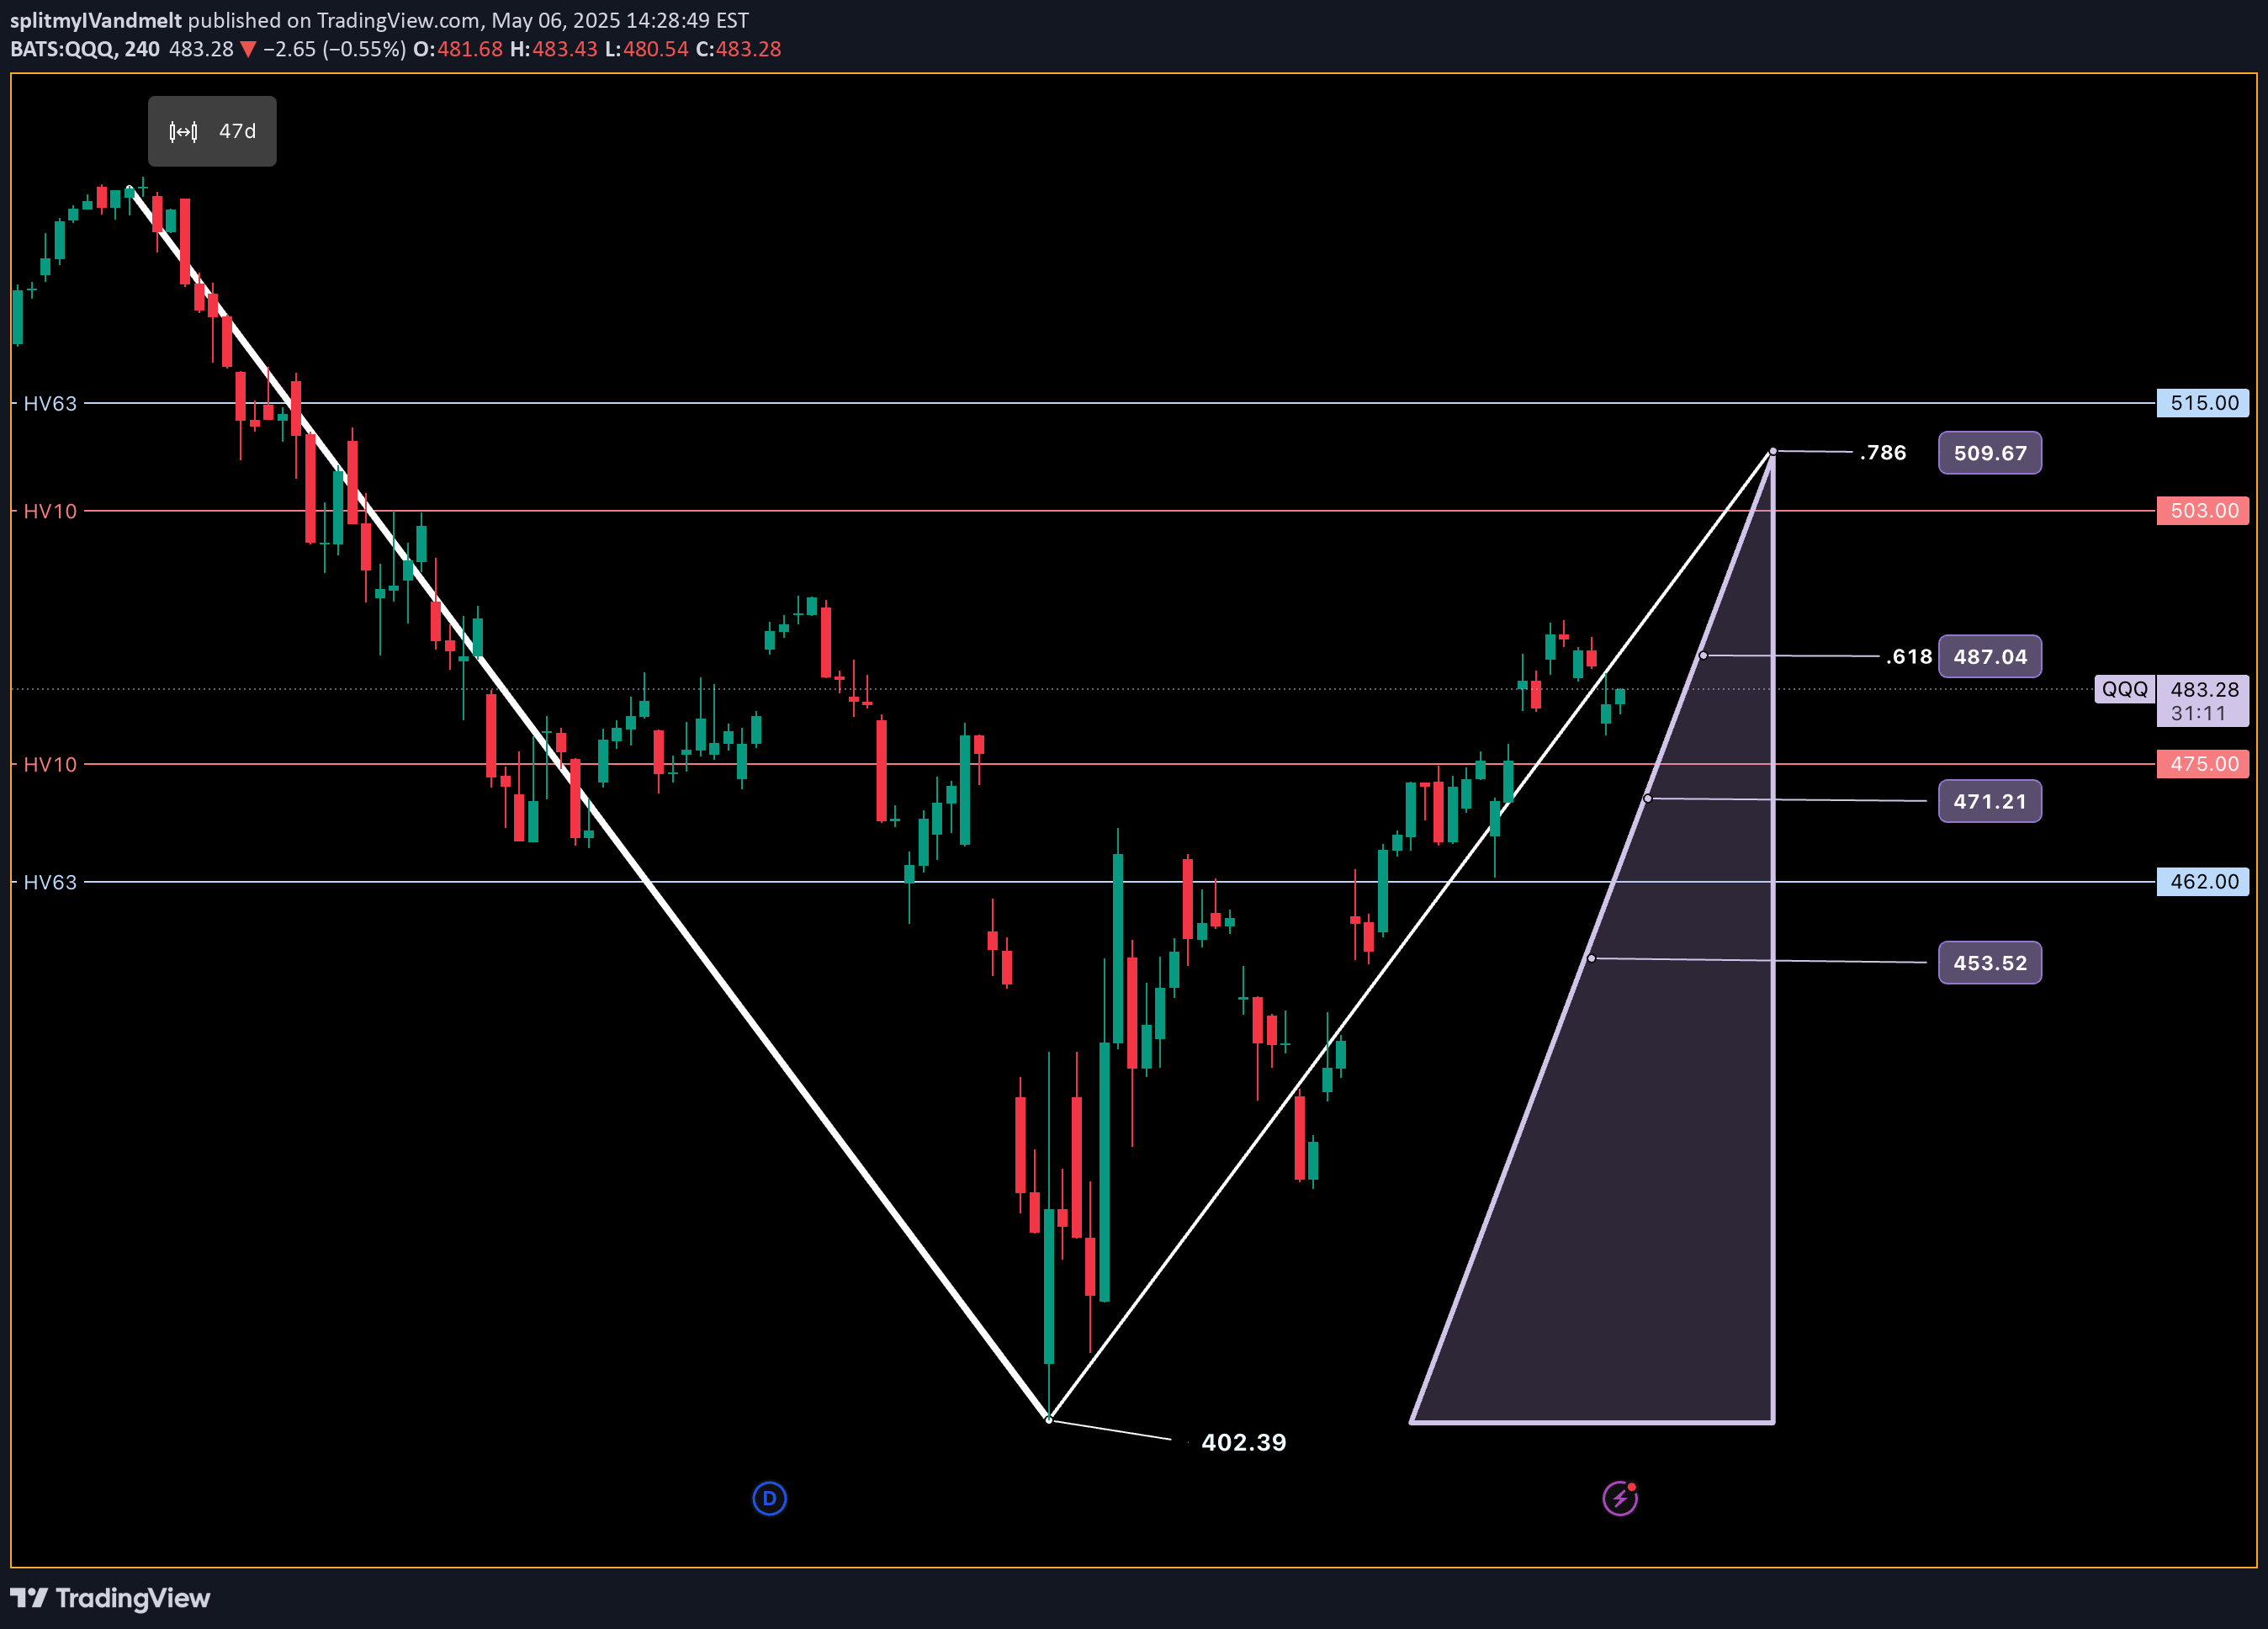
Trading the Impulse Rally Retracement — Price and Time Symmetry

The Stop Loss Triangle is back! This time with BTCUSD coming off its recent impulse rally. For those of you that aren’t familiar with my strategy — let me start from the beginning…This concept involves positioning against the opposing decline in price and time as a precursor to our theoretical projection. If the underlying enters our predetermined faded cross-section, the stop loss is triggered to prevent sideways consolidation and the erosion of contract premiums or leverage decay. This inherently ‘sclene’ triangle is constructed by drawing a straight trend line through the bottoming reversal candle and the furthest projection in price and time symmetry (78.6%) of the retracement. Once connected, draw a vertically positioned straight line from the highest or lowest point in the previously identified retracement to the bottom reversal candle area once again. To create a ‘right triangle’, now turn 90 degrees towards the final point, which is determined by the nearest projection in price and time symmetry (38.2%). This allows time after the imposed price and time date, yet not enough for premium or leverage decay to become significant. In its entirety, this forms the stop loss triangle.I encourage my followers to identify and explore the system on their own. As always, feel free to ask me anything related to it. We’ll follow along and you’ll be amazed at the precision of Fibonacci symmetry.CHEERSOn the brink, this may be a good example of stopping out..let's see what happens!And that folks, is a break into the stop loss section.
splitmyIVandmelt
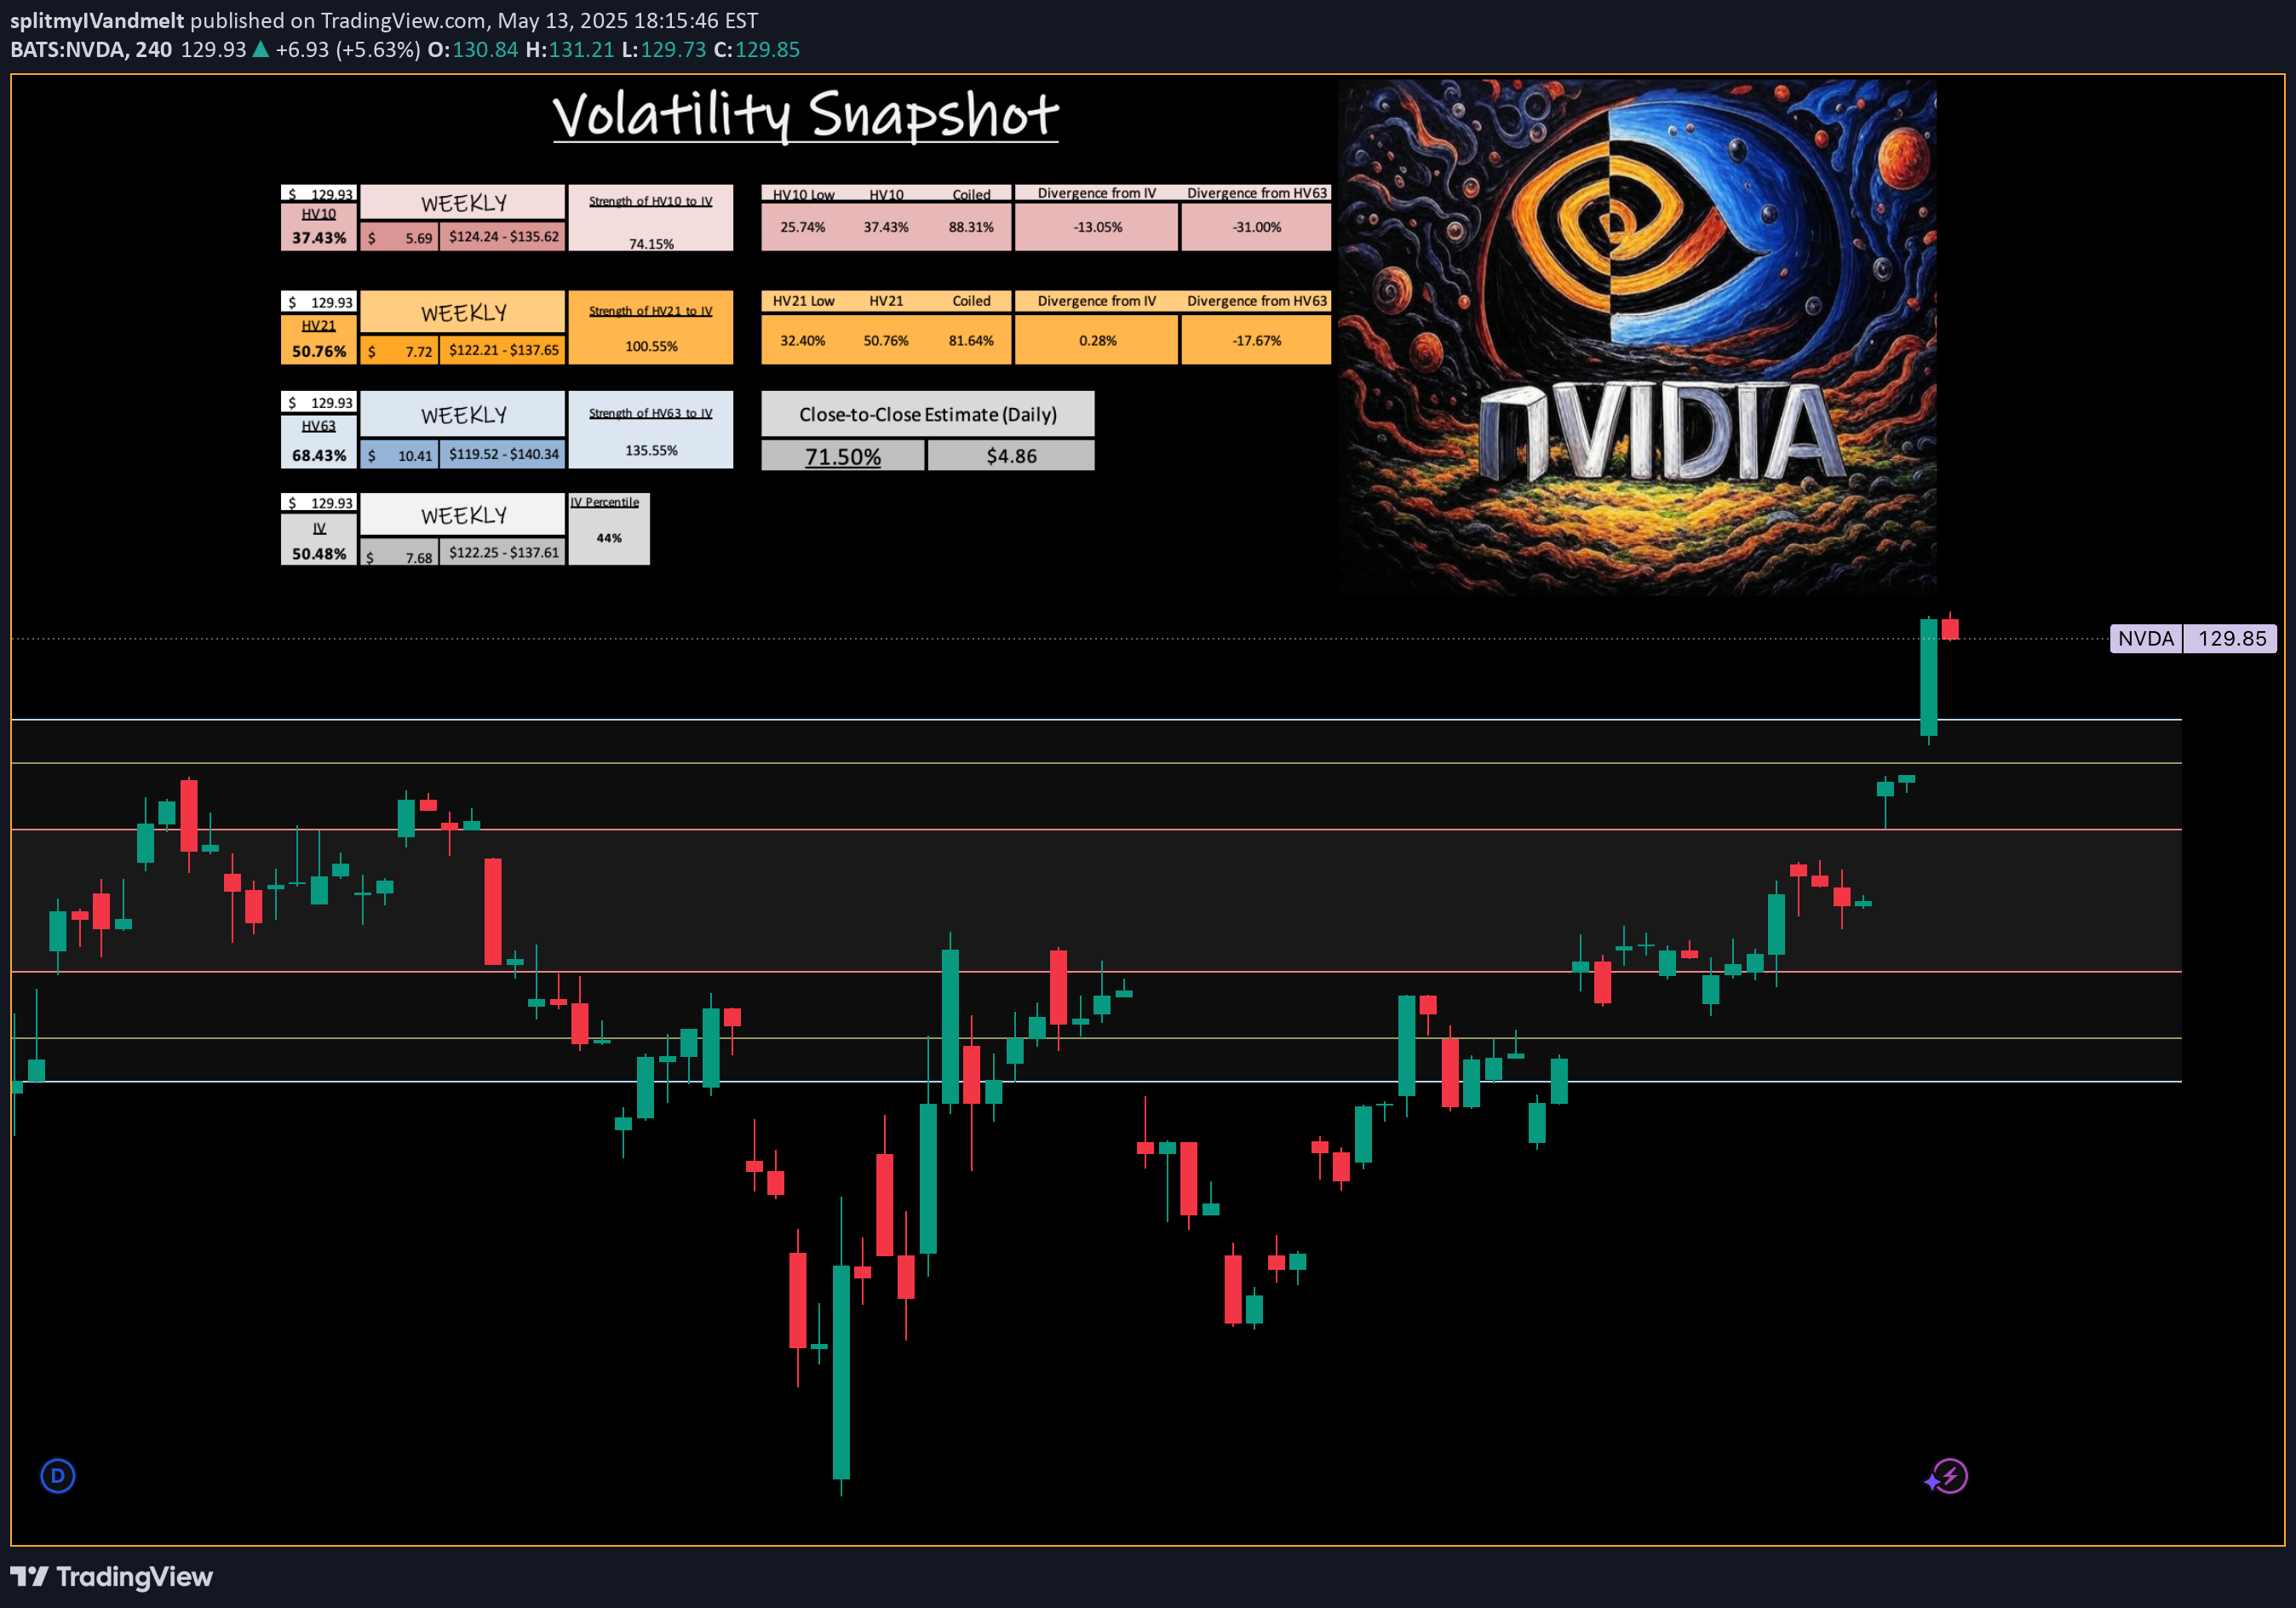
Nvidia - Weekly Volatility Snapshot
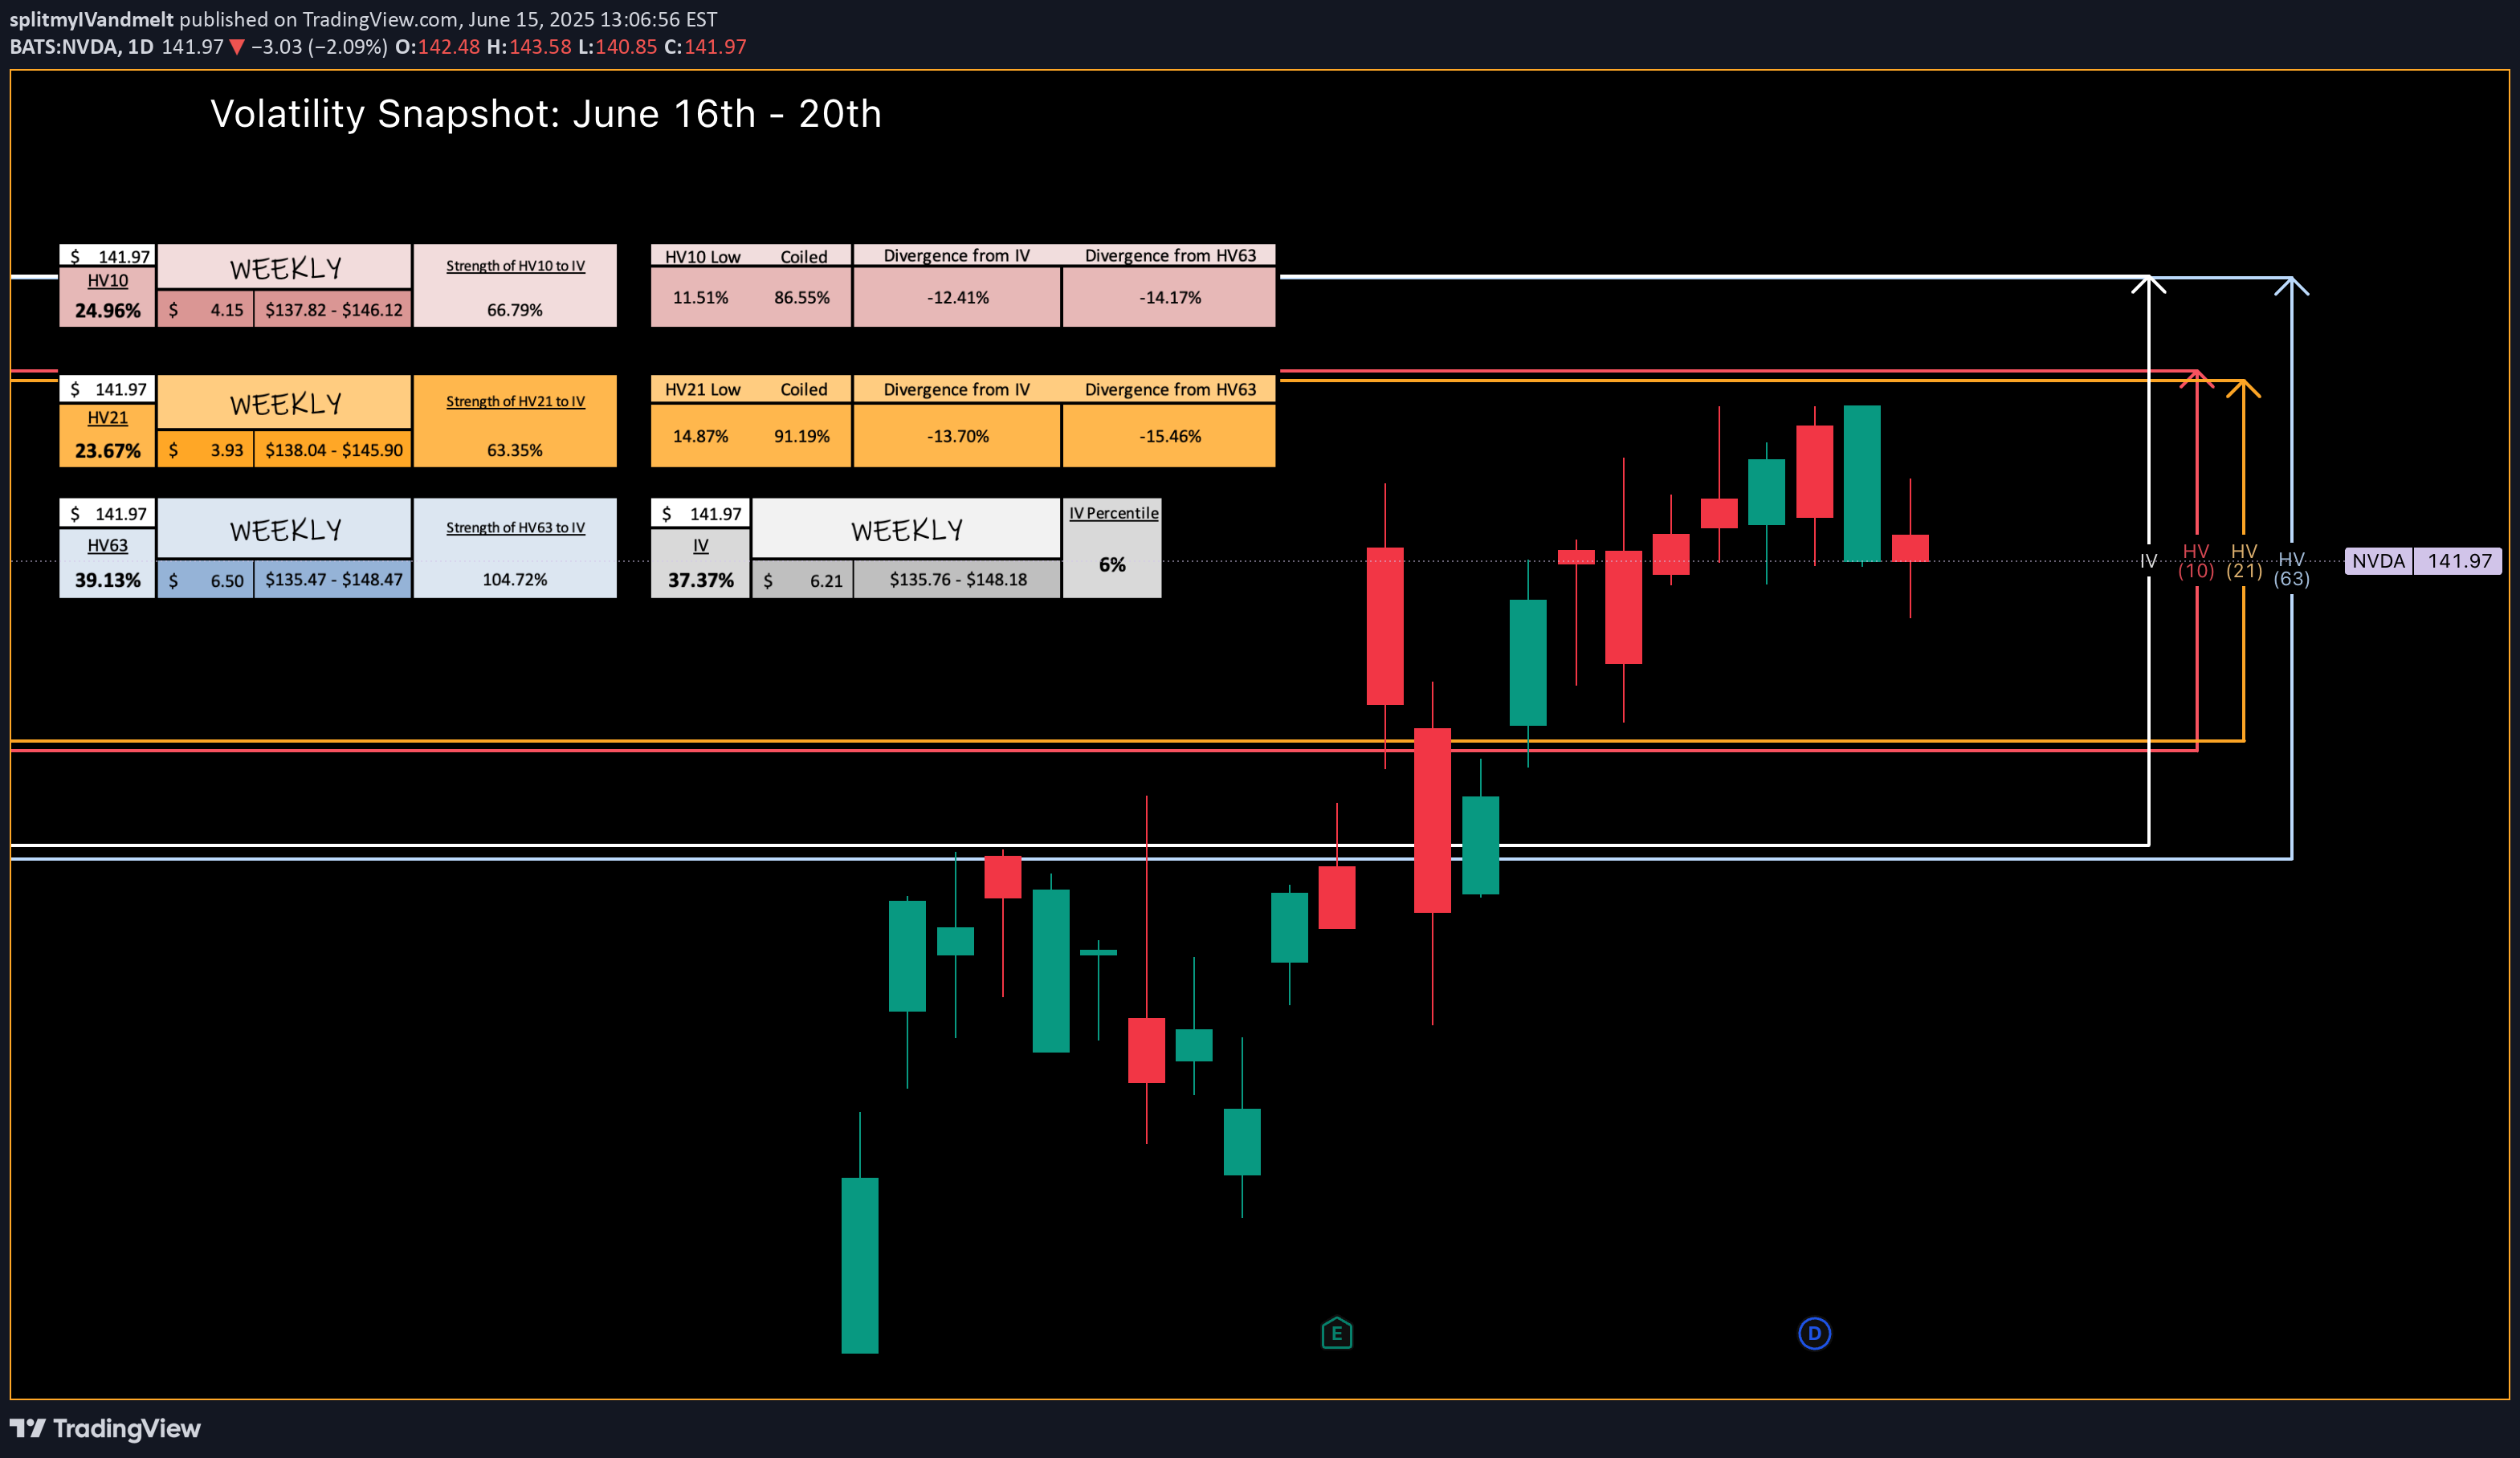
Good Afternoon! Let's talk NVDA Last week we saw HV10 (24.96%) increase above HV21 (23.67%) after starting what could be a regression towards HV63 (39.13%). IV (37.37%) entering this week reflects within 6% of it's sliding yearly lows and resonating around quarterly means. This could be showing a fair prediction to the regression potential and a volatility spike. Here, the RSI has room but is elevated and hinged down with the MACD crossed red -- lagging indicators showing trend reversal. If bi-weekly values can find regression to quarterly; the implied range I would be watching is $135.47 - $148.47 with IV increasing affecting premium positively. If the grind up continues slowly, expect IV to melt and be watching for contracting HV10 ranges between $137.82 - $146.12 -- Keep an eye on the news, it will ever affect the broader markets and any underlying within. Follow along through the week as we track our volatility prediction -- I will pull the charts back in at the end of the week to review! CHEERS!NVDA has an HV10 (21.19%) value that has recently put in lows with the sliding yearly low being 20.90%, only being a .29% difference and making bi-weekly volatility 99.71% coiled. HV21 (33.26%) is currently the monthly yearly low and contracting. This makes monthly trending volatility 100% coiled and both are ready for regression.I will be swinging into next week and am interested on how the numbers read! I will bump my analysis over the weekend with all new information, just know the trade is still active as I close the trade manually here.
splitmyIVandmelt
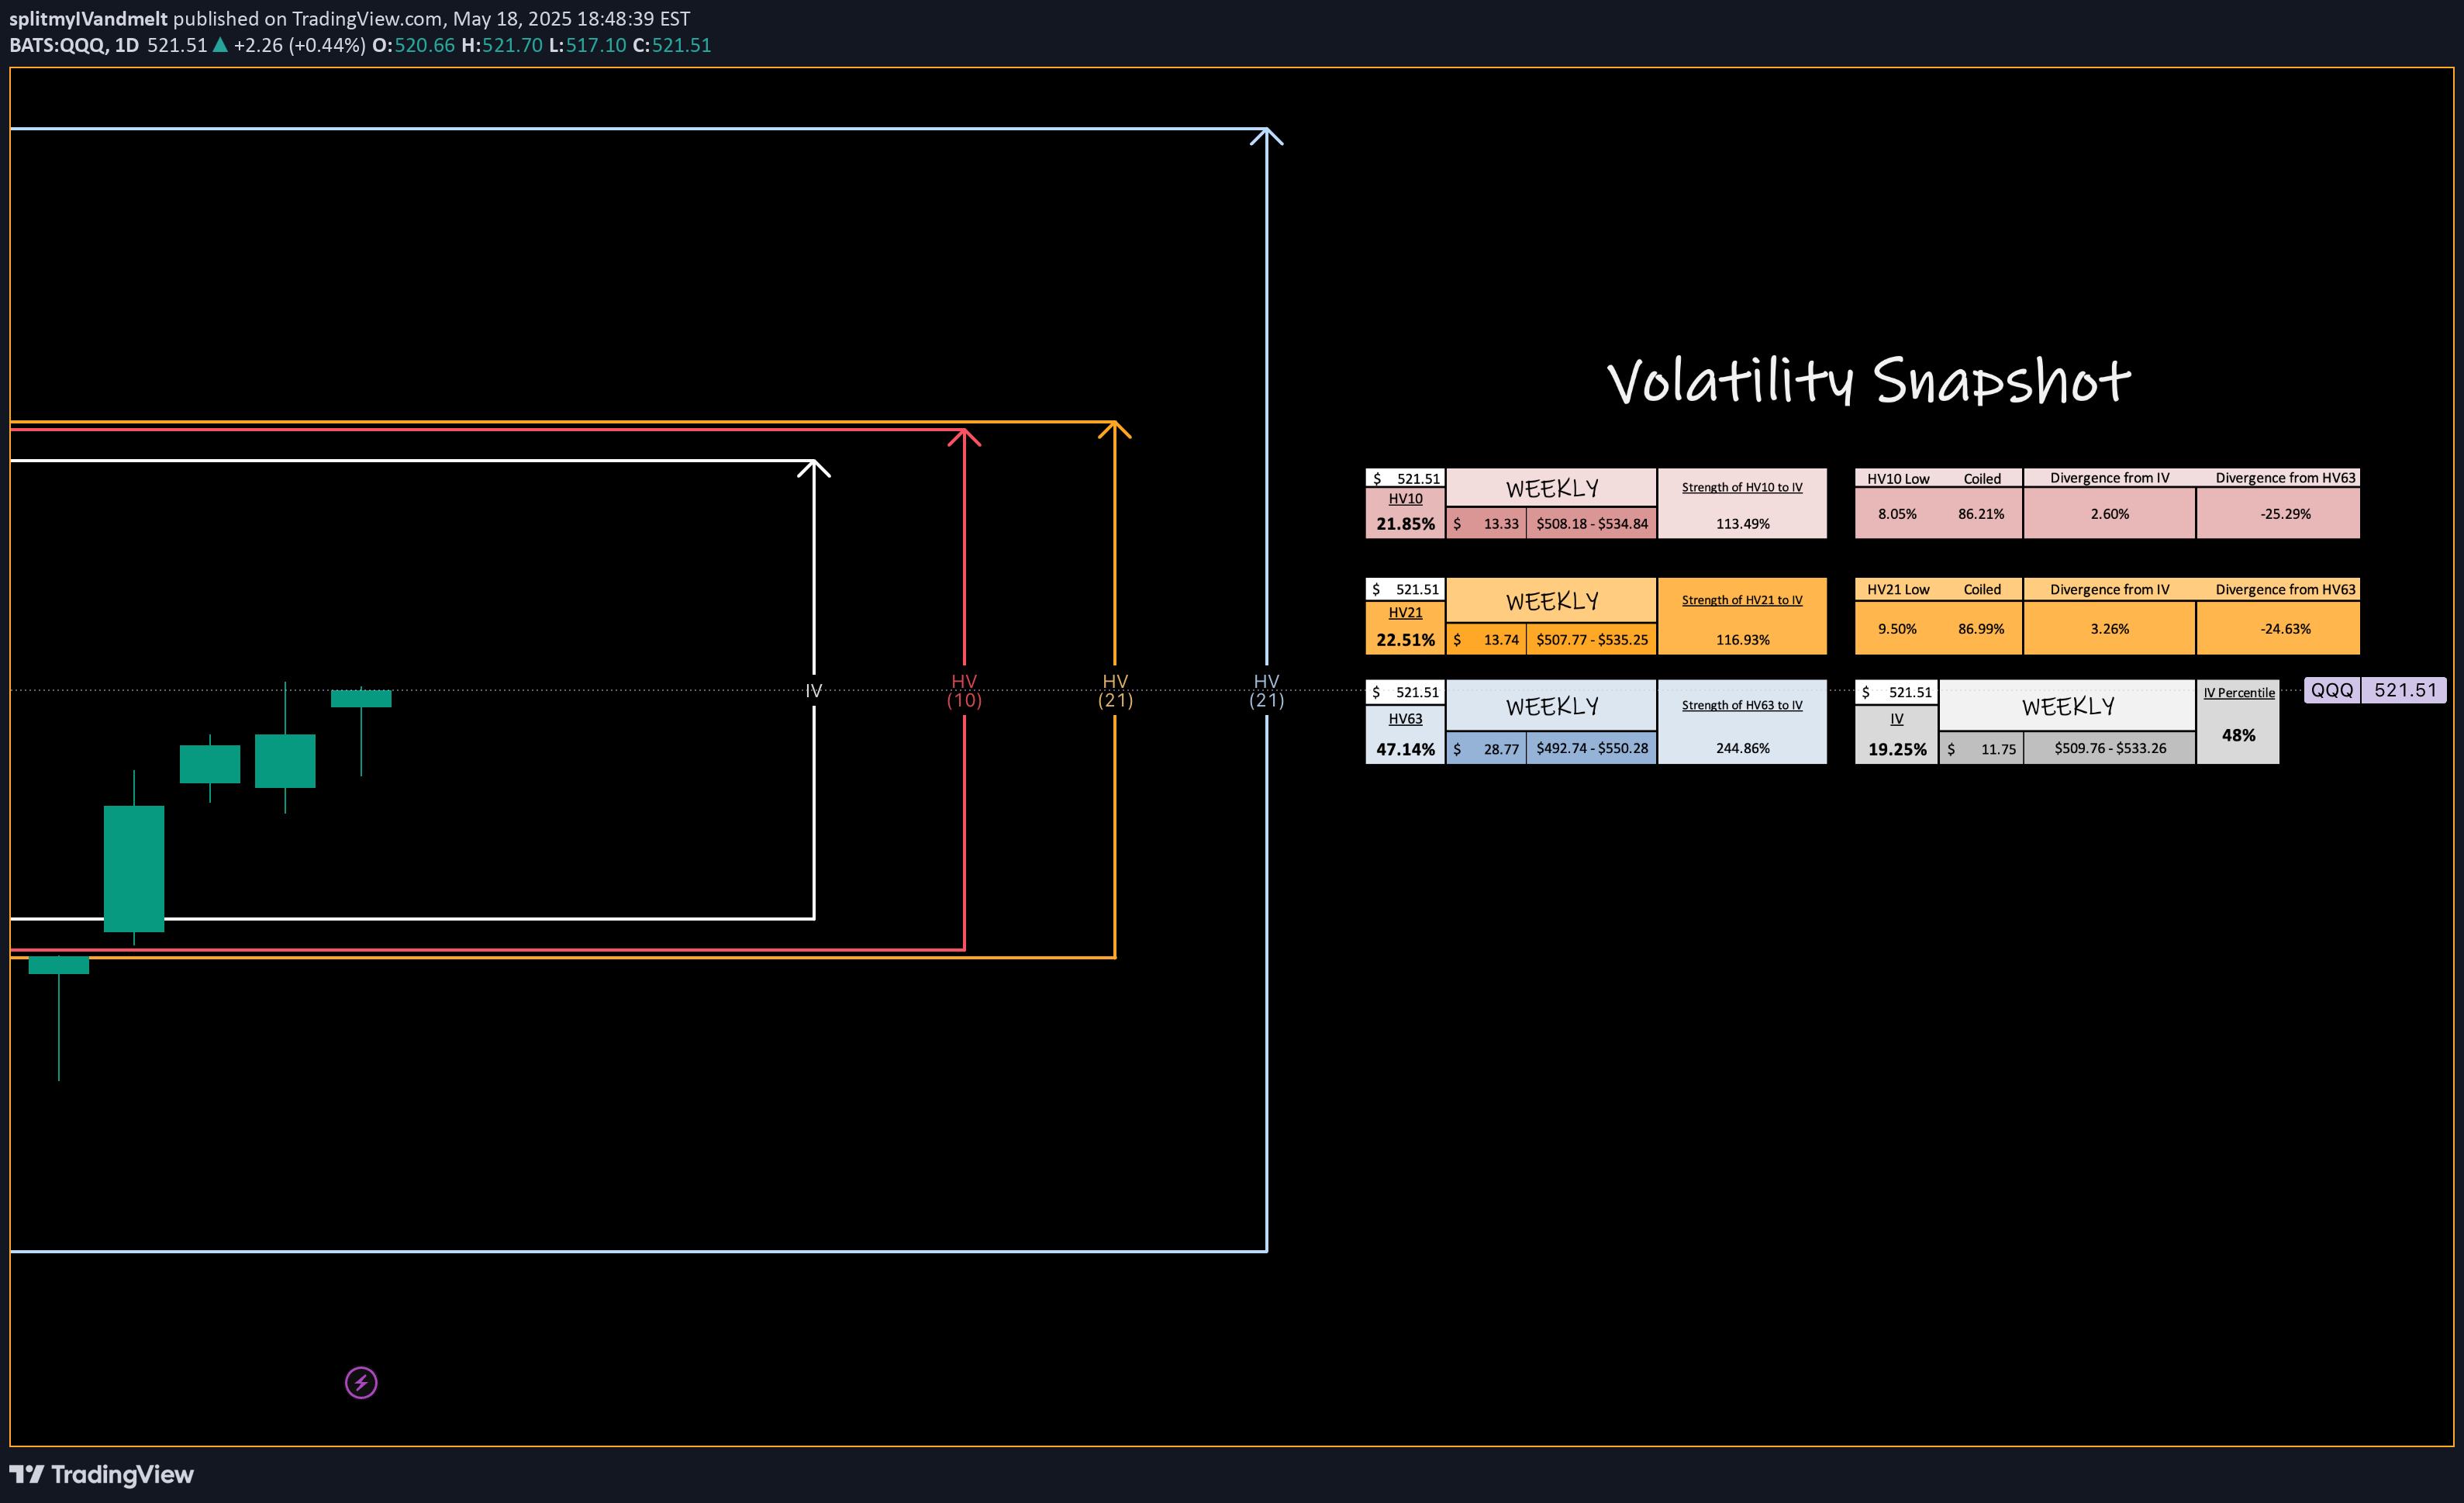
QQQ - Weekly Volatility Potential
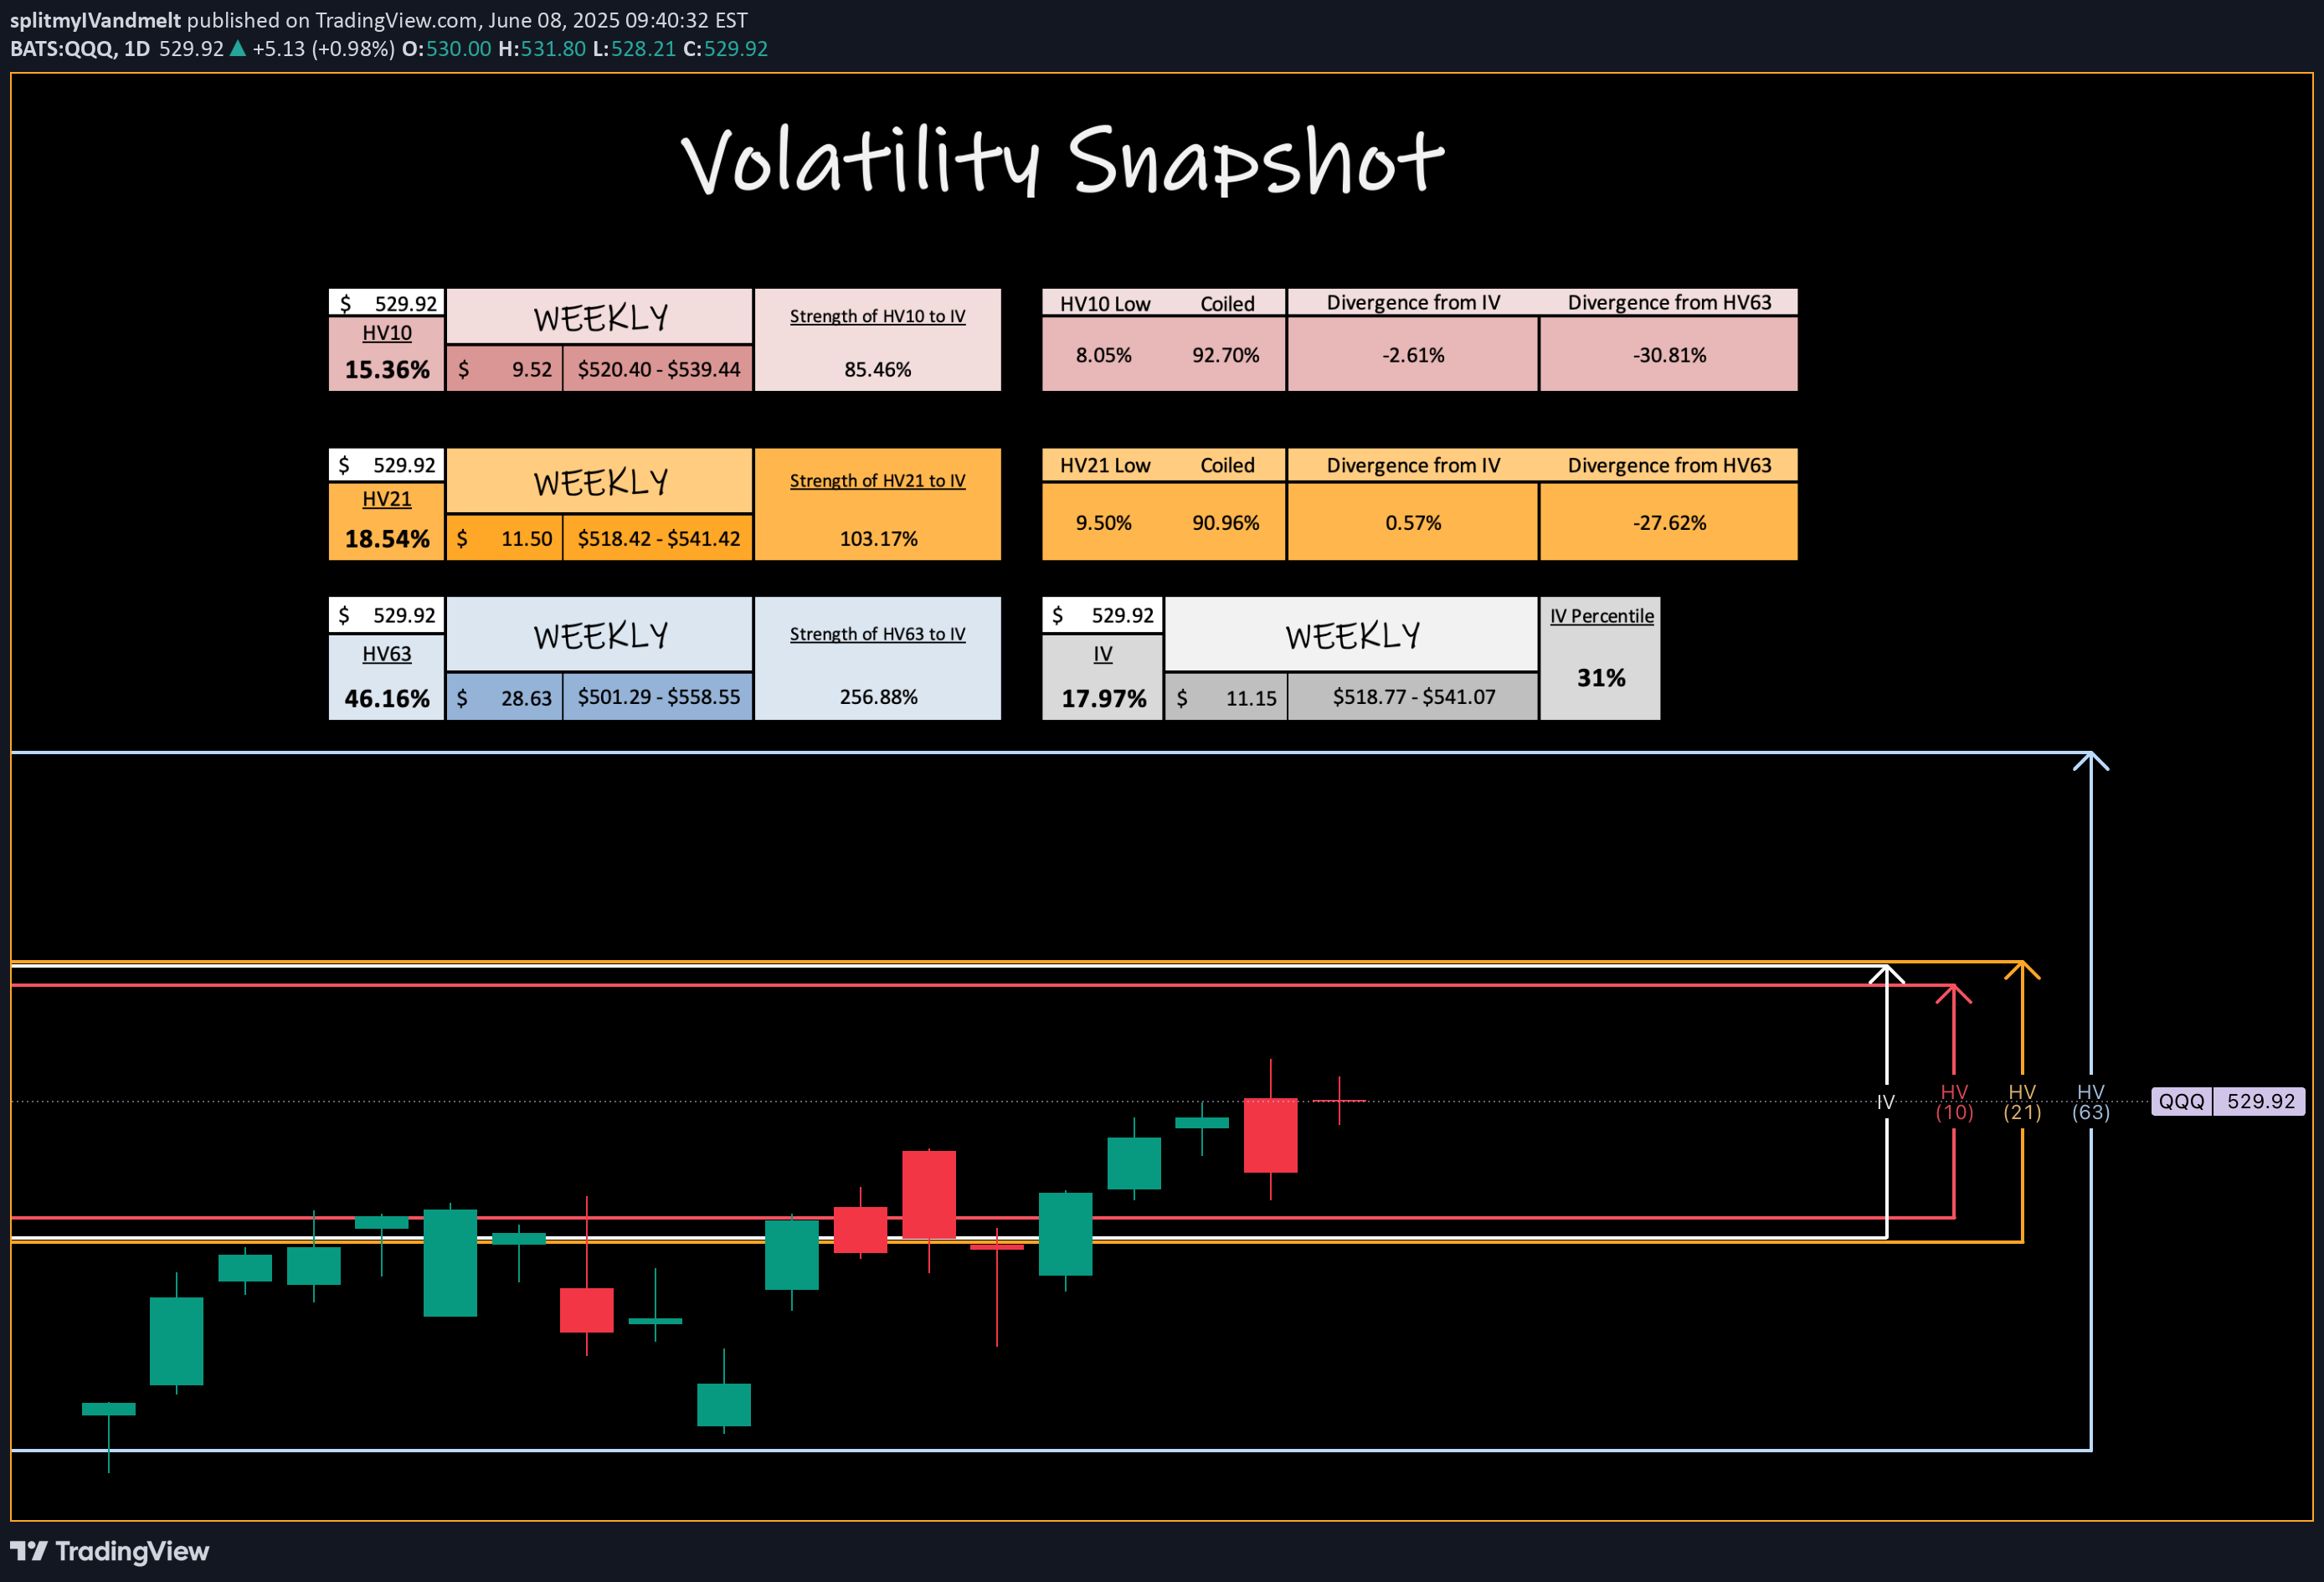
Good Morning -- Last week we reviewed the potential of the S&P 500, this week let us take a look at the potential perspective of QQQ . IV (17.97%) entering the week is trending 31% IVp on the year and has been gradually lowering as price action grinds higher and out of corrective territory -- This is +2.61% more volatile than near-term trending values of HV10 (15.36%) and only -0.57% under HV21 (18.54%), our monthly trending values. Looking towards next week, I expect the VIX to continually soften IV values as the broader markets push towards all-time highs this week. QQQ historical values are coiling to where we will soon need a volatility spike, but not just yet -- my weekly price target here is simple (HV10 upper implied range) $539.44 with wicking potential above to monthly trends (HV21 upper implied ranges) at $541.42. Only time will tell, we can't control the markets but we sure can manage our own risk within them. Remember to always be hedged and come back to join me next weekend as we review the charts for what happened VS our expectation! CHEERSWhat an interesting fun packed week that was in the broader markets and Invesco, QQQ -- We entered the week with upwards price action, only to be met with uncertainty due to war standoffs and negative news cycles, selling off into the end of the week and closing. Although feeling volatile, and a great weekly range to trade, the weekly candle had range contraction. Stay tuned to see what the numbers into next week say!
splitmyIVandmelt
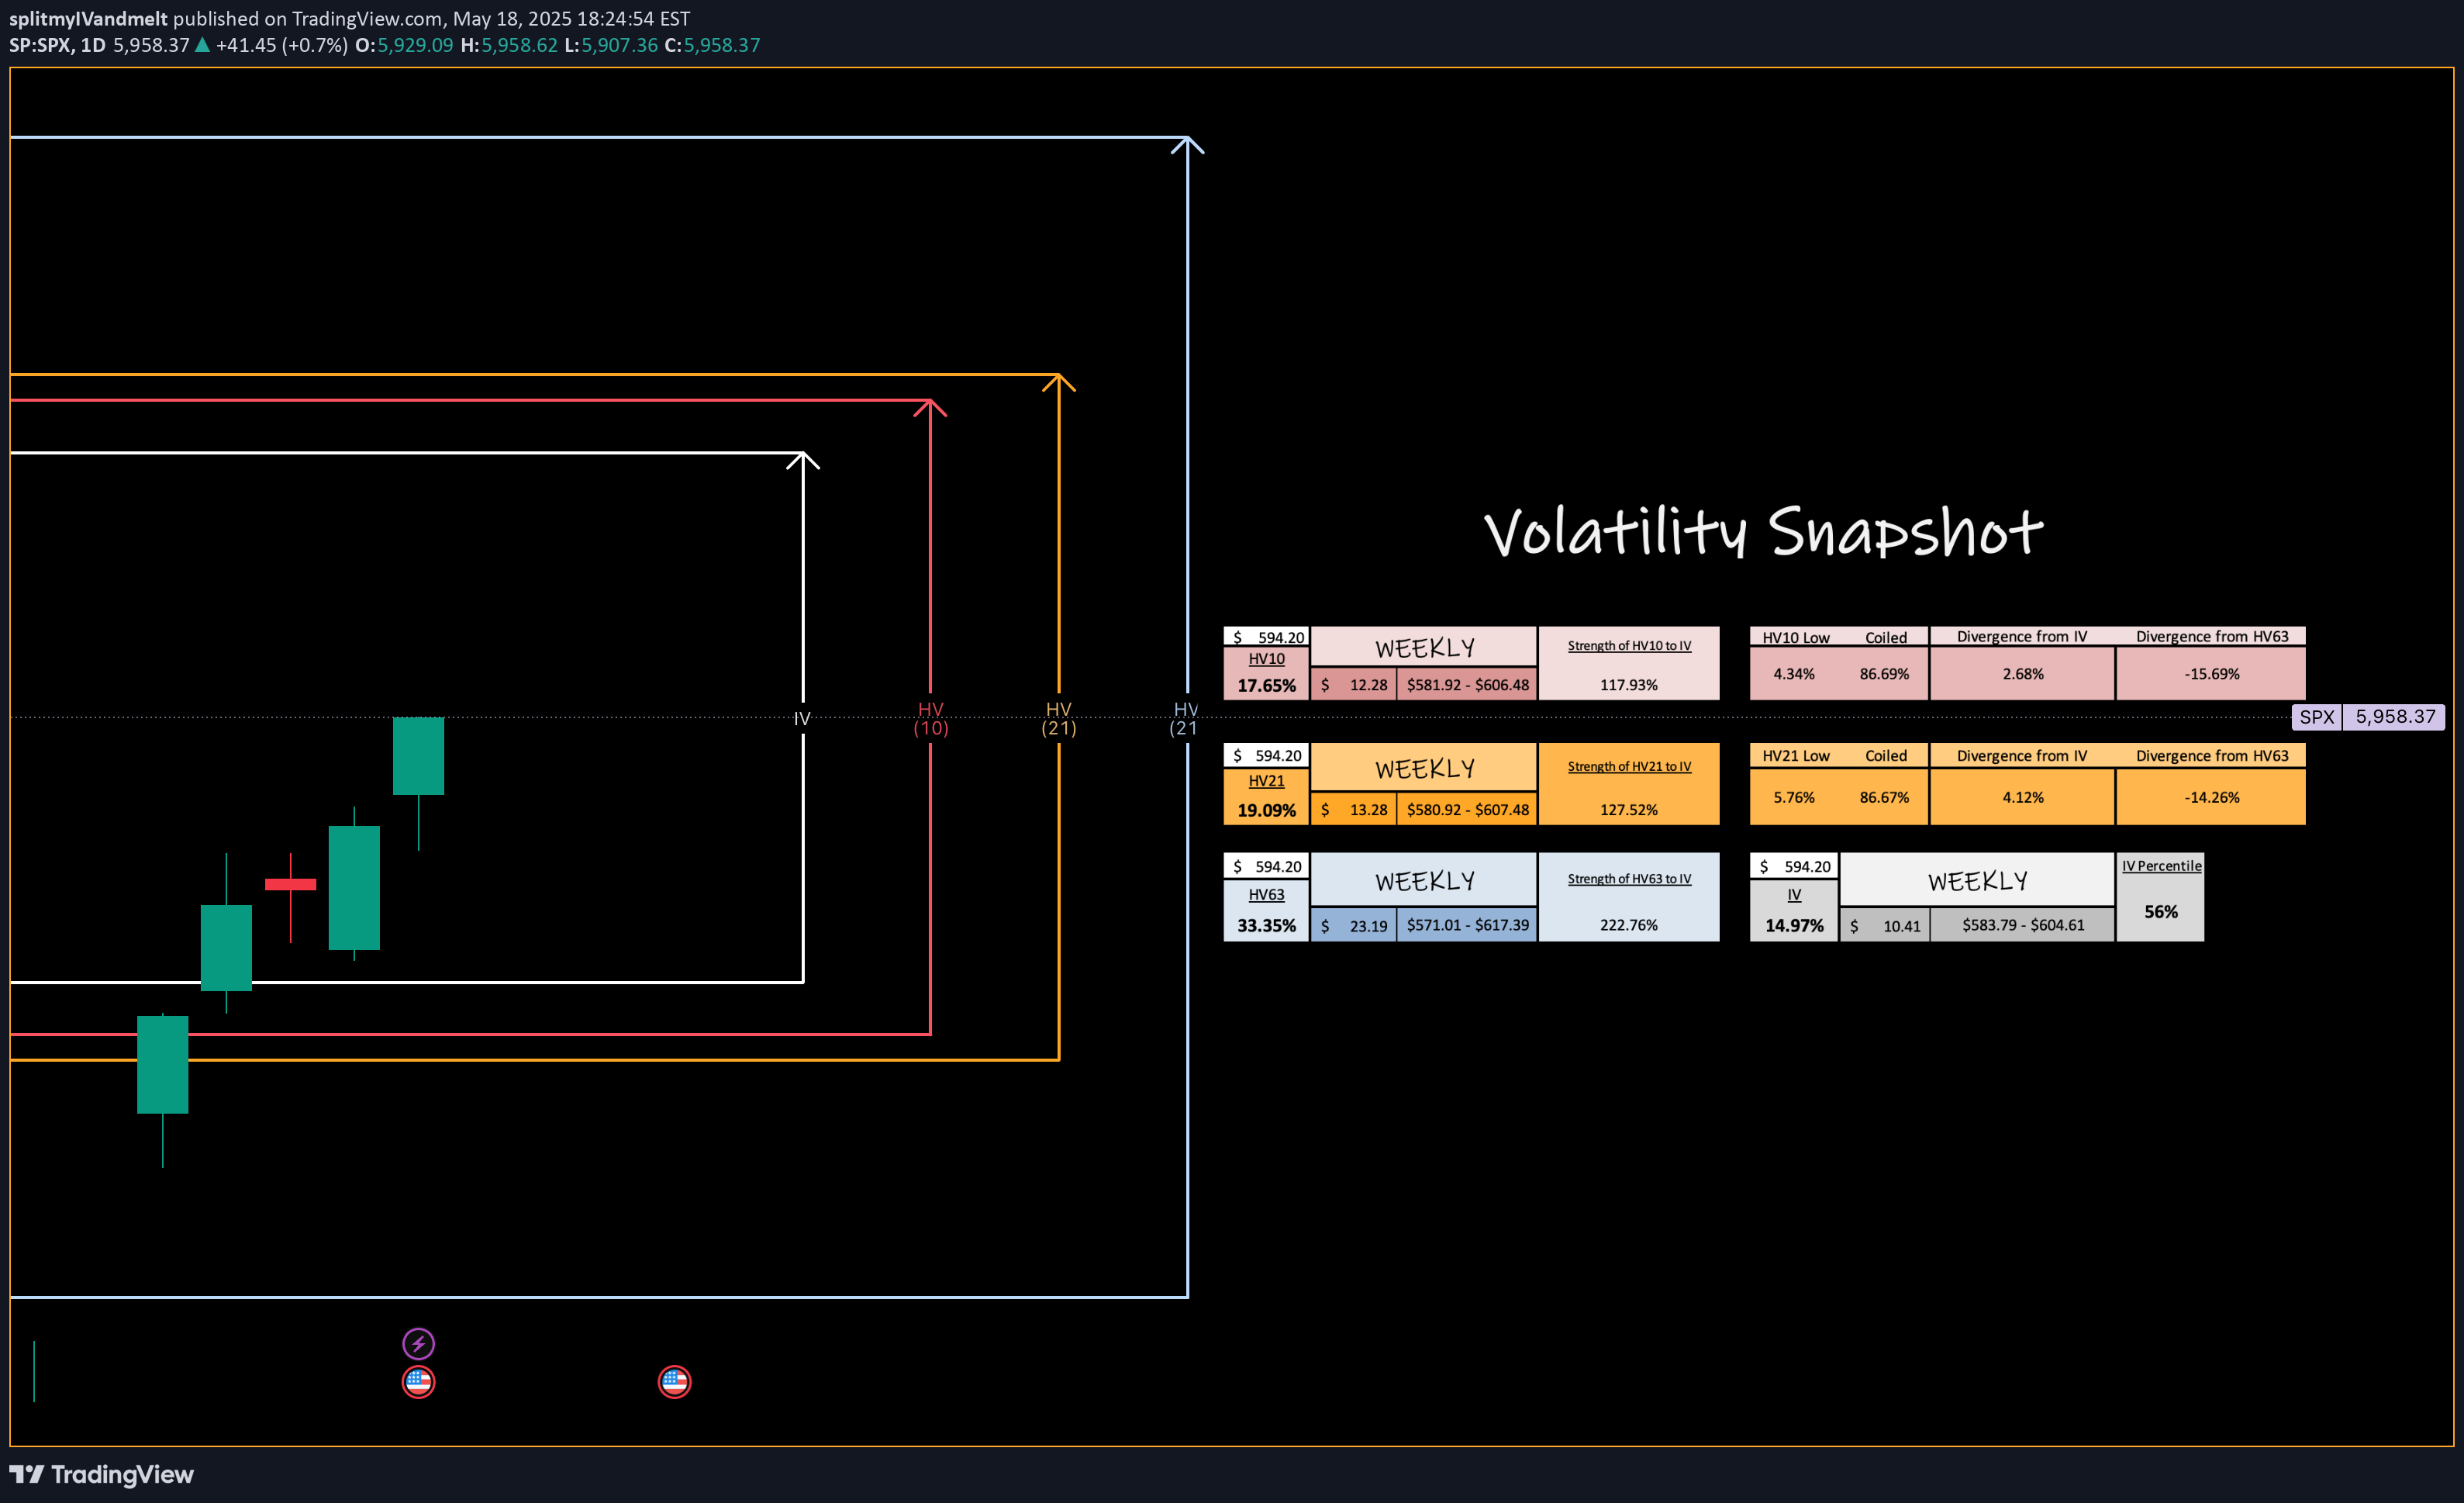
S&P 500 Index -- Weekly Volatility Potential
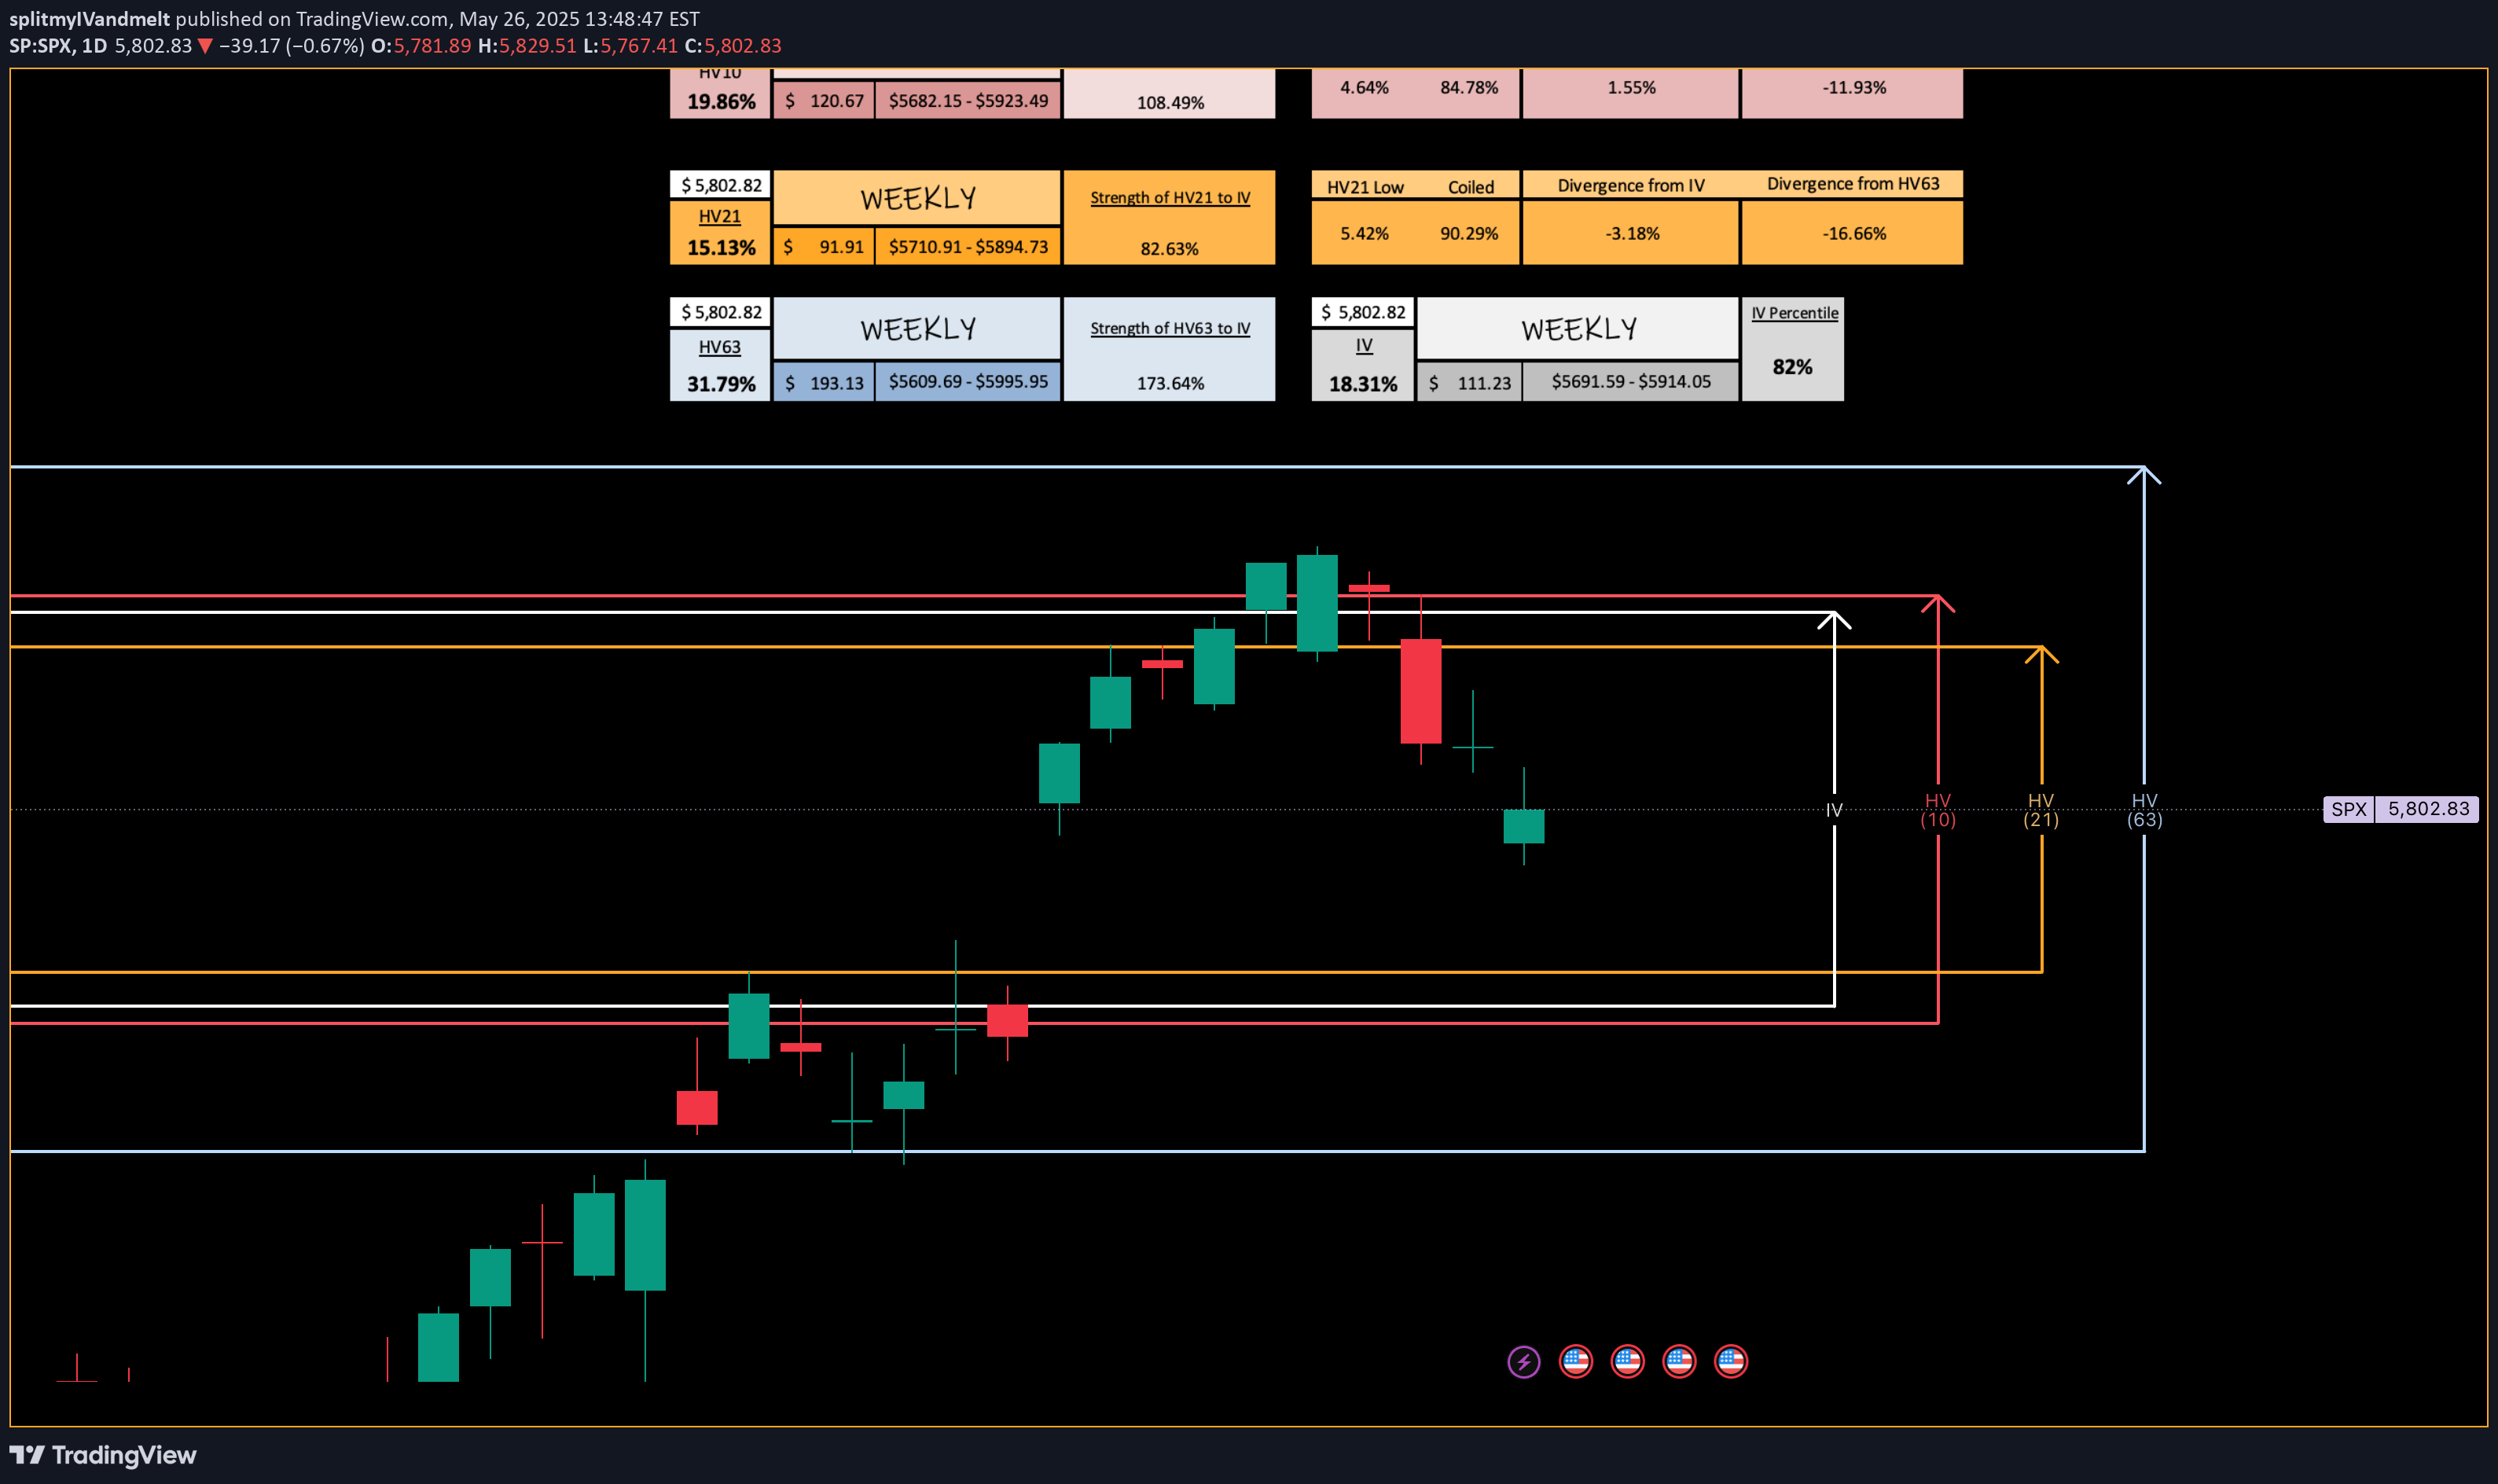
Good Afternoon! This week, I want to talk about the SPX and its weekly potential for how I read historical volatility to weight it then to implied volatility -- this creates my custom trading ranges. Implied ranges for this week are calculated at 4 DTE using my strength of IV method. You can find out more how I do this over at my highlights page on 'X' - Find me @askHVtobidIV We are entering a short week, with IV currently in the 89th percentile for the year ( 18.31% ) and resonating between bi-weekly ( 19.36% ) and monthly ( 15.13% ) historical values. Quarterly volatility trends ( 31.79% ) have risen more than 10% this year alone due to macro concerns and increased news from tariff uncertainties. This is creating a volatile environment that, in turn, only increases our trading ranges. Something I personally like. Near-term trends are above the currently high IV environment, suggesting further expansion. This provides premium value on what is happening to what is projected to happen and a “strength of IV” of >100% indicating rising volatility, slowly towards quarterly means, while resonating around monthly trends. If price action drives downwards, our gap from May 16th could fill around $5,692.56 with confluence of HV21 trends at $5,710.91. Conversely, I can see HV10 ranges with rising pricing action and good macro news with EU tariffs breaking $5,971.33—Expanding to the price of $5,995.95 with continuing expansion and regression towards means. Come back next weekend as I will review the chart to see how we developed! For those interested in volatility analysis and the application of weighted HV ranges to IV, I encourage you to BOOST and share this post, leave a comment, or follow me to join me on this journey.IV melted today -2.76% as SPX gapped up into the week strong passing monthly trending volatility values.WHAT A WEEK! Crazy news with gap ups and controlled consolidation in my mind -- The strength into the week had SPX reaching HV10 values, expanding outside of IV, then consolidating back down to monthly values..in the end lowering IV to close the week out as it chases trending bi-weekly values down. IV has closed the weed 62% IVp and 15.25% respectfully. I will see you Sunday for my volatility discussion, till then enjoy your weekend!
splitmyIVandmelt
QQQ Weekly Potential
Volatility, expressed through standard deviation, quantifies market elasticity and presents a level of probability and precision that humbles us all. This week with QQQ we see that the shorter term trending volatility is resonating like SPX and SPY just under our monthly values. Range seems to be expanding allowing for cheaper premium capture per move happening. With any luck, we reflect and increase in volatility with up to quarterly means. BOOST the post, drop a follow and comment, BUT don't forget to circle back at the end of the week to revisit and observe how our trending markets preformed!Looks like the Qs on the week dipped past monthly trending values but did not want to increase volatility to the quarterly range. This will increase bi-weekly trends and decrease monthly/quarterly volatility trends. Everything looking pretty coiled.
splitmyIVandmelt
S&P 500 Weekly Potential
Volatility, expressed through standard deviation, quantifies market elasticity and presents a level of probability and precision that humbles us all. This week with SPX bi-weekly trends have risen to just below our monthly values and are currently expansive over the markets IV prediction. Right now as I see it, HV10 is going resonate alongside our monthly values showing continued strength over IV. We could full regression to quarterly means as we move our of corrective territory then see consolidation to cool the markets down. BOOST the post, drop a follow and comment, BUT don't circle back at the end of the week to revisit and observe how our trending markets preformed!Reviewed in SPY
splitmyIVandmelt
Historical Volatility Bottoming on NVDA
NVDA HV10 (bi-weekly) printed a coiled low for me on Friday May 9th, where today we saw the spring on great macro news release. I expect volatility to continue its regression journey to quarterly means throughout the company earnings report into the end of the month. Should be a wild ride before consolidating with the broader markets. IV on the local monthly closed 50.48% -- this leaves a divergence still from HV10 to IV of 13.05% and is leaving a premium move capture to HV63 of 31%! This is why I love capturing a volatility sweeping move, because the premium per move is advantageous towards capital. I expect bi-weekly HV to trend up over the following week increasing our volatility range. CHEERS!If you are interested in volatility and trending market analysis with a flavor of fibonacci to spice things up; you have found the right spot! BOOST the post if interested and drop a comment/follow!
splitmyIVandmelt
Trading the Impulse Rally Retracement — Price and Time Symmetry
This is a concept of decaying price and time as an underlying move towards our theoretical projection, where if the underlying enters our built faded cross-section, the SL is triggered to avoid sideways consolidation and decaying contract premiums. This ‘right’ triangle that is ‘sclene’ by nature is created by taking the furthest projection in price/time symmetry (78.6%) and drawing a vertically placed straight line to the highest/lowest point in the rally previously identified. Here, I create a ‘right triangle’ by turning 90 degrees towards my final point, which is made by the nearest projection in price/time symmetry (38.2%). In its entirety, this forms the stop loss triangle. Rules — 1. Enter position with strike of 38.5% retracement in price and expiration of +21 days past 78.6% retracement in time. 2. SL is LOW or HIGH in PRICE from rally. Structure invalidates with new low or high made that expands rally — this protects against price decay. 3. SL is STOP LOSS TRIANGLE cross-sectional zone built. Structure invalidates with horizontal extension into faded cross-section to protect against time decay. The beauty of this concept is the ability to trade with rules the potential retracement in price/time symmetry distinctively and without emotion, as the underlying trades to potential harmonic reversals.QQQ closed $507.85 today 5/12/25
Disclaimer
Any content and materials included in Sahmeto's website and official communication channels are a compilation of personal opinions and analyses and are not binding. They do not constitute any recommendation for buying, selling, entering or exiting the stock market and cryptocurrency market. Also, all news and analyses included in the website and channels are merely republished information from official and unofficial domestic and foreign sources, and it is obvious that users of the said content are responsible for following up and ensuring the authenticity and accuracy of the materials. Therefore, while disclaiming responsibility, it is declared that the responsibility for any decision-making, action, and potential profit and loss in the capital market and cryptocurrency market lies with the trader.