
shermzT
@t_shermzT
What symbols does the trader recommend buying?
Purchase History
پیام های تریدر
Filter
Signal Type

shermzT
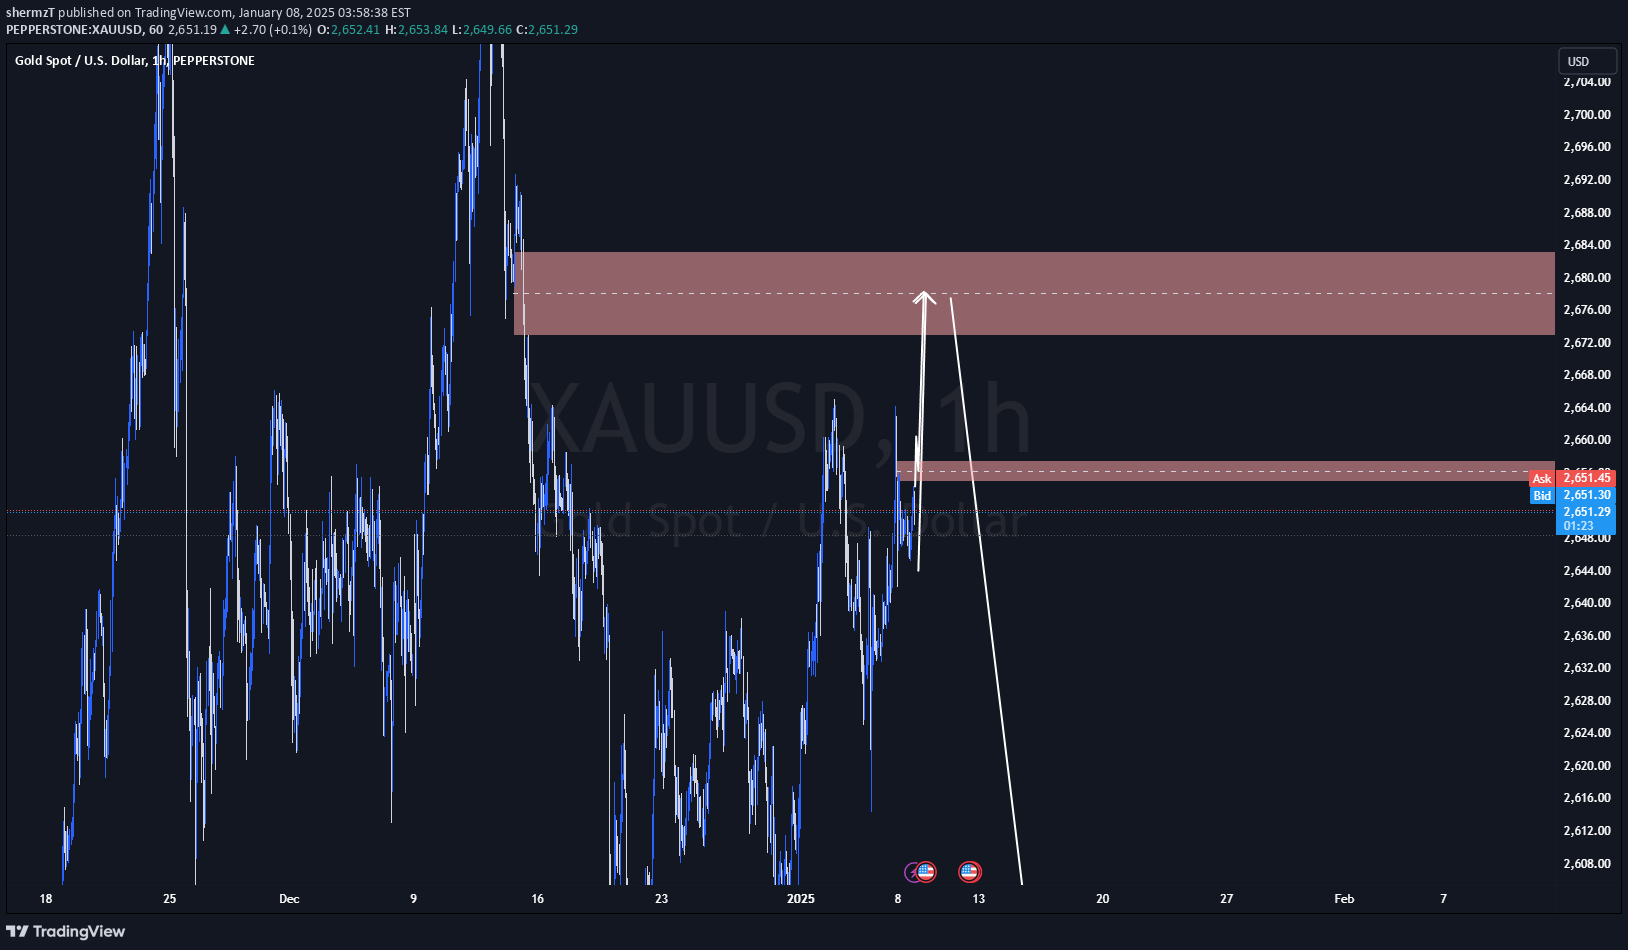
Buyers failed to defend the 2680 level on 13th Dec following a bullish move to the Nov 25th highs. Looking to scalp buys to 2680 level and watch for rejection of this level. Target will be 2582/36 level Stops will be off the highs of the rejection from the 2680 level. (Waiting for formation)

shermzT
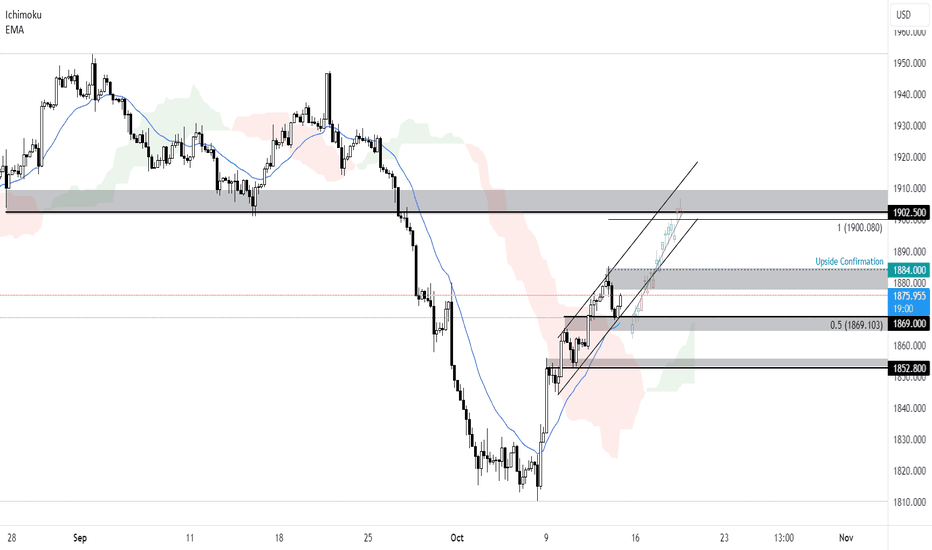
On the H4 timeframe, price is exhibiting bullish order flow, forming higher lows and higher highs, which manifested itself as an ascending channel. Price has recently tapped into a key resistance-turned-support level at 1869, which is in line with the 50% fibonacci retracement. A throwback to this level will provide the bullish acceleration towards the next support-turned-resistance level at 1902.50, which coincides with the 100% fibonacci extension. Price is hovering above Ichimoku cloud and 20 EMA, supporting our bullish bias.

shermzT
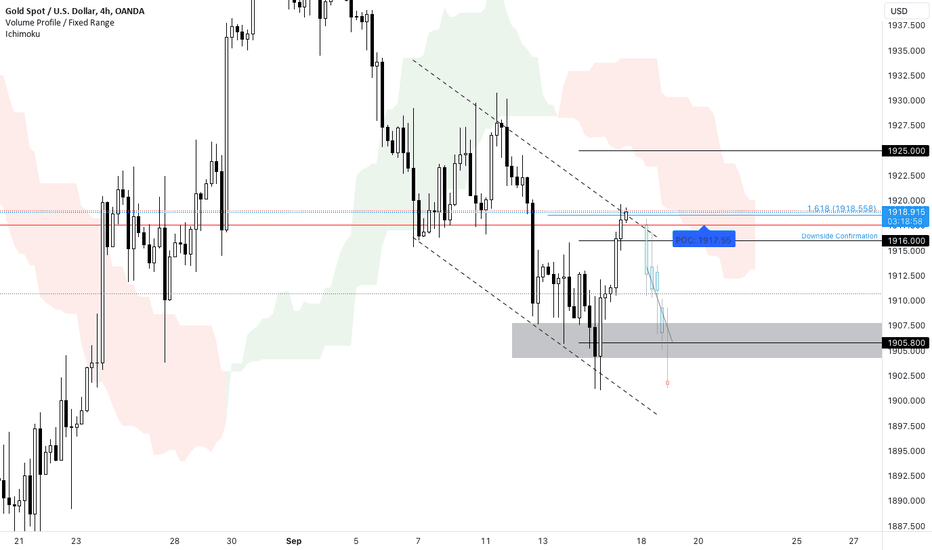
On the 4H chart, prices are trending down a bearish channel with current prices hovering at the upper channel band at the 161.8% fibonacci level, forming lower highs and lower lows. Downtrend confirmation if prices breaks past the 1916 level as prices ened to turn bearish on the lower time frame to indicate the reversal. The bullion is trading below the ichimoku cloud, confirming our bearish bias.

shermzT
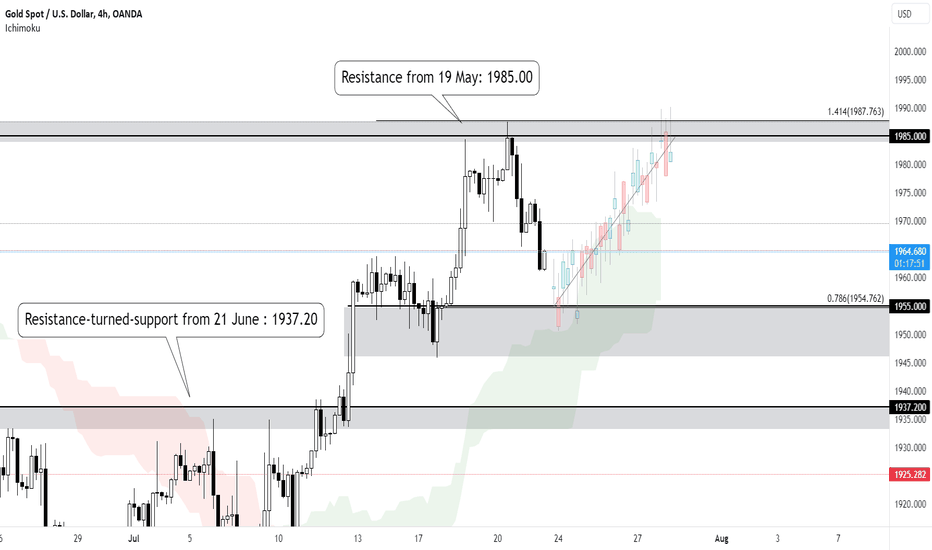
Currently, there is bullish order flow, with higher lows and higher highs created. A throwback to support zone at 1955.00, which is in line with the 78.6% Fibonacci retracement level, could provide bullish acceleration towards the resistance zone at 1985.00, which coincides with the 141.4% Fibonacci extension level. Price is currently hovering above ichimoku cloud, supporting our bullish bias.

shermzT
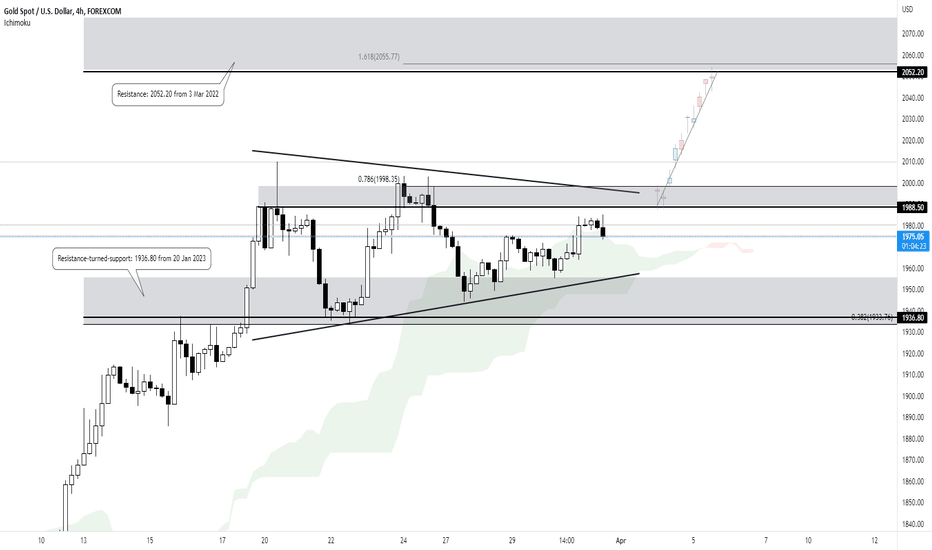
Price is consolidating between a key resistance zone at 1988.50 and a key support zone at 1936.80, forming a bullish pennant on the H4 timeframe. A break above the resistance zone at 1988.50, in line with the 78.6% Fibonacci extension level and graphical high, could provide the bullish acceleration to the next resistance zone at 2052.20, in line with the 161.8% Fibonacci extension. Price is holding above the Ichimoku cloud as well, supporting our bullish bias.

shermzT
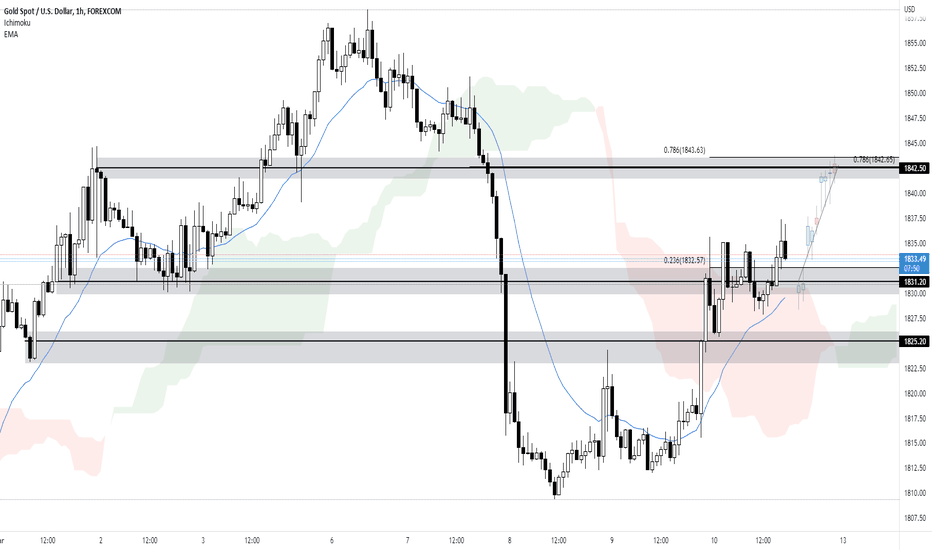
Prices have broken above a key resistance zone at 1831.20 on the H1 timeframe, which is in line with the 23.6% Fibonacci extension. A throwback to this zone could present an opportunity to ride the bounce to the resistance zone at 1842.50, which coincides with the 78.6% Fibonacci retracement and extension levels. Prices are holding above the Ichimoku cloud and 20 EMA, supporting our bullish bias.

shermzT
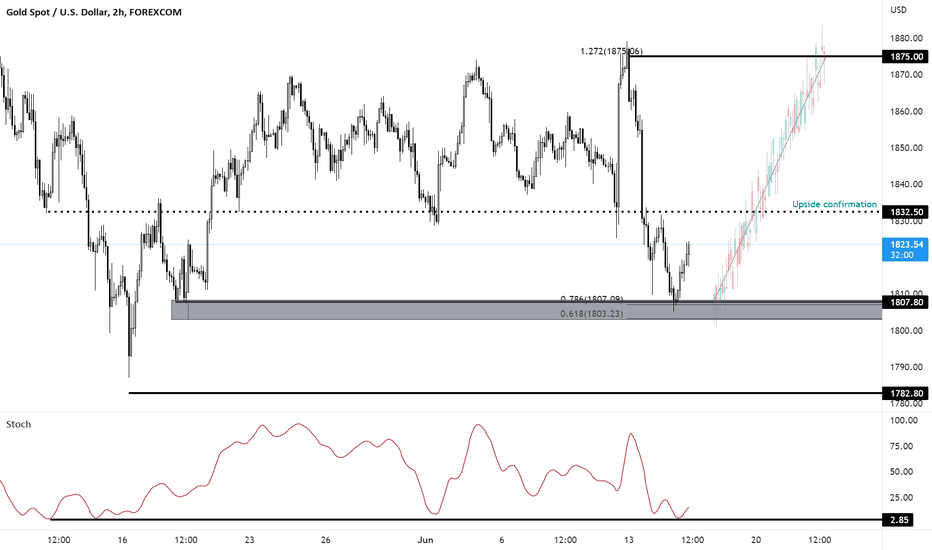
On the monthly time frame, prices are testing a demand zone and holding above its ascending trend line where we could see a further upside. On the H2 time frame, prices bounced off a key support area at 1807.80, in line with the 78.6% Fibonacci retracement and 61.8% Fibonacci extension. A break above our upside confirmation level at 1832.50, which is also a key level that prices interacted with multiple times could see prices rally higher to our next resistance target at 1875.00 which is also in line with the 127.2% Fibonacci extension. Stochastic is testing support as well, supporting the bullish bias.

shermzT
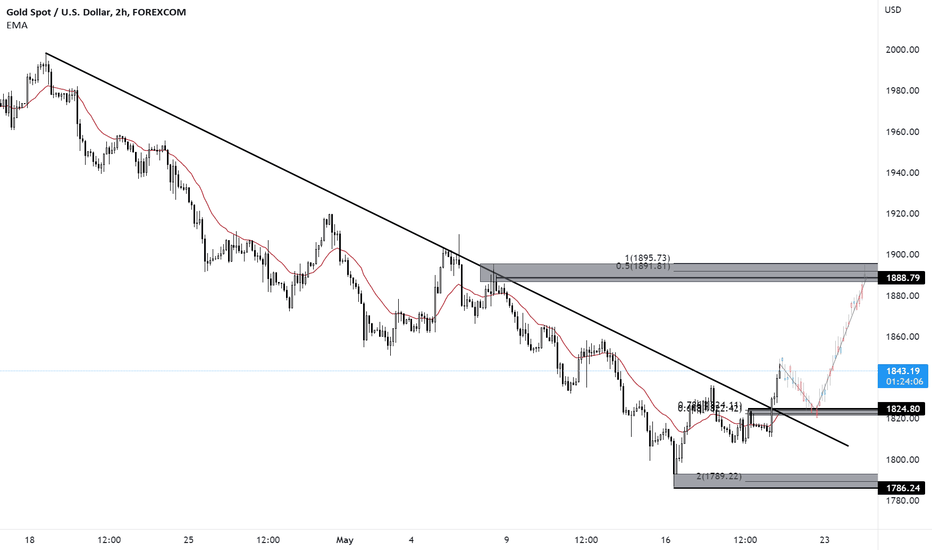
On the weekly time frame, prices are testing a key support level at 1842, where we could see further upside. On the H2 time frame, prices broke above the descending trend line, suggesting a shift from a bearish to bullish order flow. A throwback to its support area at 1824.80, in line with the 78.6% Fibonacci retracement and 61.8% Fibonacci retracement presents an opportunity to play the bounce, with 1888.80 as the resistance target. Prices are holding above the 20 EMA as well, in line with our bullish bias.

shermzT
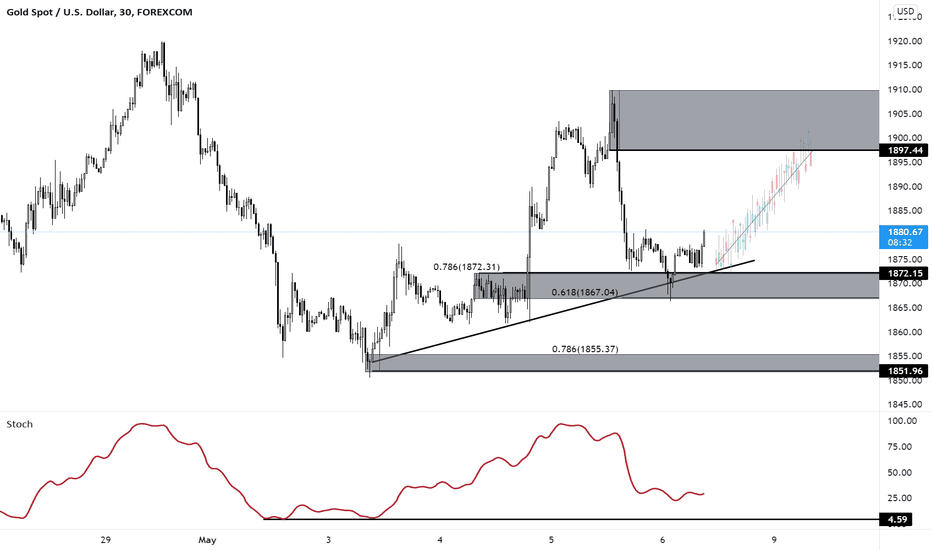
On the M30 time frame, prices are holding above the ascending trend line and a pullback to the support area at 1872.15, in line with the 78.6% fibonacci retracement and 61.8% fibonacci extension presents an opportunity to play a short term bounce up to the next resistance target at 1897.44. Stochastic is approaching support as well, in line with our bullish bias.

shermzT
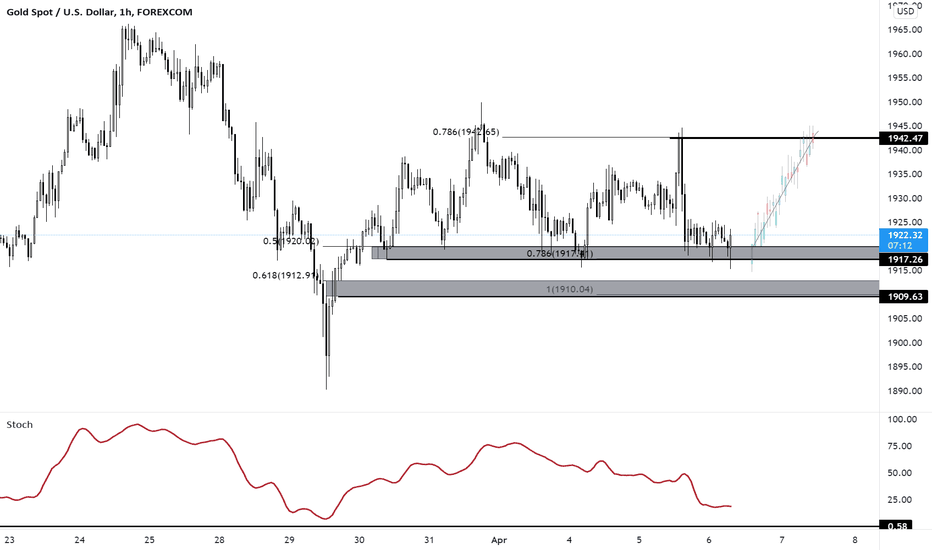
On the H1 time frame, prices are testing support at 1917.26, in line with the 50% Fibonacci retracement, 78.6% Fibonacci extension where we could see further upside in prices, with 1942.47 as our resistance target, in line with the 78.6% Fibonacci retracement. Stochastic is approaching support as well where we could see further upside above this level.
Disclaimer
Any content and materials included in Sahmeto's website and official communication channels are a compilation of personal opinions and analyses and are not binding. They do not constitute any recommendation for buying, selling, entering or exiting the stock market and cryptocurrency market. Also, all news and analyses included in the website and channels are merely republished information from official and unofficial domestic and foreign sources, and it is obvious that users of the said content are responsible for following up and ensuring the authenticity and accuracy of the materials. Therefore, while disclaiming responsibility, it is declared that the responsibility for any decision-making, action, and potential profit and loss in the capital market and cryptocurrency market lies with the trader.