
sabri2003
@t_sabri2003

What symbols does the trader recommend buying?
Purchase History
پیام های تریدر
Filter
sabri2003
تحلیل اختصاصی توکن GALA: آیا آماده انفجار صعودی در تایم فریم ۴ ساعته است؟

*Personal Analysis of GALA Token* Title GALA in Strategic Correction Phase: Strong Bullish Potential on 4-Hour Timeframe Introduction GALA, associated with Gala Games, shows indications of being in a correction phase that might precede a significant upward movement. Based on my personal analysis, I believe GALA on the 4-hour timeframe (4H) might be gearing up for a positive breakout. Key Points of Analysis 1. *Correction Phase*: GALA is currently in a correction phase which could present an opportunity for market entry anticipating a bullish reversal. 2. *Support and Resistance*: - *Support*: $0.015 - $0.016 zone could be critical in determining the next direction. - *Resistance*: $0.020 - $0.022 level might be an initial target if bullish momentum materializes. 3. *4-Hour Timeframe (4H)*: On this timeframe, some technical signals might support a bullish case: - Formation of a corrective pattern that could culminate in an upswing. - Indicators like RSI might show positive divergence. 4. *Volume and Liquidity*: Monitoring trading volume is essential to confirm any price movement. 5. *Fundamentals*: Gala Games' success in decentralized gaming could boost demand for GALA. Bullish Probability - If GALA breaks above $0.020 resistance, we might see an ascent towards $0.025 or higher. - The current correction might offer an opportunity for long positions with a tight stop-loss. Risks - Cryptocurrency markets are highly volatile. - Breach of $0.015 support could lead to further downside. Conclusion GALA appears to be in a phase that might precede a bullish move, especially if positive technical signals emerge on the 4H timeframe. Continuous monitoring of Gala Games developments and market performance is crucial for informed investment decisions. Disclaimer Trading cryptocurrencies carries risks. Independent research and consultation with a financial advisor are always recommended.
sabri2003
Buy

Susdt Elliott Wave Analysis: Potential Trend Reversal Summary The completion of the downward Elliott wave pattern (a b c d e) may indicate a potential trend reversal towards an uptrend. Analysis Details 1. *Downward Elliott Waves*: The (a b c d e) pattern often relates to the end of a corrective downtrend. - *a*: Initial downward wave. - *b*: Corrective upward wave. - *c*: Second downward wave. - *d*: Corrective upward wave. - *e*: Final downward wave. 2. *Implications of Completion*: - If wave *e* is complete, it might signal the end of selling pressure. - Potential start of a new uptrend or at least a corrective upswing. 3. *Confirmation*: - Watch for *resistance breakout*: If price breaks a key resistance post-wave e, it may confirm upside. - *Volume*: Increasing volume with upward move could strengthen the reversal case. Important Notes - *Risk*: Wave analysis requires precise counting and can vary between analysts. - *Additional Confirmation*: Use other technical indicators (like RSI, MACD) to support analysis. - *Risk Management*: Importance of setting *stop-loss* in trading. Next Steps - Monitor price action post-wave *e* for trend confirmation. - Look for additional *bullish signals* (like candlestick patterns, breakouts). Would you like: - *More details* on Elliott Wave analysis? - *Examples* of applying this analysis in specific markets? - *Tips* on how to use this analysis in trading?
sabri2003
Strong Buy

Sonic coin On the four-hour frame, there is a strong buying potential. Exit at the 0.40 level. Stop loss is 0.25
sabri2003

sabri2003
Strong sale

Gala/usdt .Warning: There's an imminent collapse of altcoins. They get you into buying, followed by a massive crash that will cost you your money. After the crash, a positive rally begins. This is not financial advice. Do your own research🚨🚨🚨🚨🚨🚨🚨🚨🚨🚨🚨🚨🚨🚨🚨🚨🚨🚨🚨🚨🚨
sabri2003
Sal

"Dogecoin's recent performance has been bearish, with a 4.19% decline over the past 24 hours, bringing its price to $0.21. The current market capitalization stands at approximately $35.03 billion, with a trading volume of $4.21 billion. *Key Price Levels:* - *Support:* $0.08, where the price bounced back after reaching this zone - *Resistance:* $0.22, which could lead to a downward rebound if the price reaches it *Technical Analysis:* - *Moving Averages:* Neutral - *Indicators:* Sell signal - *Expected Scenario:* Buy at the $0.08 support level and sell at the $0.22 resistance level *Technical Insights:* - Some analysts believe Dogecoin may continue to rise towards the upper trend line of the descending channel - Others predict a decline due to short-term bearish resistance Let me know if you need more details or specific analysis.
sabri2003
Sale
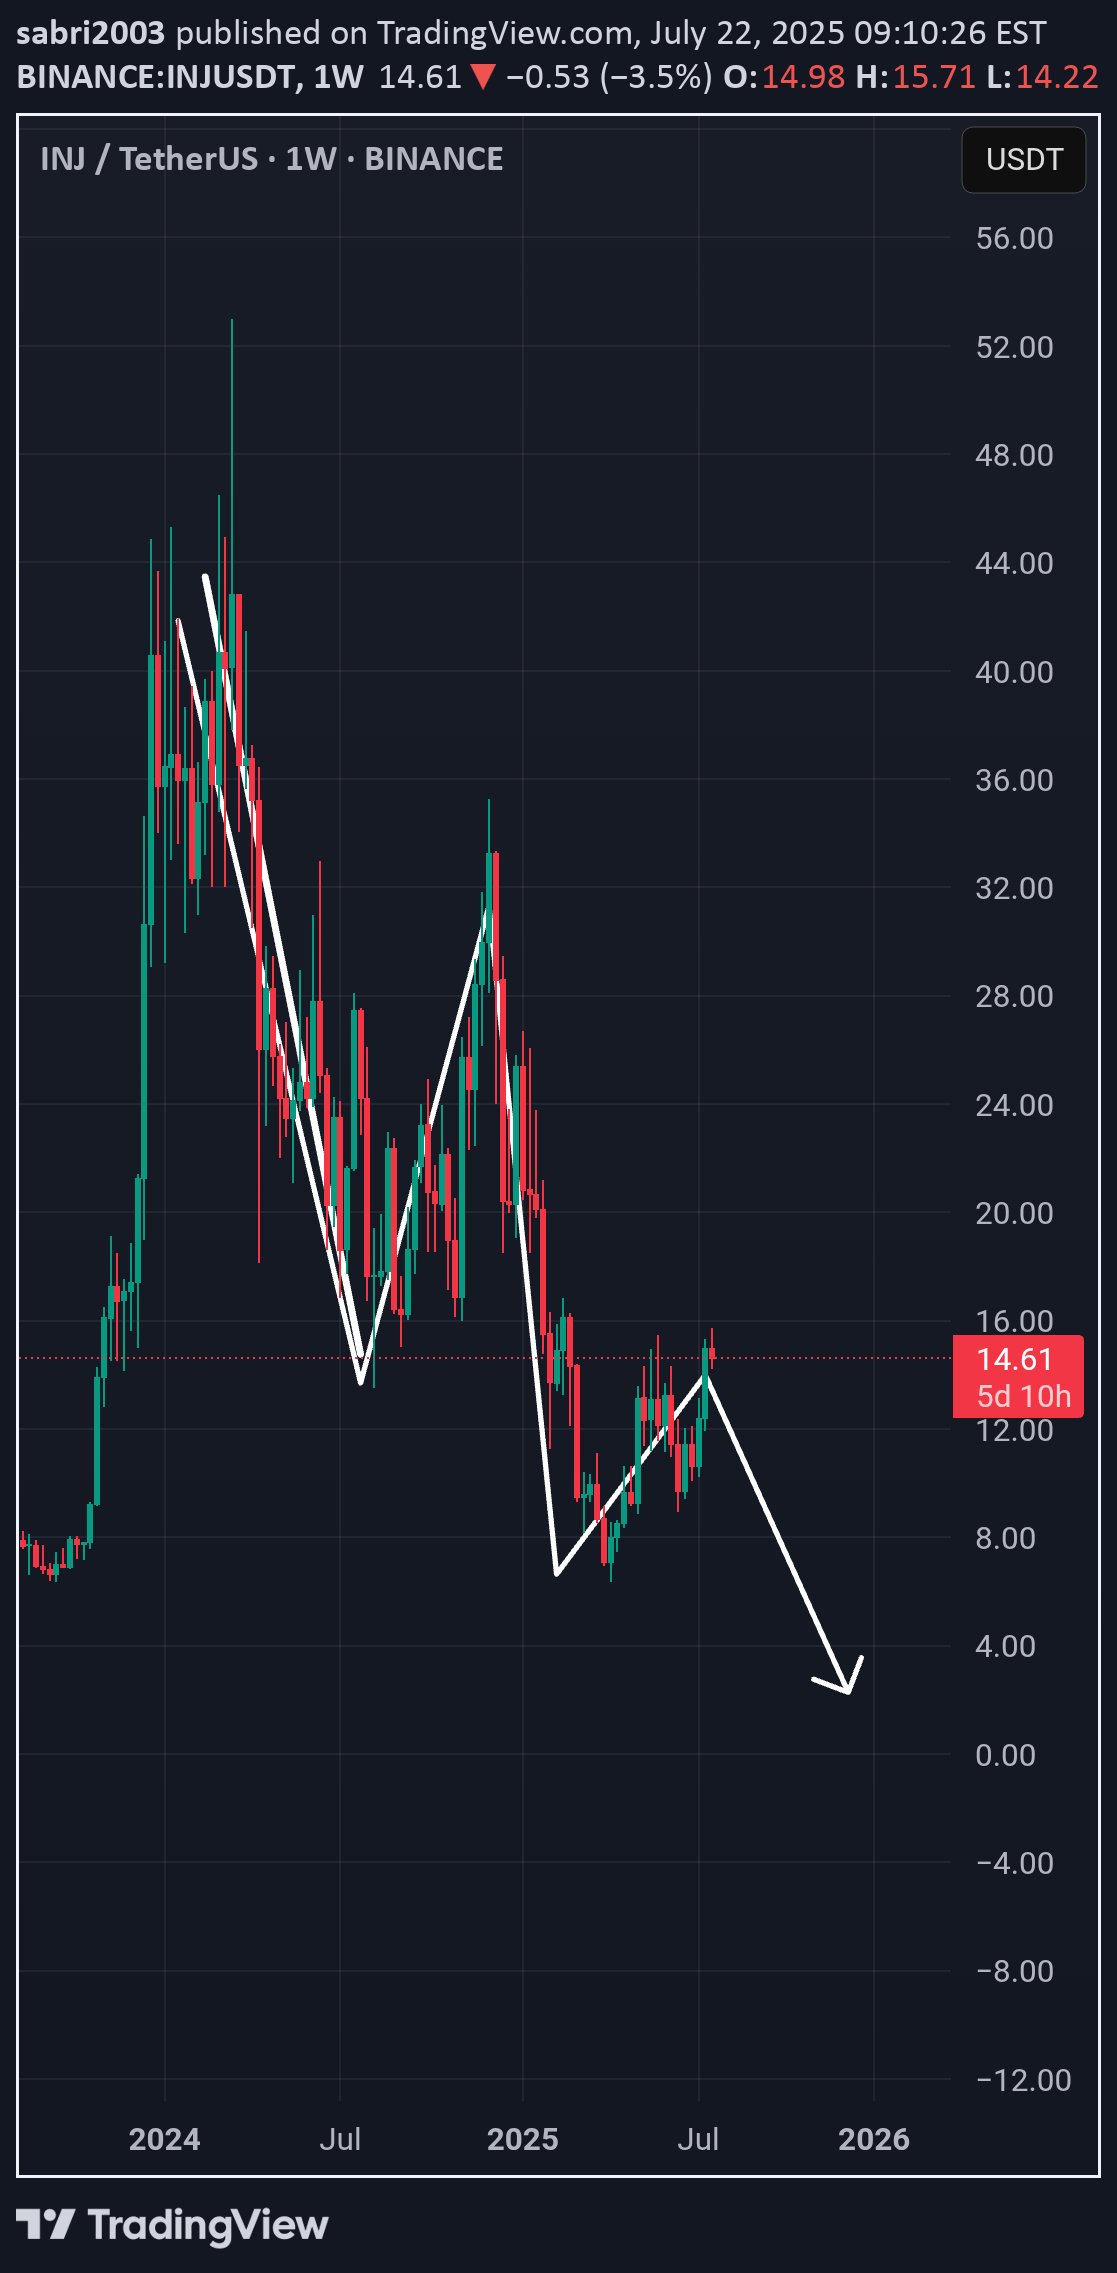
Inj coin on a corrective area in preparation for the continuation of the decline. Warning: They get you to buy in order to drain your money. This is not financial advice, do your own research.🤣✌️
sabri2003
Sale
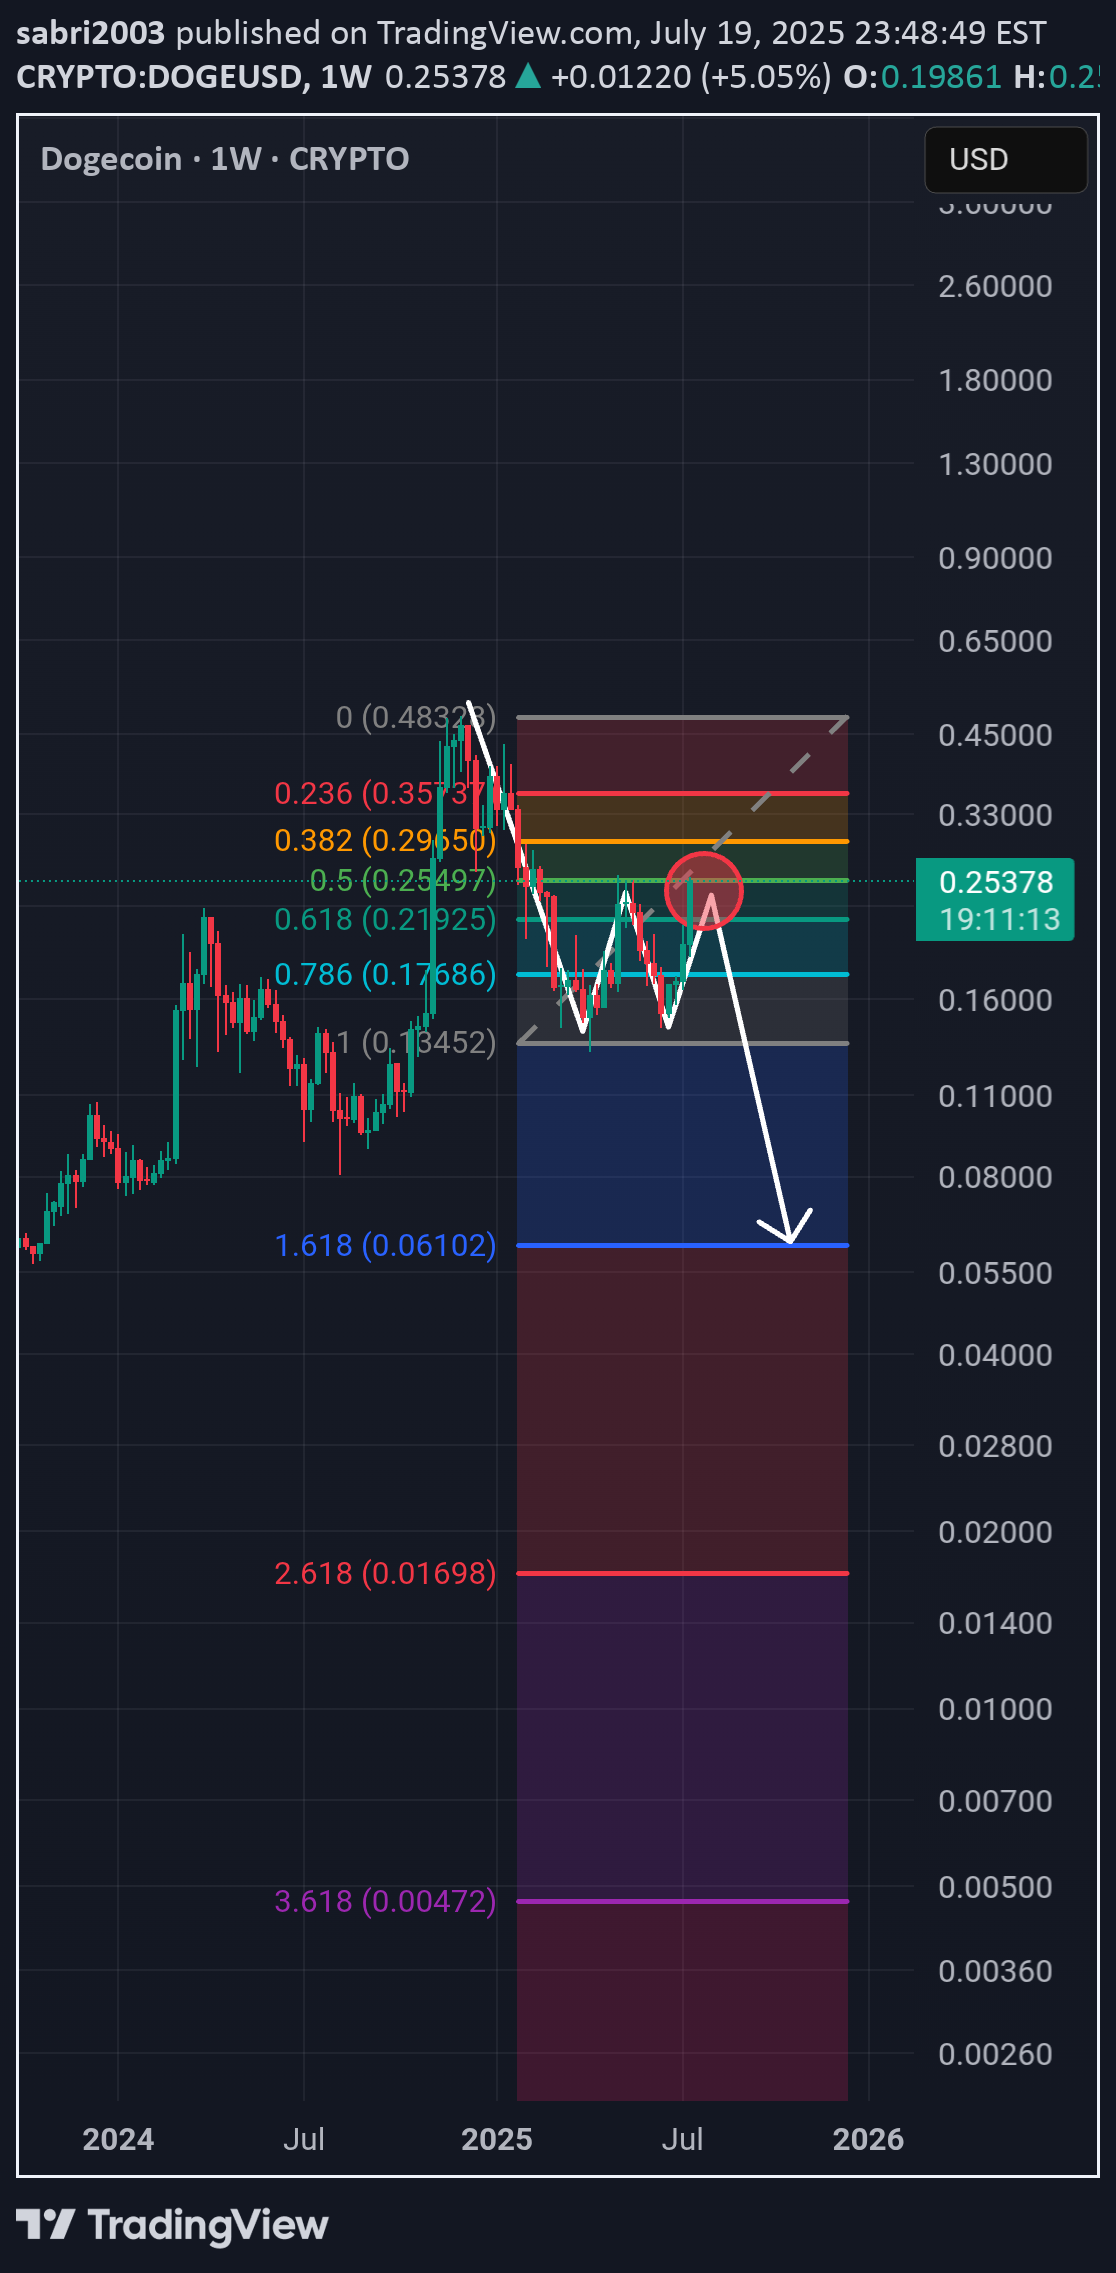
Doge coin is in a corrective phase and there is a high possibility of a decline. Warning, this is a dangerous area; they might get you into buying as After that, the price decreases.
sabri2003
buying??!@

Dogecoin temporary buy strong corrective zone after that strong possibility of continued downward trend unless confirmed to break the general downward trend and bullish trend
sabri2003
Bay?

Dogecoin is in a strong buying zone. There are strong manipulations at this stage. They push you into selling, then you see the price soar. This is not financial advice. You should conduct your own research
Disclaimer
Any content and materials included in Sahmeto's website and official communication channels are a compilation of personal opinions and analyses and are not binding. They do not constitute any recommendation for buying, selling, entering or exiting the stock market and cryptocurrency market. Also, all news and analyses included in the website and channels are merely republished information from official and unofficial domestic and foreign sources, and it is obvious that users of the said content are responsible for following up and ensuring the authenticity and accuracy of the materials. Therefore, while disclaiming responsibility, it is declared that the responsibility for any decision-making, action, and potential profit and loss in the capital market and cryptocurrency market lies with the trader.