professionaltrading70018
@t_professionaltrading70018
What symbols does the trader recommend buying?
Purchase History
پیام های تریدر
Filter
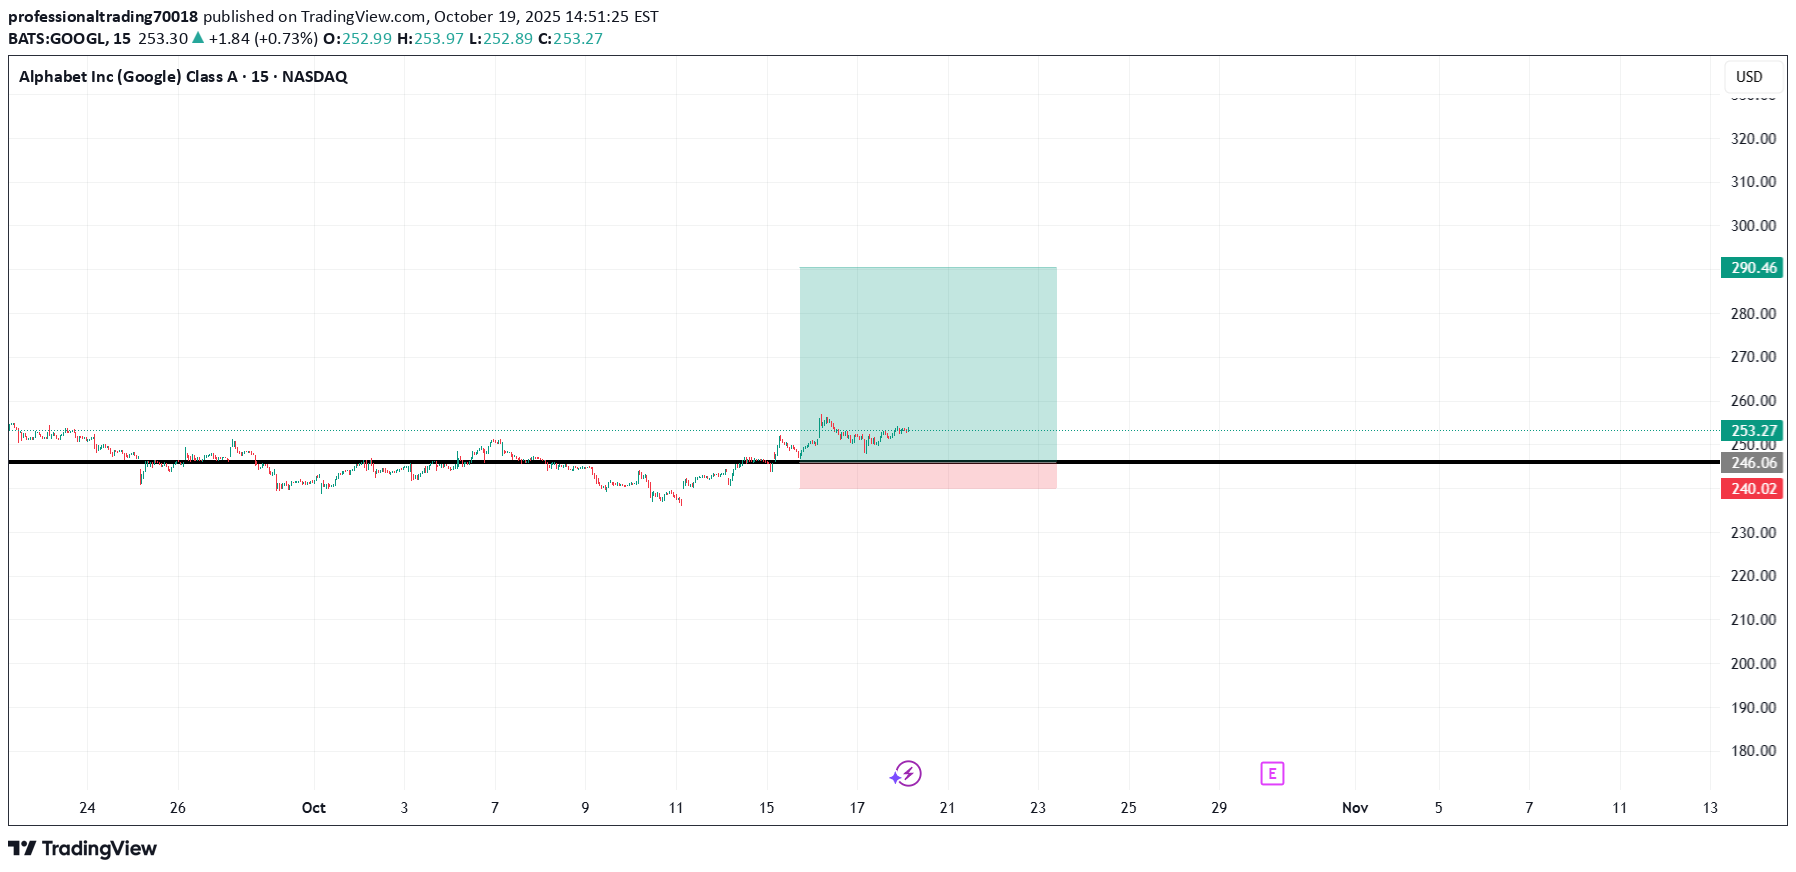
پیشنهاد خرید GOOGL: آیا مقاومت شکسته شده به کف حمایتی تبدیل میشود؟

Hello TradingView Community, This post outlines a potential long trade setup for Alphabet Inc (GOOGL) on the 15-minute chart. Technical Analysis: The chart highlights a key horizontal price level at approximately $246.06. This level previously acted as a significant resistance, capping the price on multiple occasions and creating a ceiling for the stock. We have recently seen a clear breakout above this resistance, which is a bullish signal indicating that buyers are taking control. The trading idea is based on the classic "resistance-turned-support" principle. The price is currently consolidating above this broken level, which is now expected to act as a new support floor. A successful hold of this area would suggest a continuation of the uptrend. Trade Setup: The long position tool on the chart visualizes the specific plan for this bullish scenario: Entry: Approximately $246.06 (at the retest of the new support). Stop Loss: $240.02 (placed below the key support structure to invalidate the idea if the level fails to hold). Take Profit: $290.46 (targeting a new potential higher high). This setup provides a structured plan with a favorable risk-to-reward ratio for a potential continuation of the bullish move. Disclaimer: This analysis is for educational and discussion purposes only and should not be considered as financial advice. Trading stocks involves significant risk. Please conduct your own research and manage your risk appropriately before making any trading decisions.
استراتژی طلای (XAUUSD) صعودی: چگونه در یک روند قوی، پلهای وارد شویم؟

Hello TradingView Community, This post outlines a bullish continuation strategy on the Gold Spot / U.S. Dollar (XAUUSD) pair, based on the 15-minute timeframe. The chart illustrates a method of systematically adding to a long position, or "pyramiding," in a strong uptrend. Technical Analysis: The chart is in a powerful uptrend, characterized by a clear series of higher highs and higher lows. The strategy employed here is to identify key horizontal resistance levels, wait for a decisive breakout, and then enter a long position on the retest of that former resistance as new support. We can see this "break and retest" pattern has been successfully applied at multiple levels, with each breakout providing a new opportunity to enter or add to a long position. Current Trade Setup: The most recent setup is based on the breakout above the $4,278.56 level. The price has pushed above this former resistance, and the idea is to look for another long entry on a pullback to this new support zone, continuing the established pattern. The latest long position tool on the chart visualizes this trade plan: Entry: Approximately $4,278.56 (at the retest of the new support). Stop Loss: $4,235.87 (placed below the key support structure to invalidate the idea if the level fails to hold). Take Profit: $4,410.93 (targeting a new higher high in the trend). This setup provides a structured way to continue capitalizing on the existing bullish momentum by scaling into the trend at logical technical points. Disclaimer: This analysis is for educational and discussion purposes only and should not be considered as financial advice. Trading commodities involves significant risk. Please conduct your own due diligence and manage your risk appropriately.

Hello TradingView Community, This post outlines a potential short trade setup for Alphabet Inc (GOOGL) on the 15-minute timeframe. Technical Analysis: The chart highlights a key horizontal price level at approximately $246.82. This level previously served as a solid support zone, holding the price up on multiple occasions. We have recently witnessed a decisive breakdown below this support, indicating a shift in momentum to the bearish side. The price is now trading below this broken structure. The trading idea is based on the classic "support-turned-resistance" principle. We are looking for a pullback to this former support level, anticipating that it will now act as a new ceiling and reject the price, leading to a continuation of the downtrend. Trade Setup: The short position tool on the chart visualizes a potential trade plan based on this bearish scenario: Entry: Approximately $246.82 (at the retest of the new resistance). Stop Loss: $261.70 (placed above the resistance zone to invalidate the idea if the price reclaims the level). Take Profit: $201.93 (targeting a new potential swing low). This setup provides a structured plan with a clear risk-to-reward ratio for a potential move lower. Disclaimer: This analysis is for educational and discussion purposes only and should not be considered as financial advice. Trading stocks involves significant risk. Please conduct your own research and manage your risk appropriately before making any trading decisions.
Disclaimer
Any content and materials included in Sahmeto's website and official communication channels are a compilation of personal opinions and analyses and are not binding. They do not constitute any recommendation for buying, selling, entering or exiting the stock market and cryptocurrency market. Also, all news and analyses included in the website and channels are merely republished information from official and unofficial domestic and foreign sources, and it is obvious that users of the said content are responsible for following up and ensuring the authenticity and accuracy of the materials. Therefore, while disclaiming responsibility, it is declared that the responsibility for any decision-making, action, and potential profit and loss in the capital market and cryptocurrency market lies with the trader.