
polarity
@t_polarity

What symbols does the trader recommend buying?
Purchase History
پیام های تریدر
Filter
polarity
سطوح کلیدی اتریوم (ETH): موجهای احتمالی و نقاط حساس فیبوناچی که باید مراقبشان باشید!

Quick and simple analysis. We have some key Fibonacci level coming up, if all of them failed, we are likely to go back to the bottom of the channel. Watch for small bounces between those level. I suspected that we are in Wave A of the ABC corrective structure, the next run up could be a Wave B correction that goes up, then we will come down again. Trade with caution!
polarity
طلا در آستانه سقوط یا اوج؟ سطوح حیاتی مقاومت و تقاضا در نمودار

Gold (XAU/USD) has been trading within a well-defined ascending channel after its late-October selloff. The current structure shows clear supply (resistance) and demand (support) zones, giving traders a map of where the next move might originate. After forming a base around $3887–$3940, price has been climbing steadily in a corrective channel, reaching near-term resistance between $4008 and $4070 — the two major red zone on the chart. This area coincides with: 0.236–0.382 Fibonacci retracement of the previous major swing A cluster of prior rejections, suggesting strong overhead supply The upper boundary of the rising channel, often a zone for exhaustion or short setups The Resistance Zones (Supply) There are two major resistance levels to watch: Target 1: $4000 – $4070 → The top red box. A clean break and close above this could open the door for a test of the higher range. Target 2: $4127 – $4184 → The deeper retracement zone (Fib 0.5–0.618). This would be a natural target if bulls manage to clear the first wall of sellers. However, both zones represent potential turning points. Failure to break through convincingly could confirm this move as a B-wave rally or wave-4 correction within a broader downtrend. The green zone near $3887–$3940 remains the critical demand area — buyers have consistently stepped in here. It’s backed by: Multiple reaction lows Volume accumulation A confluence with the lower boundary of the ascending channel If this level fails, it would likely confirm a larger corrective leg down, potentially targeting $3800 or lower. Elliott Wave Context (Optional Section) From a wave perspective, the current structure may represent a Wave 4 corrective channel within a larger 5-wave decline. If correct, a final Wave 5 drop toward the demand zone would complete the structure before a larger bullish reversal. (If the rally breaches $4184, that invalidates this count and shifts the bias to a broader Wave 1–2 bullish sequence.) Gold remains range-bound between a strong demand base near $3900 and heavy supply overhead near $4070–$4180. Until one side gives, short-term traders may find better setups playing these ranges with tight risk management. Key Levels to Watch: Resistance: $4070, $4127, $4184 Support: $3940, $3887 Bias: Neutral → Bearish unless above $4070 Note I did not even finish writing this, Gold had alread broke through the first resistance, and now heading to the 0.382 fib level
polarity
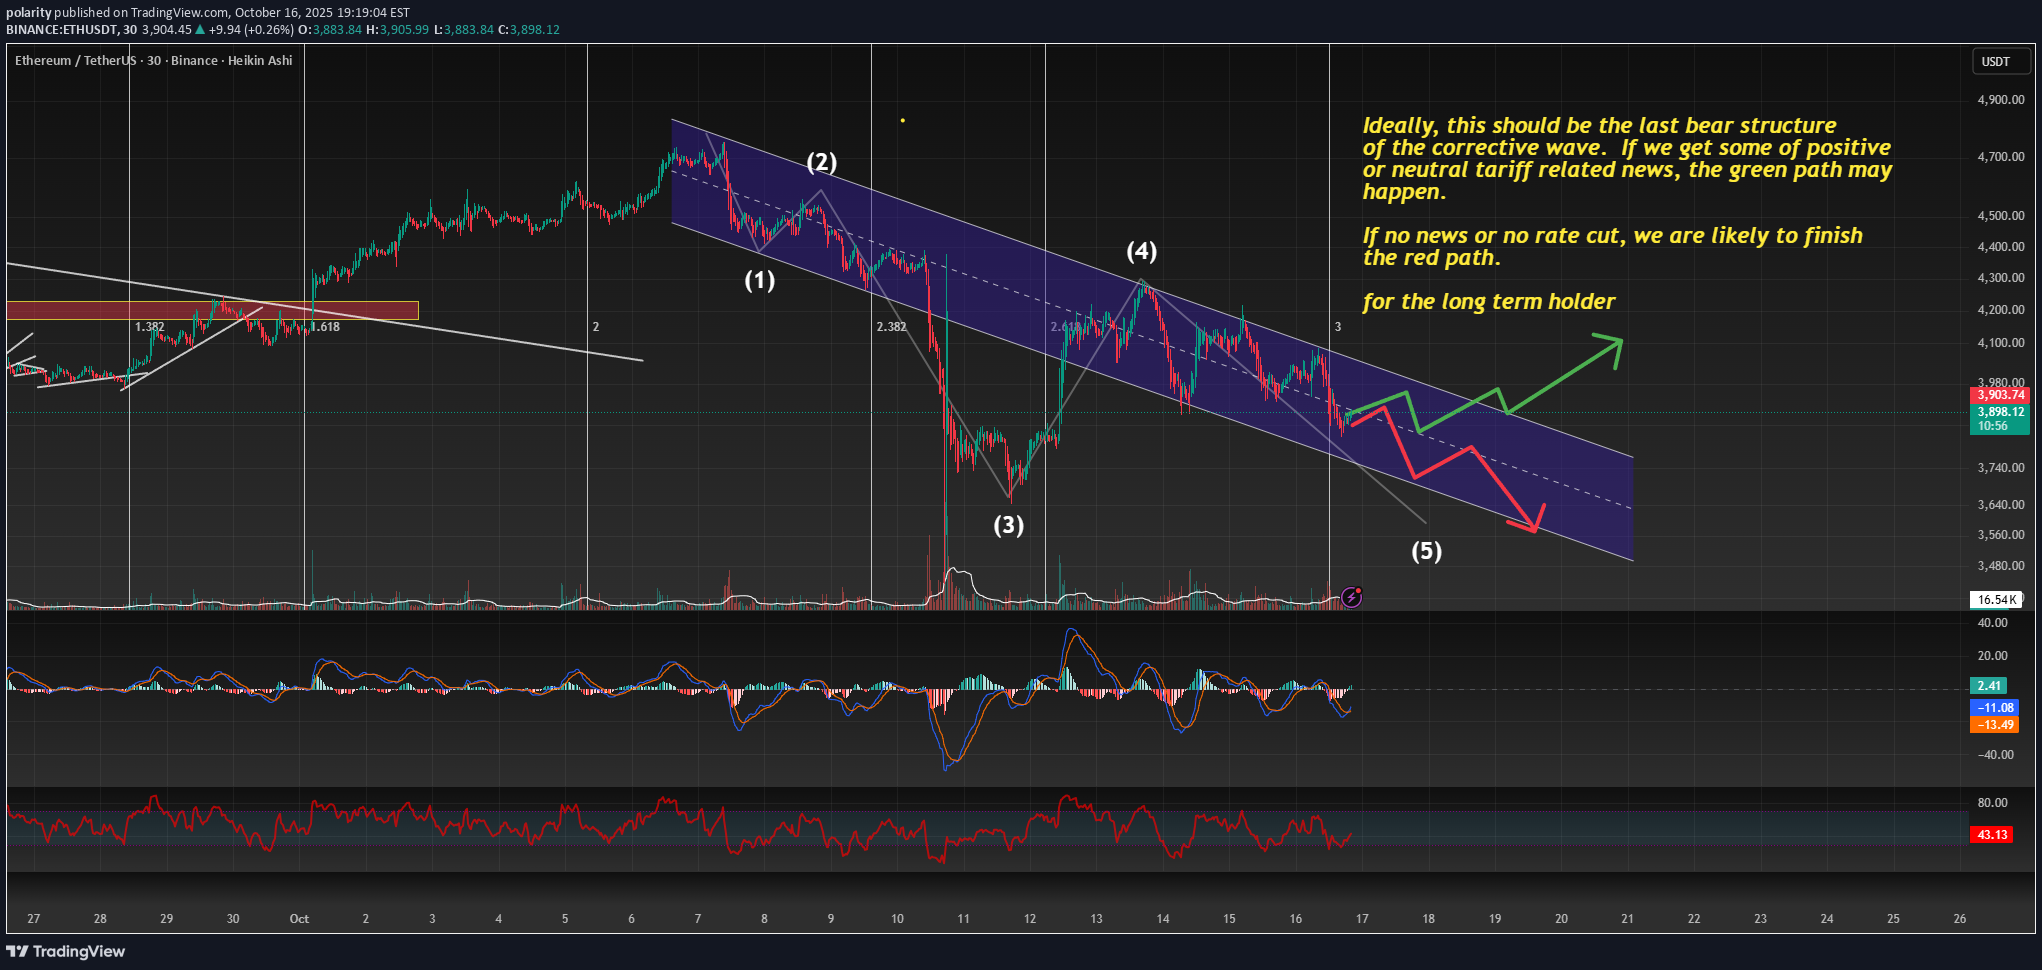
تراکنش 4 مرحلهای اتریوم: راز صعود بزرگ بعدی کجاست؟

After visiting the demand zone 4 times, ETH finally got some traction. I got in a long after the 4th time hitting the demand zone, now waiting for a break out confirmation to visit the next run up. Watch the 3 key levels in yellow for TP target / break out for continuations. Happy Trading! Don't over leverage and make sure you have stop loss to prevent down side risk from market spike. Not financial advise, this is pure speculation.ETH got rejected at the first key level. on its back back to supply zone, it will likely to finish off wave 5 before a move up. The demand zone is a critical level that needs to hold, if we break it we can head to low 3600Opps, I meant to say back to the "demand zone", after the first rejection, not "supply zone".
polarity
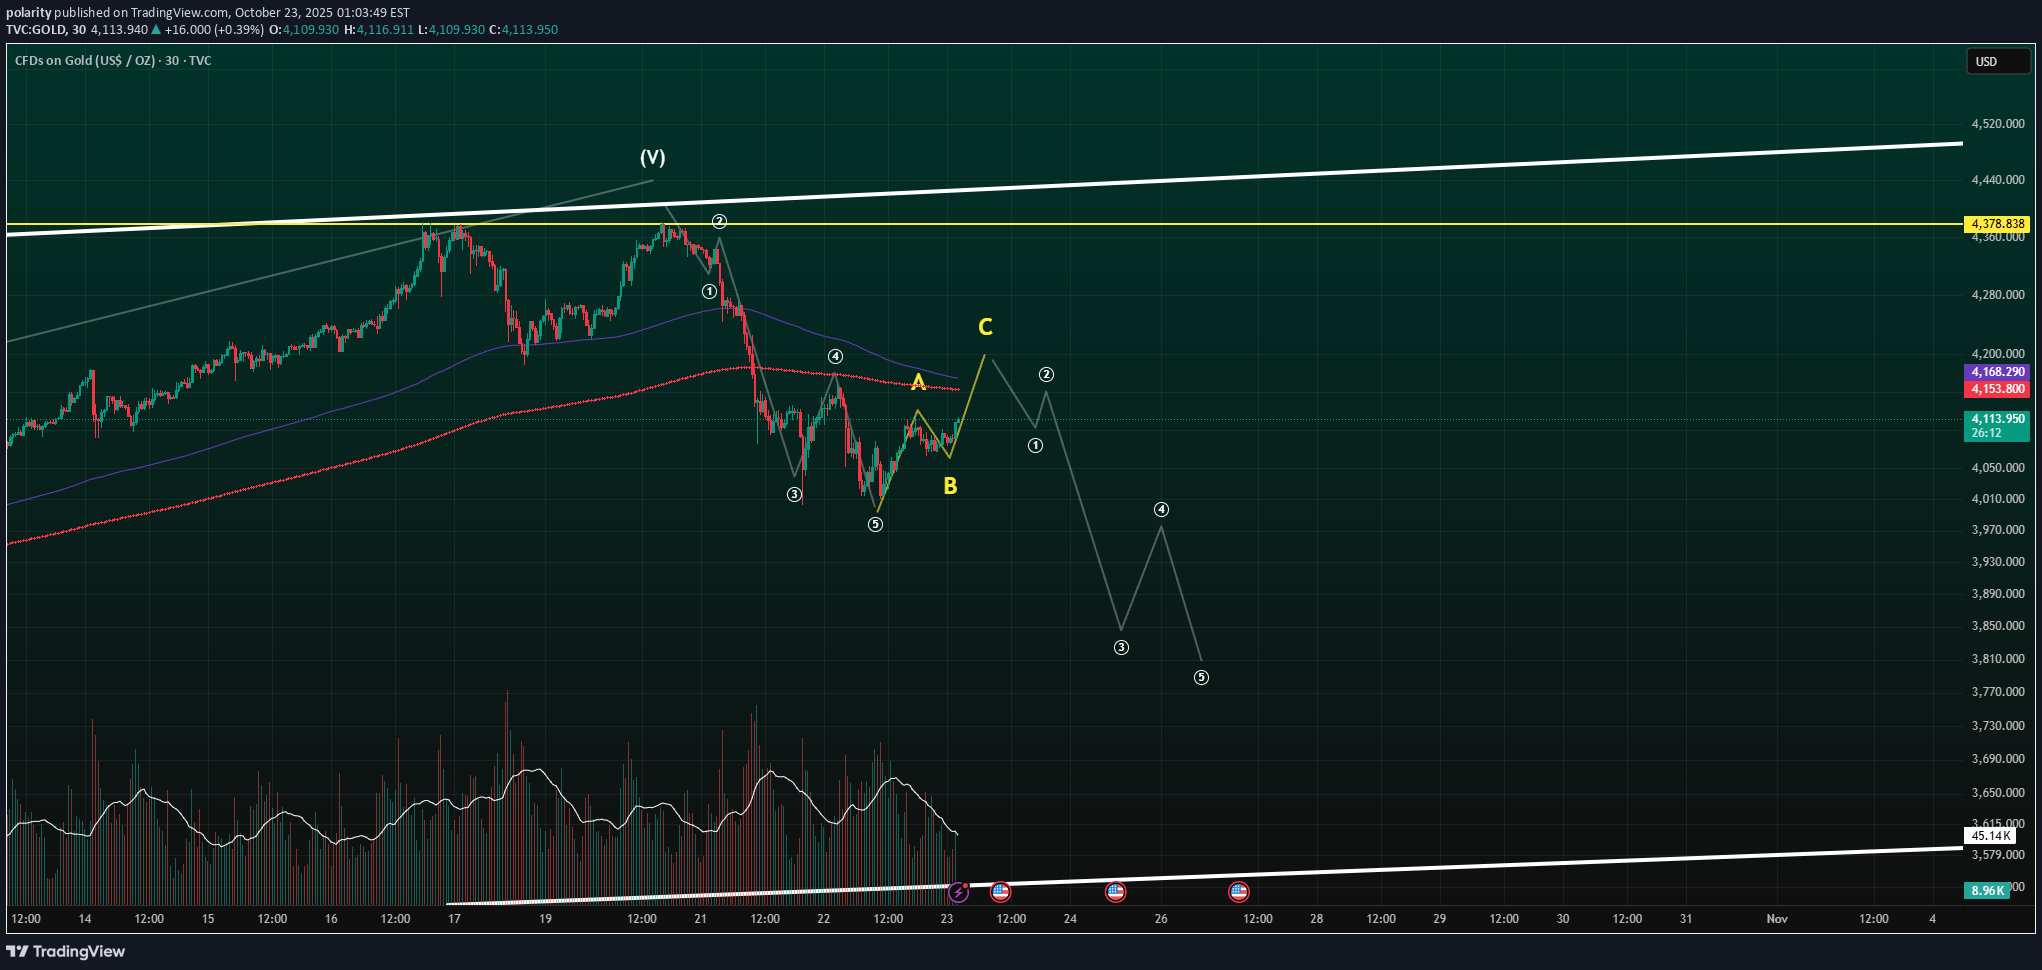
آغاز موج جدید: آیا موج سوم قدرتمند در راه است؟ (پیشبینی قیمت و سطوح کلیدی)
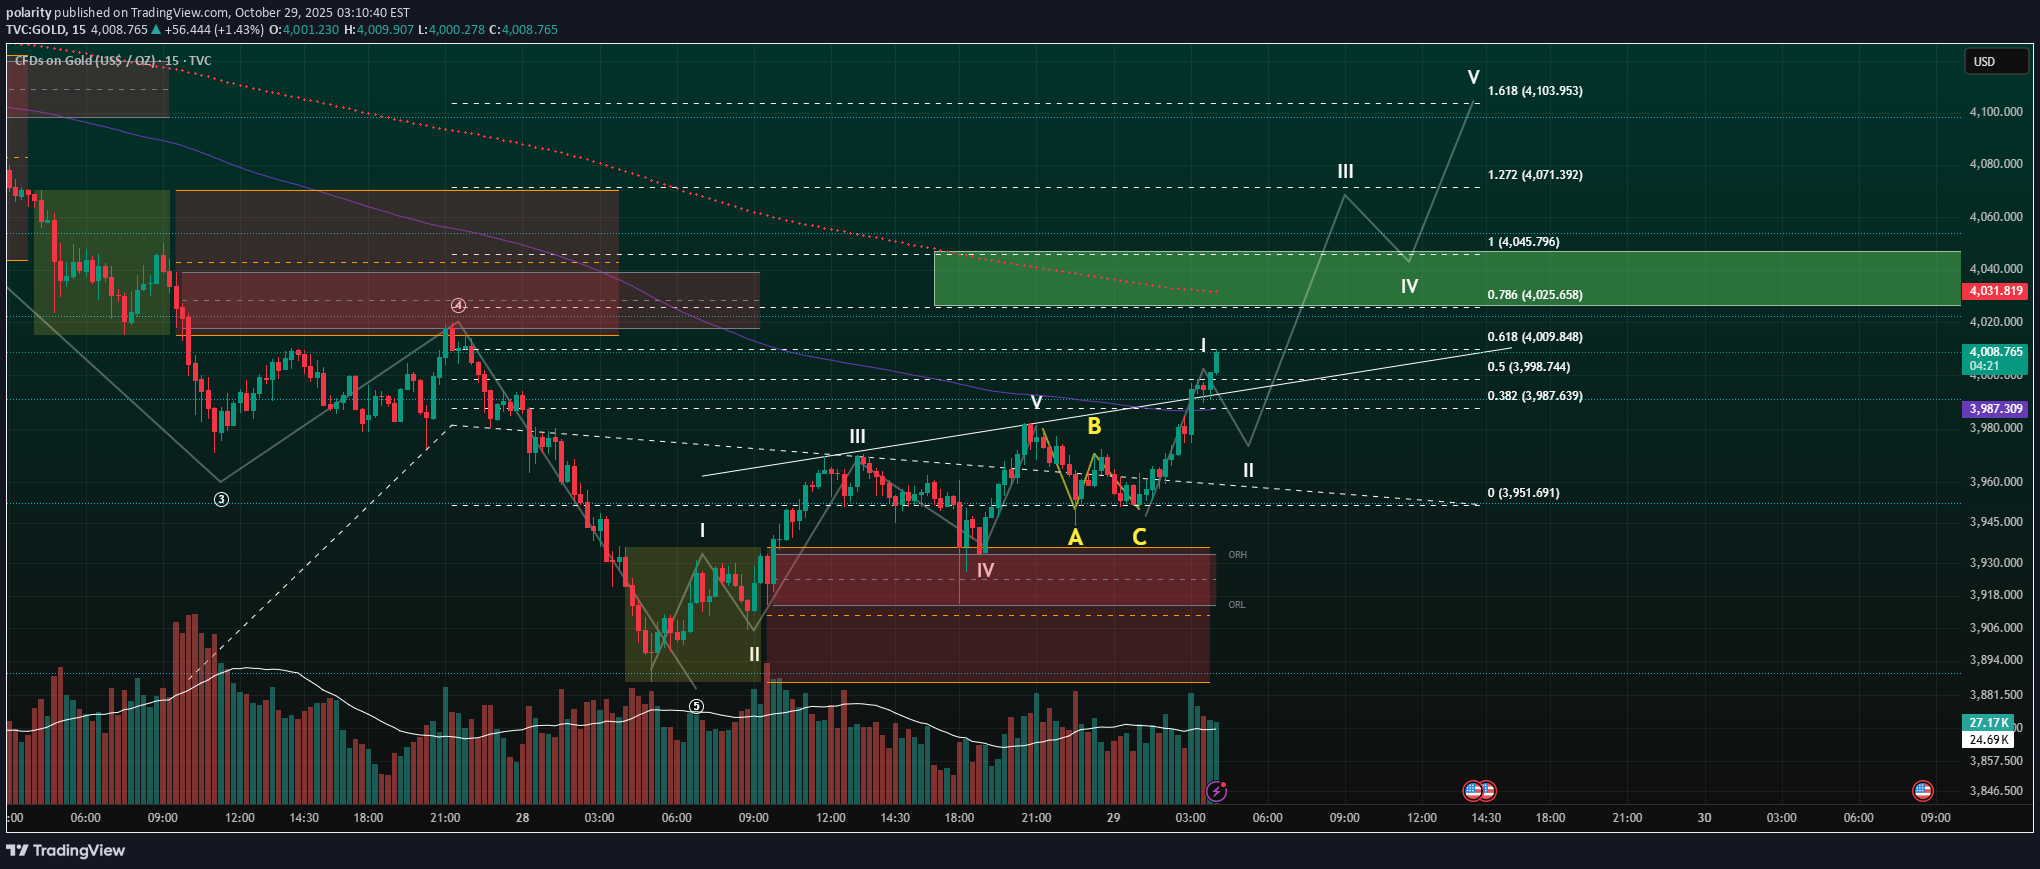
It looks like we are entering sub wave 1 of Wave 3 of the current impulsive wave. Watch all of the usual fib extension 0.786 ~ $4025 1.00 ~ $4045 1.272 ~ $4071 1.618 ~ $4103 Good luck to all !
polarity
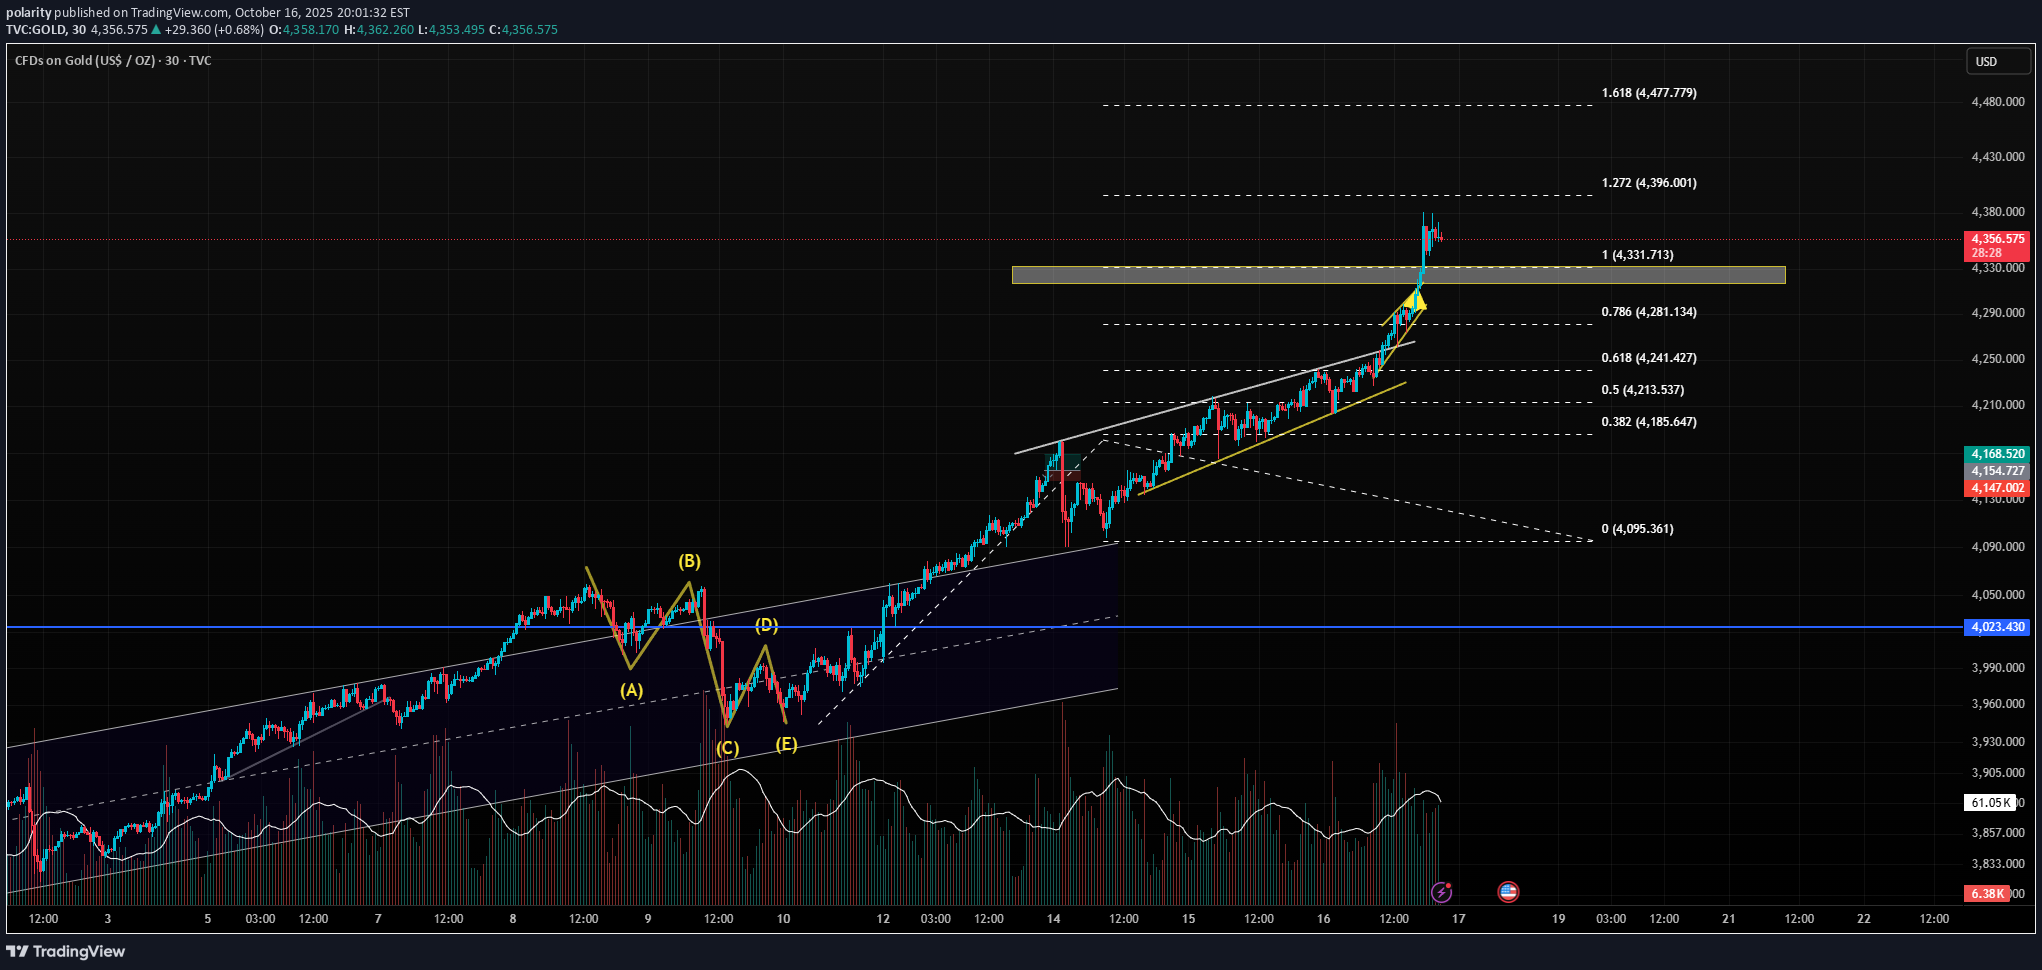
سه نشانه تکنیکال طلا: آیا این نقطه، آغاز موج صعودی اصلاحی است؟
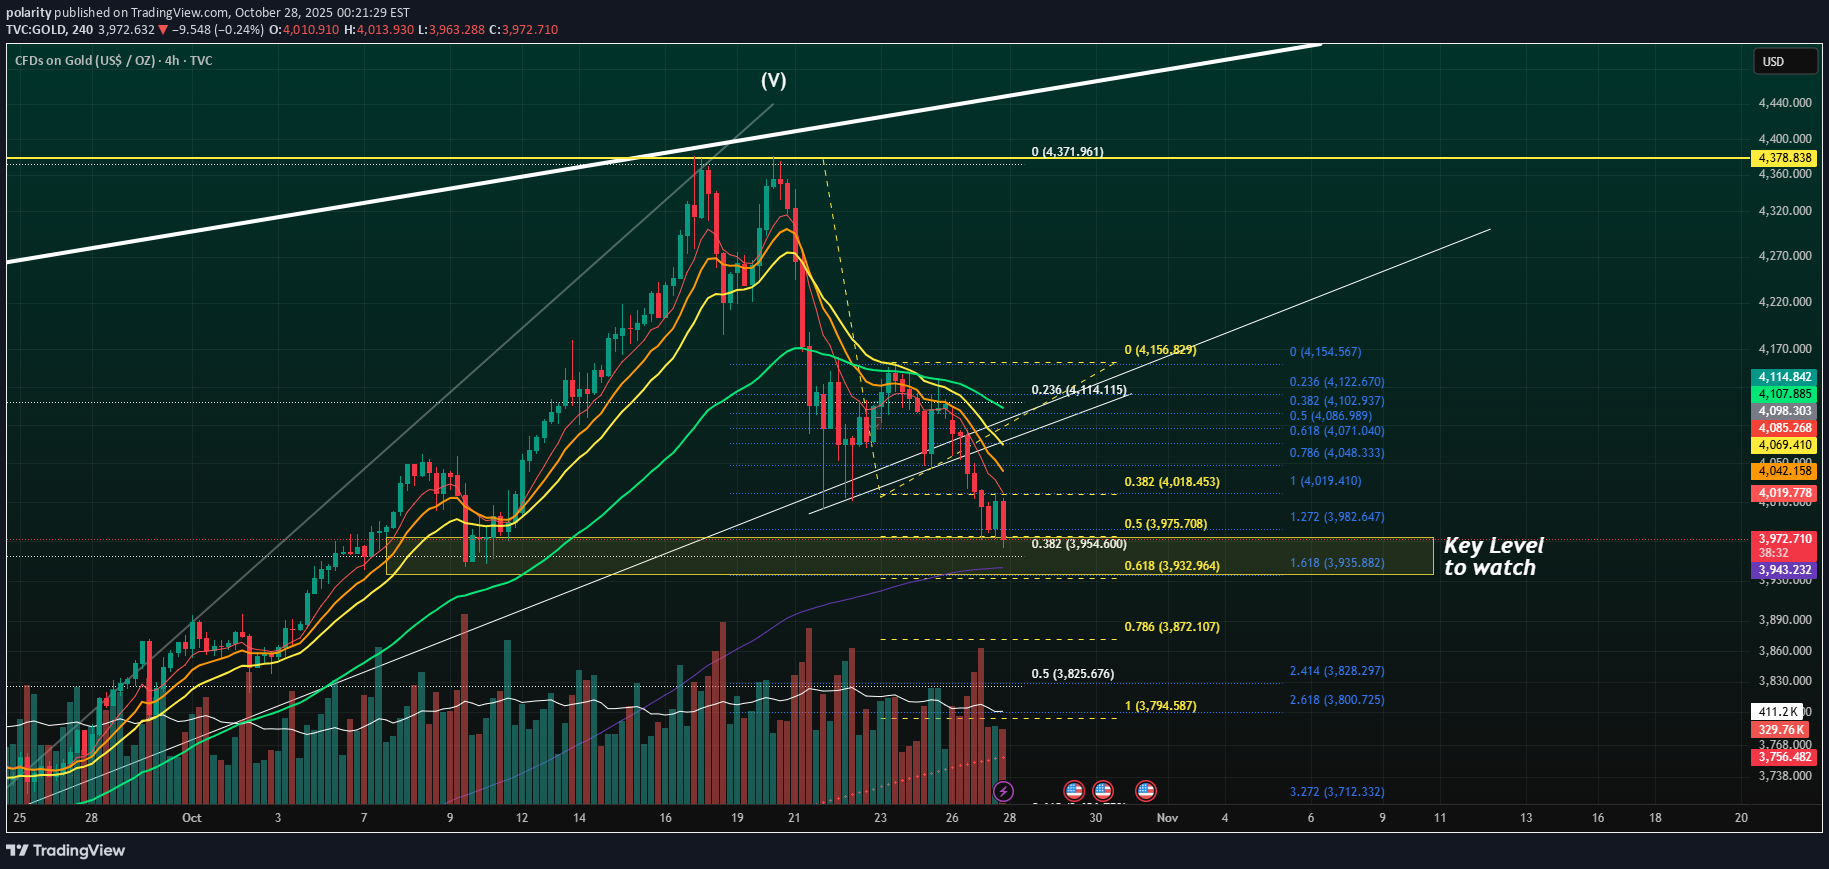
Gold Futures: The Alignment for the three Fibonacci Key Zone , 100 days SMMA approaching, and previous major support. Is this our key level for the first corrective up wave?It failed 0.382 fIb (yellow box on chart). 0.5 fib next ~ $3825
polarity
اصلاح بزرگ طلا آغاز شد؟ تا کجا سقوط خواهیم کرد؟
Gold had a good run for a while now, It looks like our corrective wave have officially started. Crossing my fingers on this, let see if we can bring this all the way down to lower trend line.
polarity
اعتماد به شمارش موج: راز موفقیت معاملهگر با وجود نوسانات شدید بازار
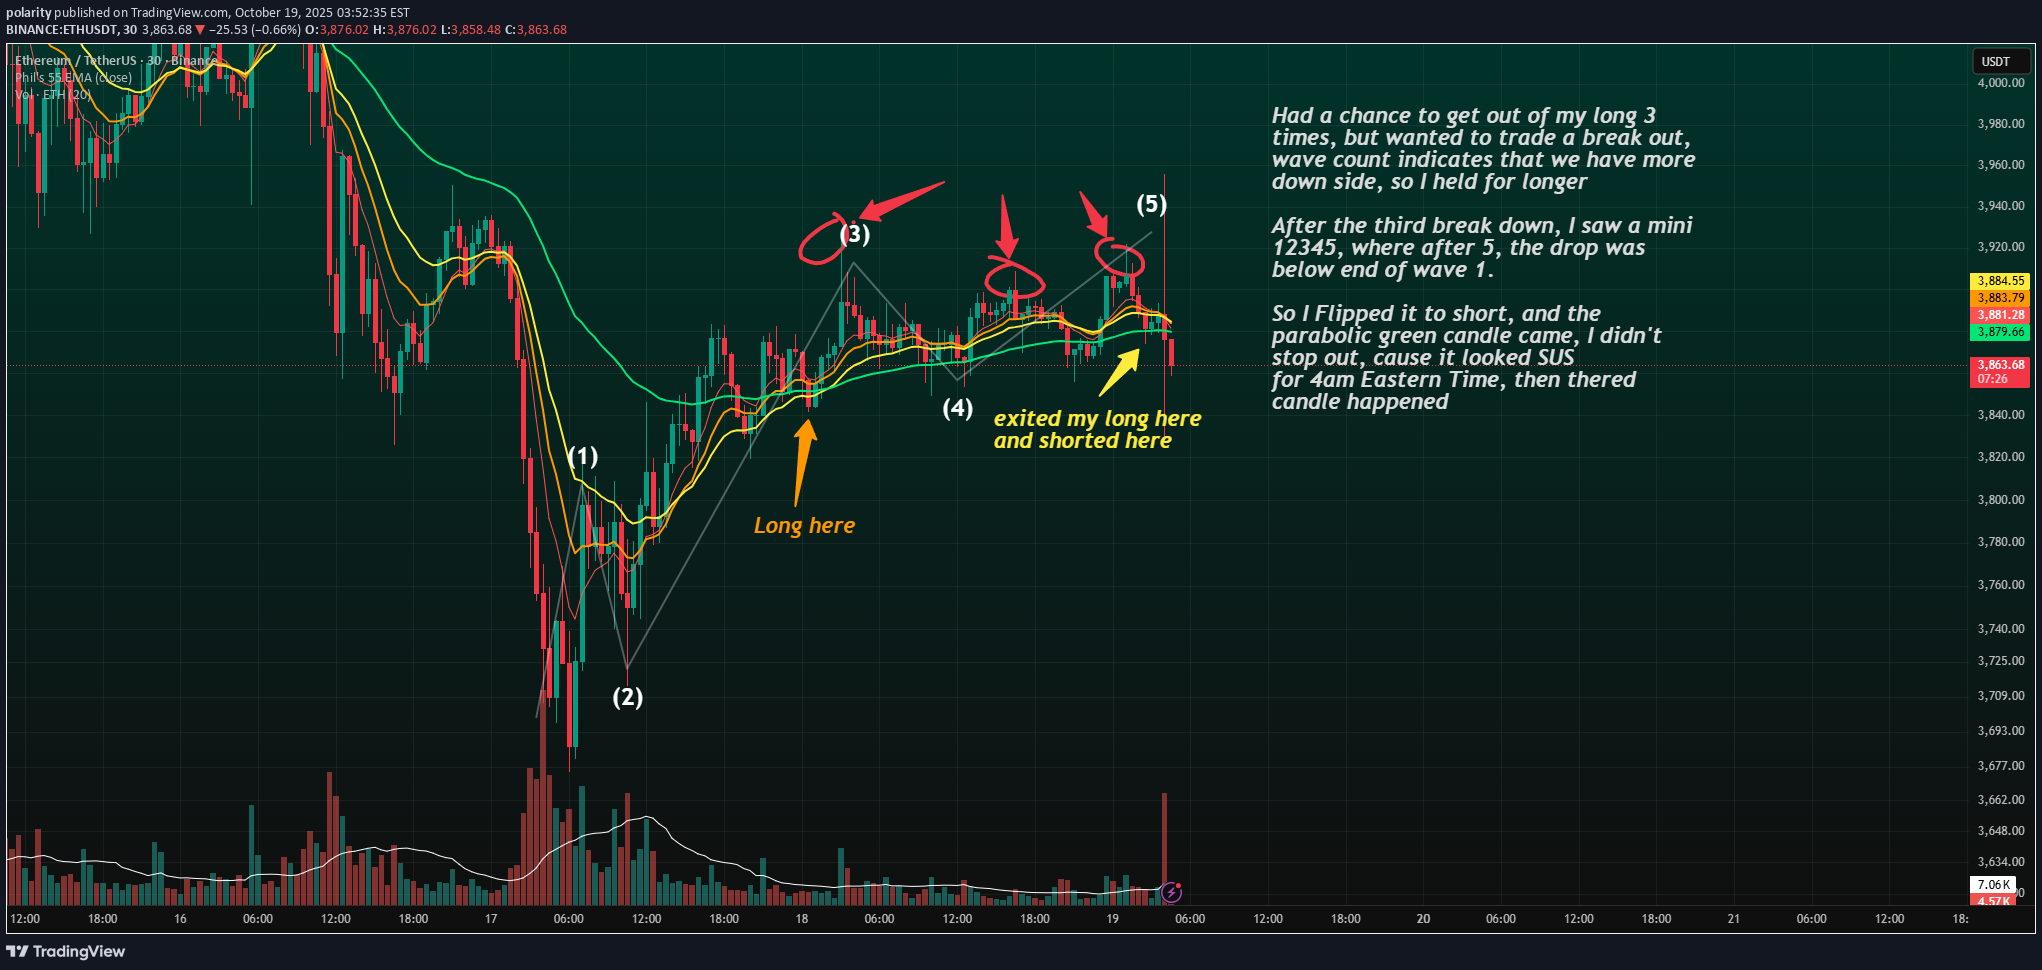
I originally went long after seeing a potential breakout setup, expecting a higher time frame Wave 5 to unfold. I had multiple chances to take profit on the way up (marked with red circles), but decided to hold since my wave count suggested there was more upside ahead. After the third rejection, I spotted a clean mini 1-2-3-4-5 structure, and once Wave 5 completed, price broke below the end of Wave 1 — which confirmed weakness. I flipped short right after exiting my long. Almost immediately, a parabolic green candle appeared around 4 AM EST, which looked suspicious to me. I held through it instead of panic-stopping, because the structure still looked like a completed impulse followed by a correction. Zooming into lower time frames gave further confidence in the five-wave completion, supporting the short setup.
polarity
پایان موج 5؛ کف فیبوناچی بعدی کجاست؟ (احتمال 94 هزار!)
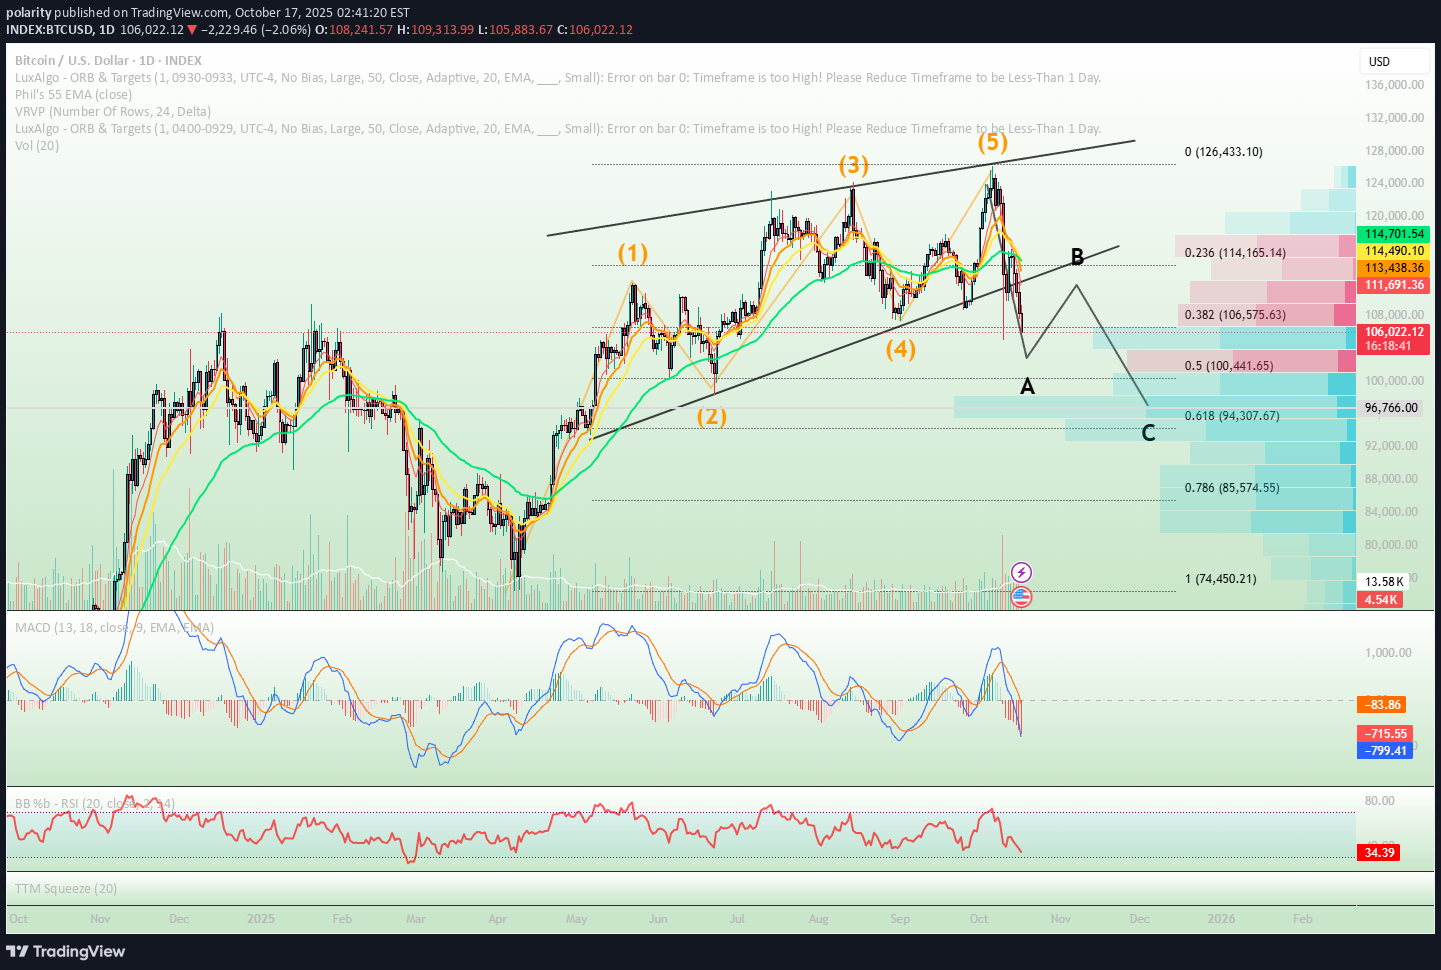
The 5 wave pattern with the leading first wave have played now, now we get to play ABC corrective. I think 94k is in play. Please do not over leverage in this environment
polarity
وقتی طلا و بورس با هم بالا میروند: راز جدید بازارهای جهانی
When I was younger, my economics professor taught me something simple: “Gold tends to go up when the stock market goes down.” Back then, that seemed almost like a law of nature. Stocks fall, gold rises. One hedges the other. But as the years passed, I started to see something different. Both gold and the stock market began to climb at the same time. I’m not saying my professor was wrong. I’m saying the world has changed. We now live in an information-driven era, where news travels faster than it takes me to step out of my car. Markets no longer react to events in a slow, linear way. Reactions are instant, global, and often emotional. And that emotion... comes from all of us trying to process data we don’t fully understand. 🧠 Smart Money Behavior When the S&P 500 reaches levels that feel “too high, too fast,” smart money starts quietly buying gold. Not because they expect stocks to crash tomorrowm, but as a hedge against a bubble they can see forming before the crowd does. When the bubble finally bursts, gold is expected to run. Historically, gold has been the safe haven for people who lived through instability. In many countries, when their economy collapsed, gold was the one thing that preserved value when everything else crumbled. ⚠️ The Real Question Right now, gold has broken through almost every resistance level on the chart. Nobody truly knows how high it can go. But here’s the uncomfortable truth: “When the time comes to sell, who will be left to buy?” Without buyers, even the most loved assets can lose value fast. When both your favorite assets; stocks and gold start dropping together, that’s when conviction is tested. 🧭 The Exit Plan The chart shows momentum, yes. But momentum is not certainty, and eventually the fuel runs out. If you’re long, it’s smart to enjoy the ride but also know your exit before the crowd starts looking for theirs. Because the worst time to make a plan… is when the house is already on fire. My plan is to wait for a pull back that bounce off of a previous resistance, and see if this rocket ship take me to the penthouse at the 1.618 Fib, as it's looking like we are in some sort of wave 3 with tones of momentum. I was in a position earlier right before the New York session closed, I had a long day and decided to exit before my price target. But like all "self proclaimed" traders, as soon as you sell, you walk away from it, when you come back after 10 mins. I guess i didn't have the balls to follow my plan. My plan now is simple: wait for a pullback to a previous resistance level and see if it holds as support. If it does, and momentum stays strong, I’ll ride this rocket ship toward the 1.618 Fibonacci extension, which lines up perfectly with what looks like a powerful Wave 3 structure. Earlier today, right before the New York session closed, I was already in a position. I’d had a long day, so I closed out early before hitting my price target. And like every “self-proclaimed trader,” the moment I walked away, price took off exactly how I imagined. When I came back 10 minutes later... well, let’s just say I didn’t have the guts to fully trust my plan. As always trade with a stop loss, the key is to live to trade another day.
polarity
نقطه عطف اتریوم: آیا اخبار، شکست فنی را قبل از تکمیل ساختار رقم میزند؟
Market Structure Outlook If you zoom out to a 4-hour time frame, the current structure resembles a corrective Wave 4 within a larger 1-2-3-4-5 impulsive wave. Based on the recent price behavior, it looks like we are forming Wave E within that corrective Wave 4. This is one of the most unpredictable parts of an Elliott Wave structure. To make things trickier, ongoing geopolitical tensions could easily push the market in either direction, amplifying volatility. From a structural standpoint: We may be in an incomplete Wave E that is trending downward. If any positive or neutral news (e.g., tariff or rate-related) comes out before the pattern finishes, it could push the price upward, breaking through the upper resistance and potentially initiating Wave 5. Alternatively, what appears to be Wave E could actually be the first subwave (1) of a larger Wave 3 or Wave 5, which would confirm a new impulsive leg starting soon. Keep in mind, this is a theoretical framework based on Fibonacci levels, trendline support/resistance, and typical wave structure behavior. It is not a prediction, but a scenario map that allows for: Bullish breakout (green path) if market sentiment improves or news provides a catalyst. Continuation to the downside (red path) if no significant positive catalyst appears. Use this framework as a conditional roadmap — adjust your positioning and risk accordingly, based on how price reacts to these key levels and structure boundaries.
Disclaimer
Any content and materials included in Sahmeto's website and official communication channels are a compilation of personal opinions and analyses and are not binding. They do not constitute any recommendation for buying, selling, entering or exiting the stock market and cryptocurrency market. Also, all news and analyses included in the website and channels are merely republished information from official and unofficial domestic and foreign sources, and it is obvious that users of the said content are responsible for following up and ensuring the authenticity and accuracy of the materials. Therefore, while disclaiming responsibility, it is declared that the responsibility for any decision-making, action, and potential profit and loss in the capital market and cryptocurrency market lies with the trader.