petitebud
@t_petitebud
What symbols does the trader recommend buying?
Purchase History
پیام های تریدر
Filter
Signal Type
petitebud

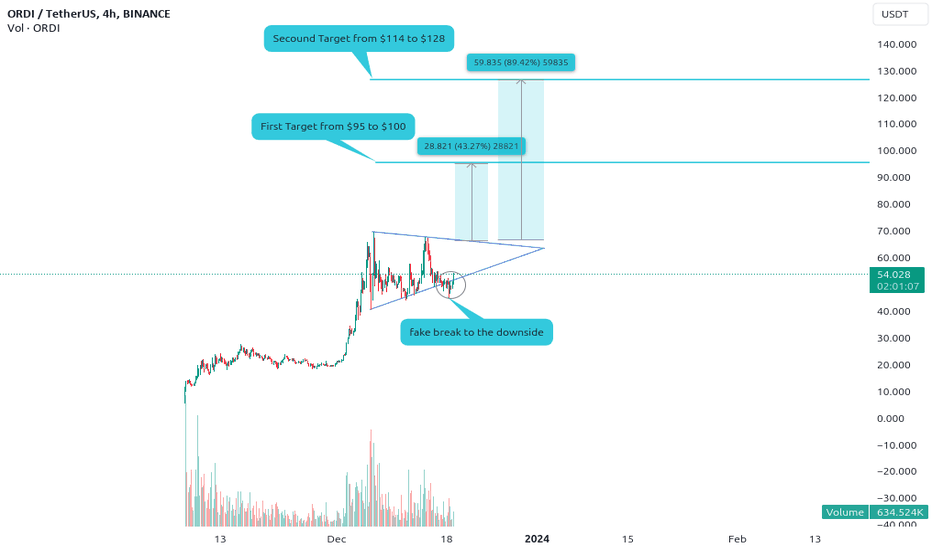
Based on the chart, there are several bullish patterns that could suggest the price of ORDIUSDT is poised for further upside movement. Here are a few indicators: Ascending Triangle: The price action is forming an ascending triangle, which is a continuation pattern that typically indicates a potential breakout to the upside. Rising Volume: The volume of trading has been increasing over the past few hours, which often accompanies bullish breakouts. Price Breaking Above Support: The price has recently broken above a key support level at 48.905 USDT. This level was previously acting as a constraint on the uptrend, and its breakout suggests that the upward movement may have gained momentum. If the price can sustain its gains above this level, it could further bolster the bullish sentiment. In the event of an upside breakout, the target price ranges are on the chart. Good LuckThe price quickly rebounding after a swift decline. What's next? Await the actual breakout to the upside, where the price is likely to rally.Trading was closed at $90
petitebud

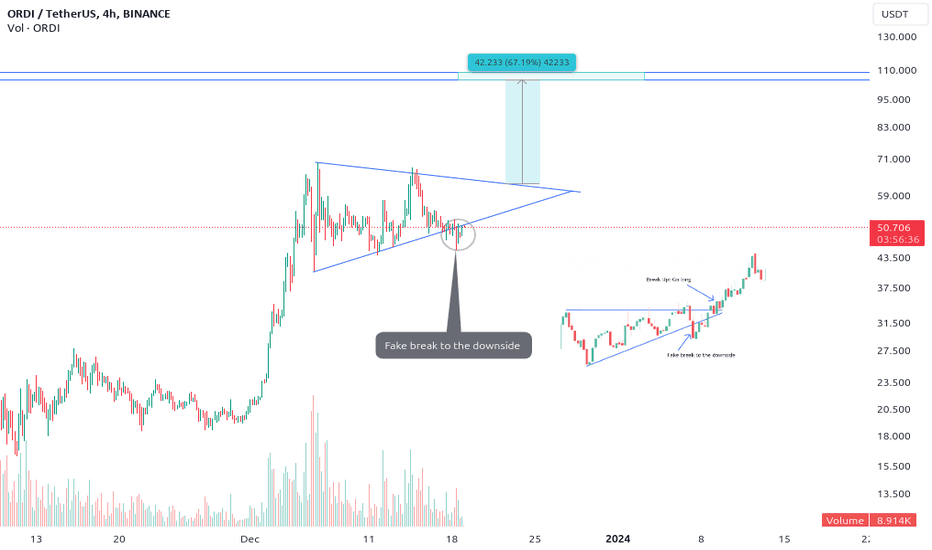
Based on the chart, there are several bullish patterns that could suggest the price of ORDIUSDT is poised for further upward movement. Here are a few indicators: Ascending Triangle : The price action is forming an ascending triangle, which is a continuation pattern that typically indicates a potential breakout to the upside. Rising Volume: The volume of trading has been increasing over the past few hours, which often accompanies bullish breakouts. Price Breaking Above Support : The price has recently broken above a key support level at 48.905 USDT. This level was previously acting as a constraint on the uptrend, and its breakout suggests that the upward movement may have gained momentum. If the price can sustain its gains above this level, it could further bolster the bullish sentiment. In the event of an upward breakout, the target price ranges from $105 to $110. Good LuckThe price quickly rebounding after a swift decline. What's next? Await the actual breakout to the upside, where the price is likely to rally.
petitebud

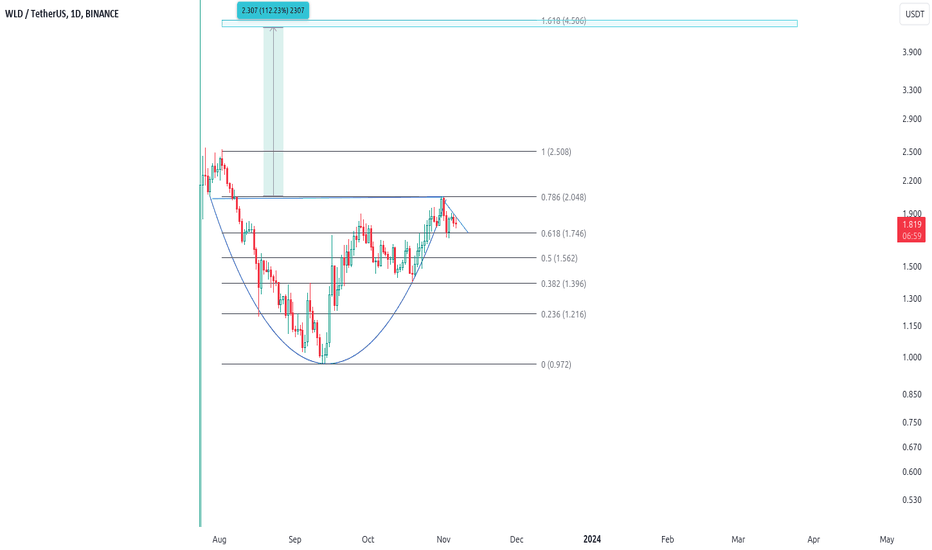
The chart of WLDUSDT clearly indicates the formation of a cup and handle pattern. If this holds true, I completely consider the possibility that the price could achieve the target indicated on the chart during this bull run. Purchase now or, between $1.81 and $1.78 Target range: $4.37 to $4.50 Stop loss at $1.70 Good luck!closed at $4.55, thanks for playing.
petitebud

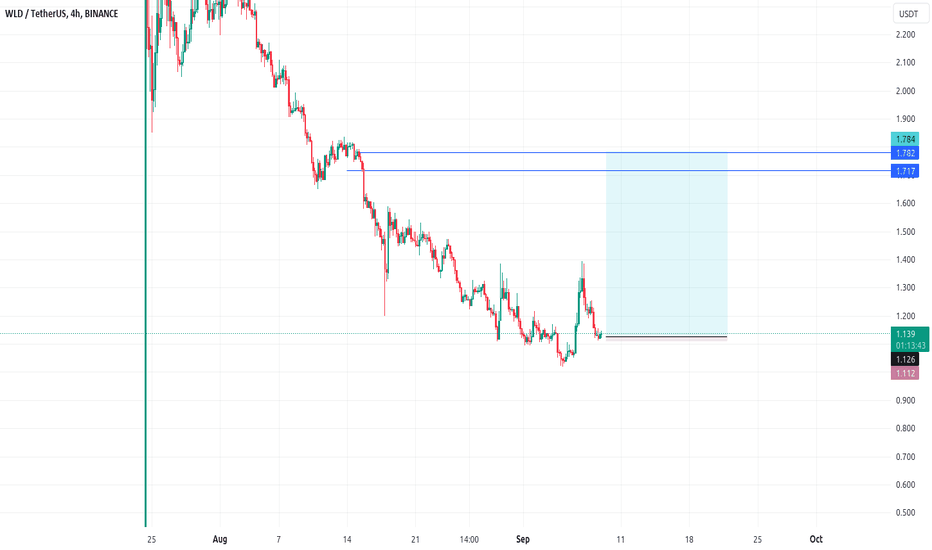
The current price of WLDUSDT is favorable for potential profits. If you're interested, please send me a private message for further details. I can provide you with optimal trades as long as the price remains above $1.12 Best of luck!
Disclaimer
Any content and materials included in Sahmeto's website and official communication channels are a compilation of personal opinions and analyses and are not binding. They do not constitute any recommendation for buying, selling, entering or exiting the stock market and cryptocurrency market. Also, all news and analyses included in the website and channels are merely republished information from official and unofficial domestic and foreign sources, and it is obvious that users of the said content are responsible for following up and ensuring the authenticity and accuracy of the materials. Therefore, while disclaiming responsibility, it is declared that the responsibility for any decision-making, action, and potential profit and loss in the capital market and cryptocurrency market lies with the trader.