
oyemyk
@t_oyemyk

What symbols does the trader recommend buying?
Purchase History
پیام های تریدر
Filter
oyemyk
شکست طلایی مثلث متقارن: فرصت فروش قریبالوقوع یا تله خریداران؟
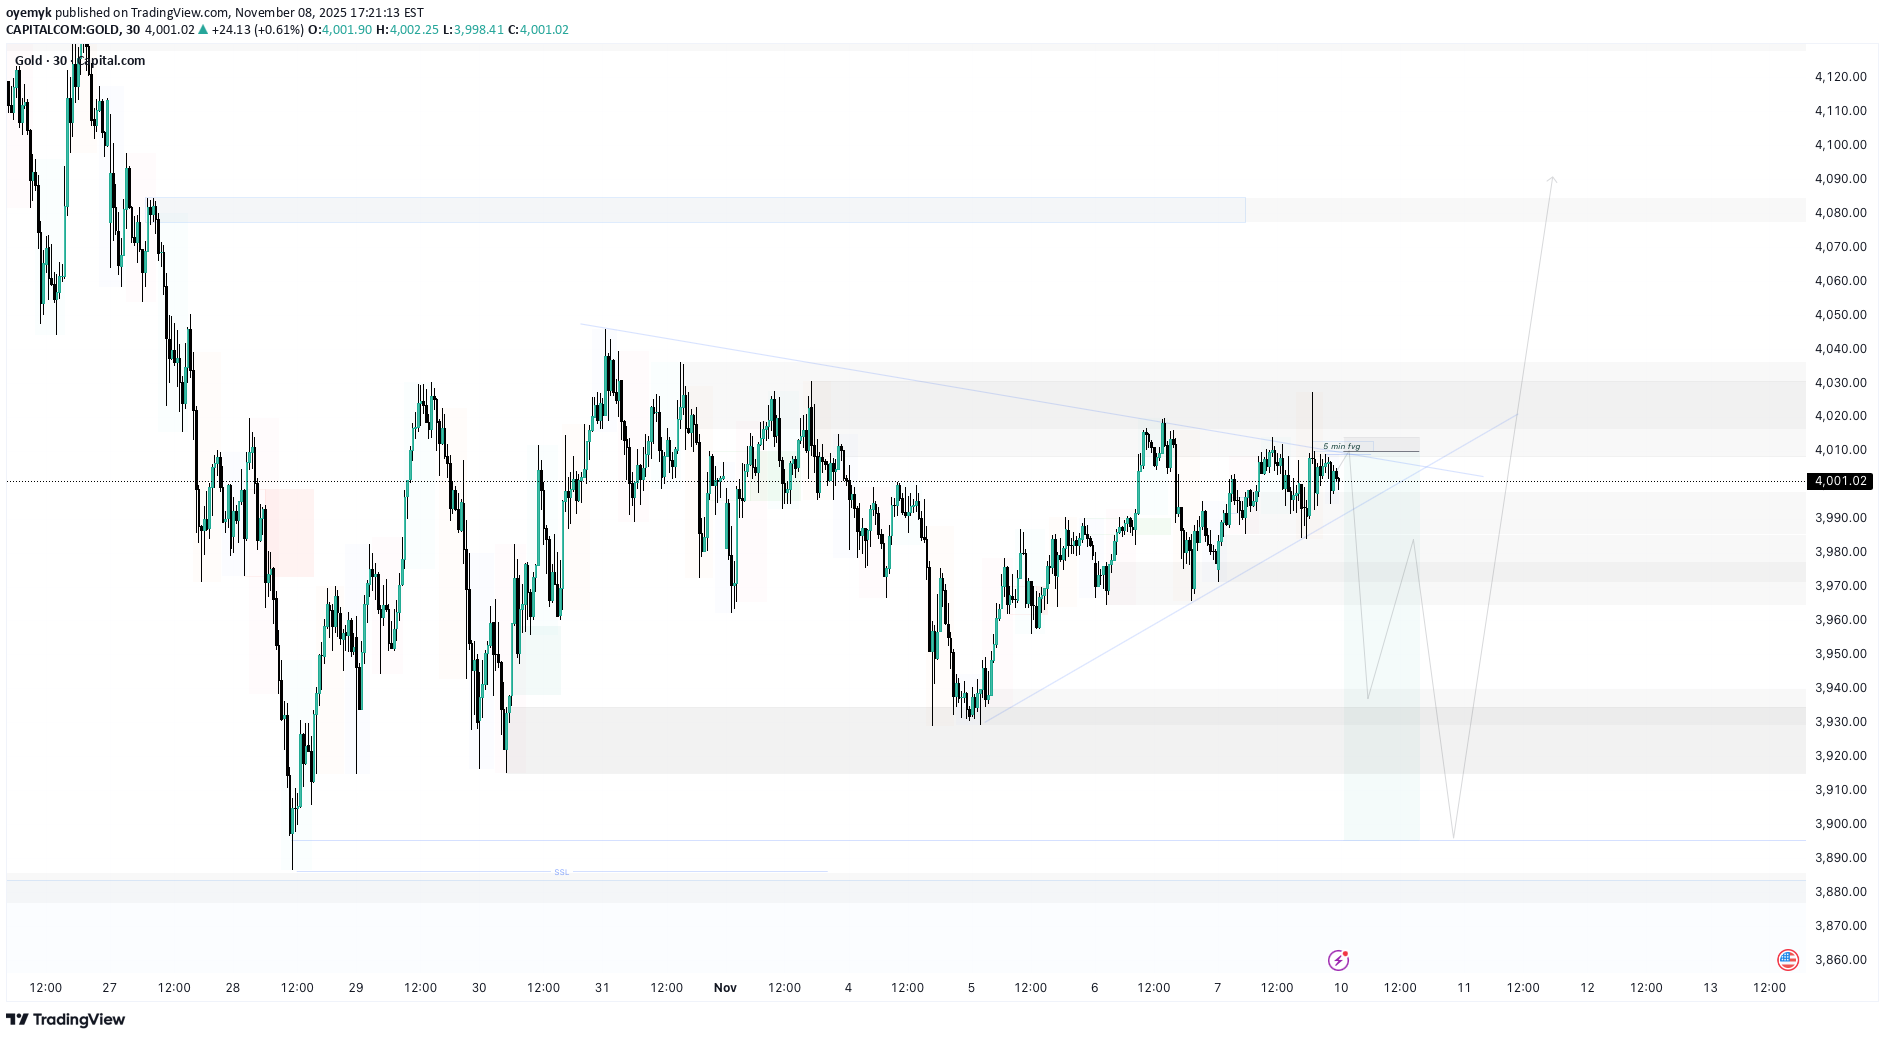
Folks, Although price kept consolidating in a range, it has been nice enough to present an opportunity to identify a breakout direction. On the lower timeframe, price is evidently gathering buy-side liquidity which may be swept before moving downwards. However, bias currently looks bearish short term, but must be ready to adapt to market changes. God with us, it's gonna be a profitable week.
oyemyk
شکست طلایی مثلث متقارن: آیا خیز صعودی بزرگ در راه است؟
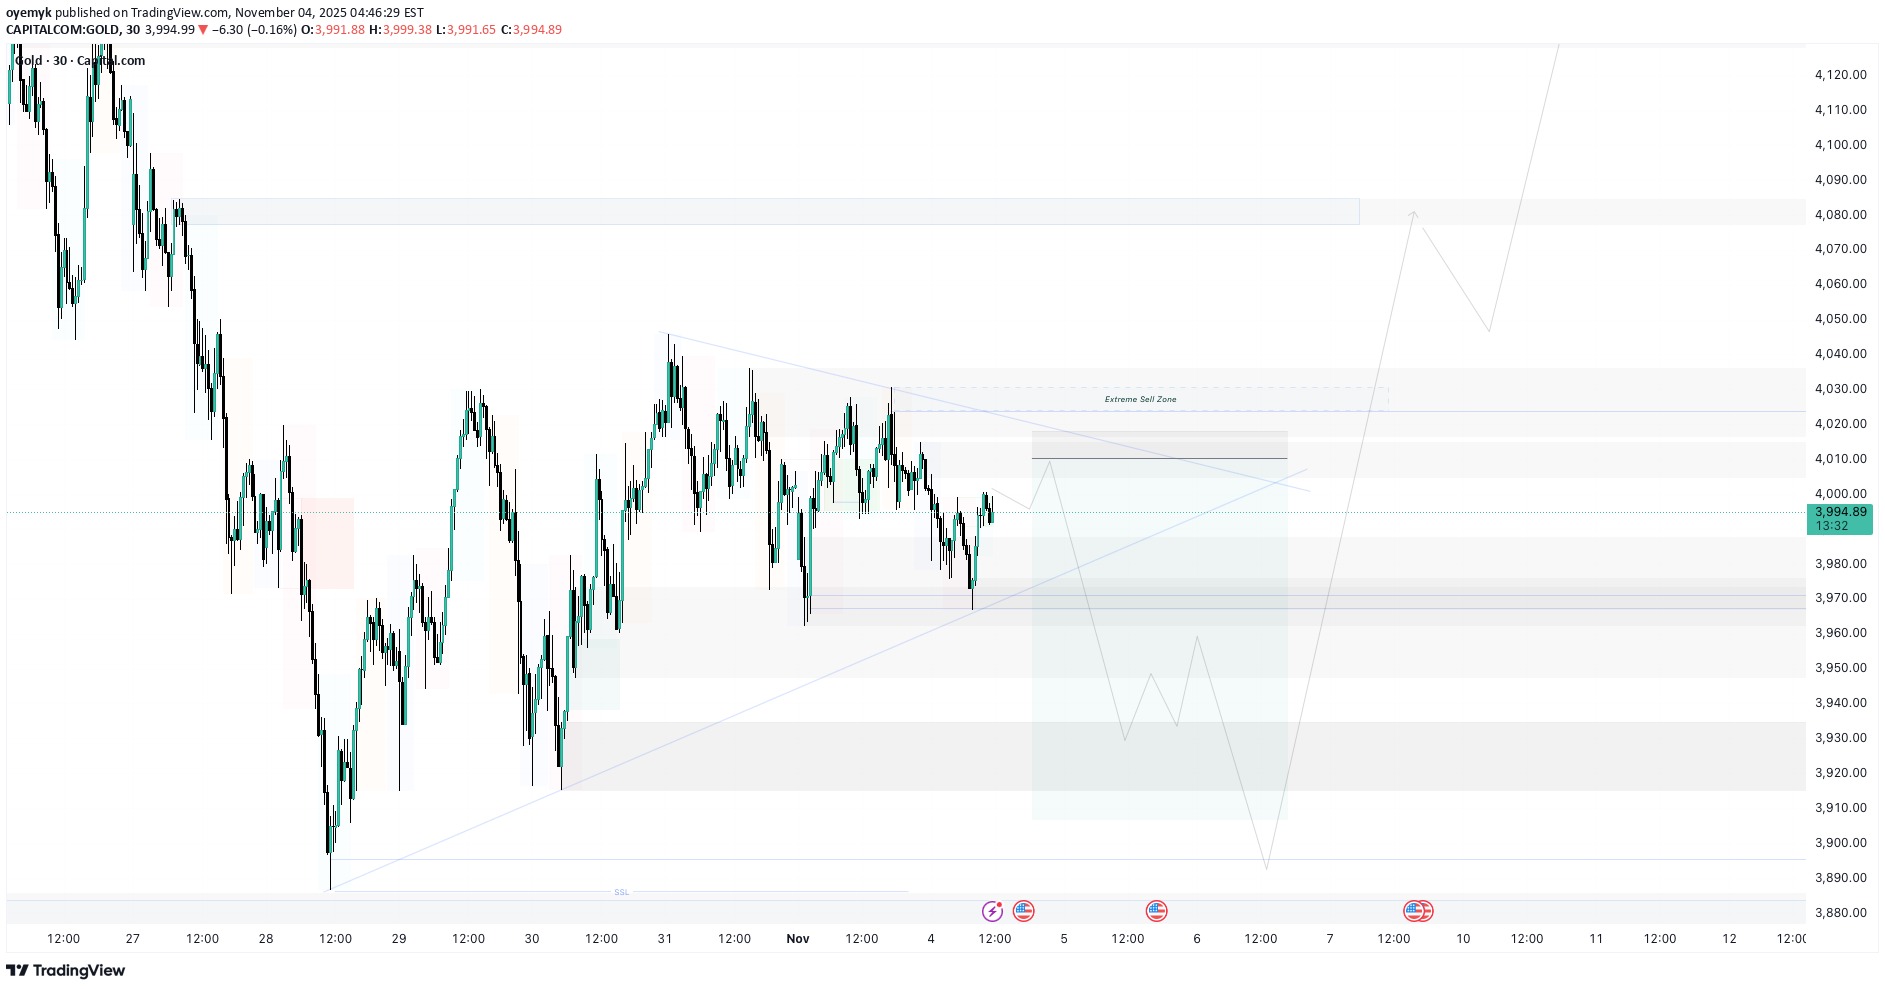
Hello friends, further sideways movement continues as anticipated. However, we might see a bullish weekly candle in the coming week(s) as price intends to push higher but most likely not before clearing the liquidities it has recently left behind to the Demand level, which is the extreme low of this whole move, annotated in the chart. Then, we can anticipate a bullish spool to take the Buy-side liquidities at this week's candle's high. Furthermore, possibilities of spiralling up to the Daily bearish OB is also very open for price to mitigate. Overall, it is important to take note of the direction price breaks out and trade accordingly. Have a profitable week!
oyemyk
تحلیل تکنیکال هفته: آیا بازار در محدوده سقف و کف قیمتی باقی میماند یا صعودی میشود؟
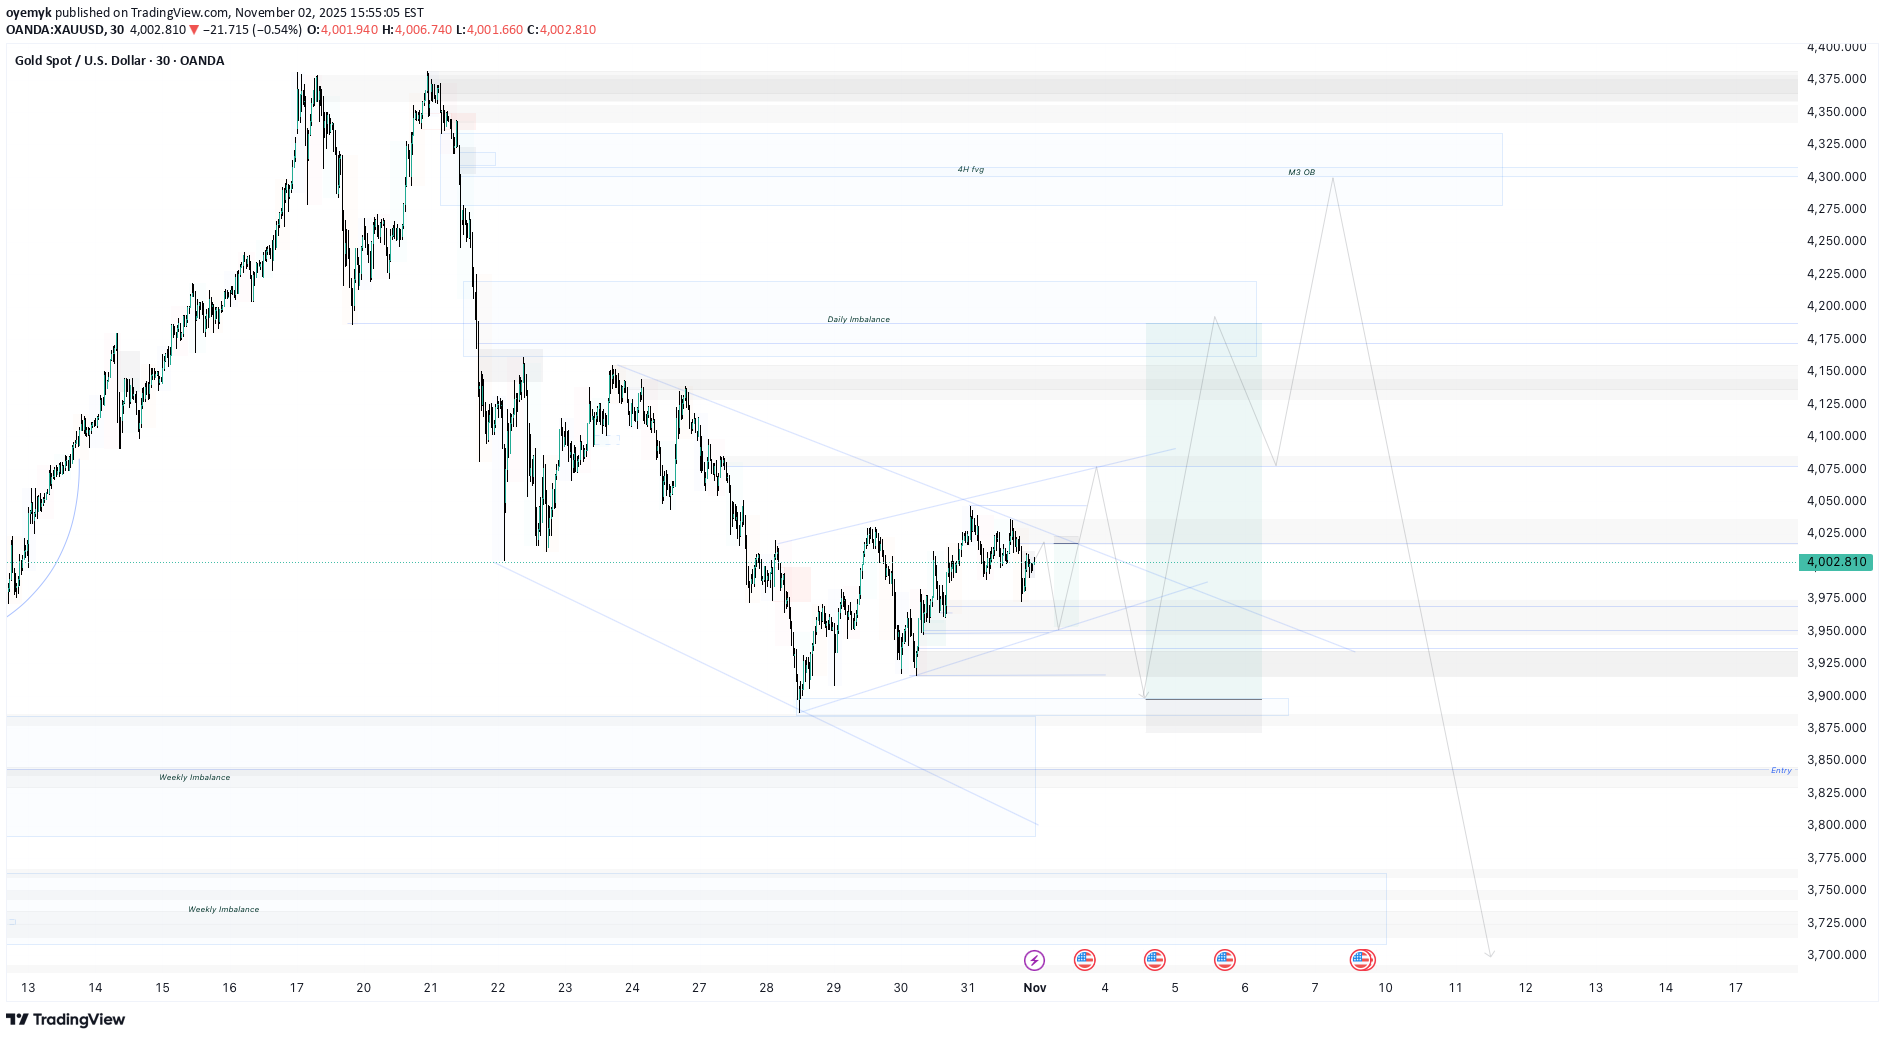
Firstly, it's important to reiterate that last weeks analysis was well on point. Furthermore the targets and price movements analysed on the chart is well thought out. There are opportunities for Bullish and Bearish scenarios, but the price action is leaning more bullish for the week. At least, this week's candle should take last week's high and we might see some downward spiral or a little upward push to the H4 SIBI (Sell-side Imbalance Buy-side Inefficiency) before spooling to the weekly Imbalances left behind in the recently concluded bullish move. It is important to understand that price action might change patterns and adaptation might be necessary. Manage your risks. Protect your capital. Godspeed.
oyemyk
پایان روند صعودی طلا؟ پیشبینی حرکت بعدی بازار با الگوی پرچم خرسی
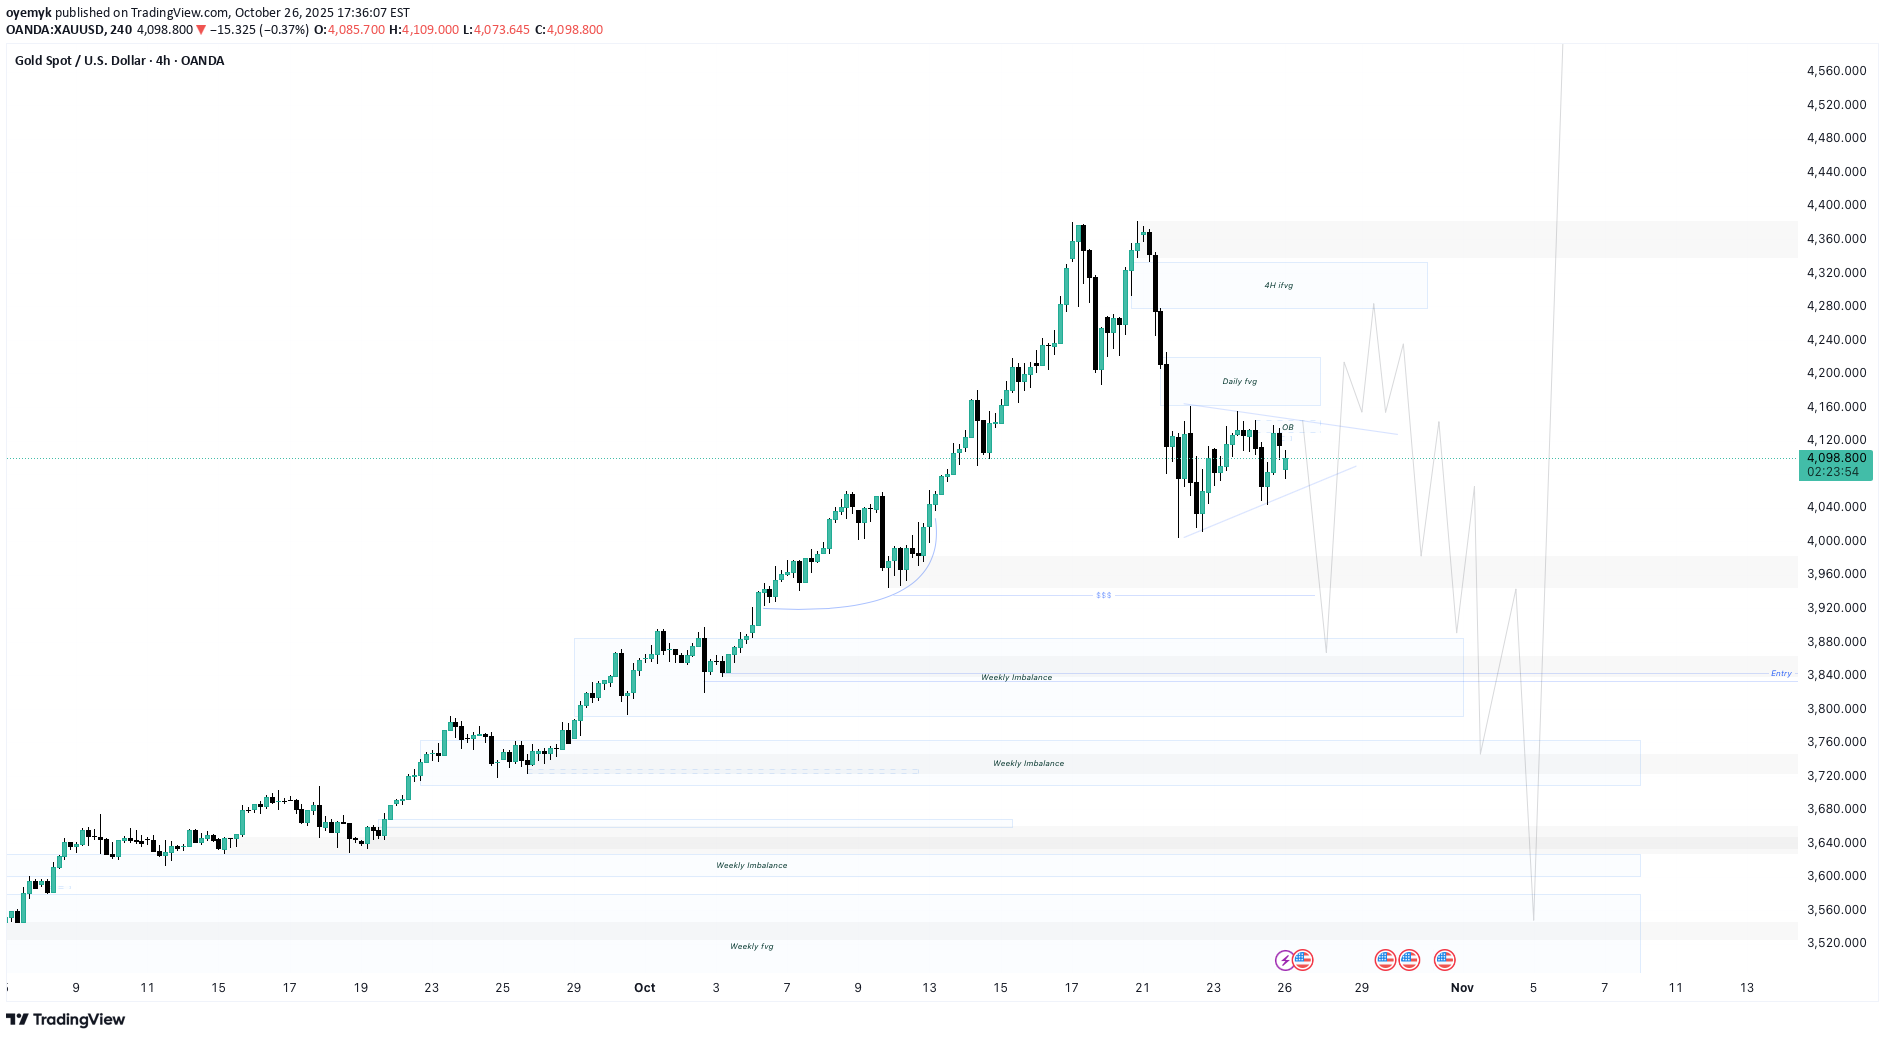
Dear traders, The long awaited pullback has finally arrived. But it is to be traded with caution. As the market leaves traders with questions if the trend has changed short term or it's just another pullback to gather liquidity. The bullish price action we saw on Gold gives a clear answer to this question. Carefully looking at the charts we can observe that gold maintained a faithful and upright uptrend: As it never broke a higher low. And now it has and it is not pushing back up, which is usually, hereby a declaration of the arrivals of the merciless bears. My prediction of the price movement is simply a result of my experience of the market movement. Also, an advise for all. if you want to short in the triangle, ensure to use the Supply zones or Bearish Order Blocks as other PD arrays are being ignored, this is visible in the current price action. Have a fruitful week and don't forget to protect your capital guys!
oyemyk
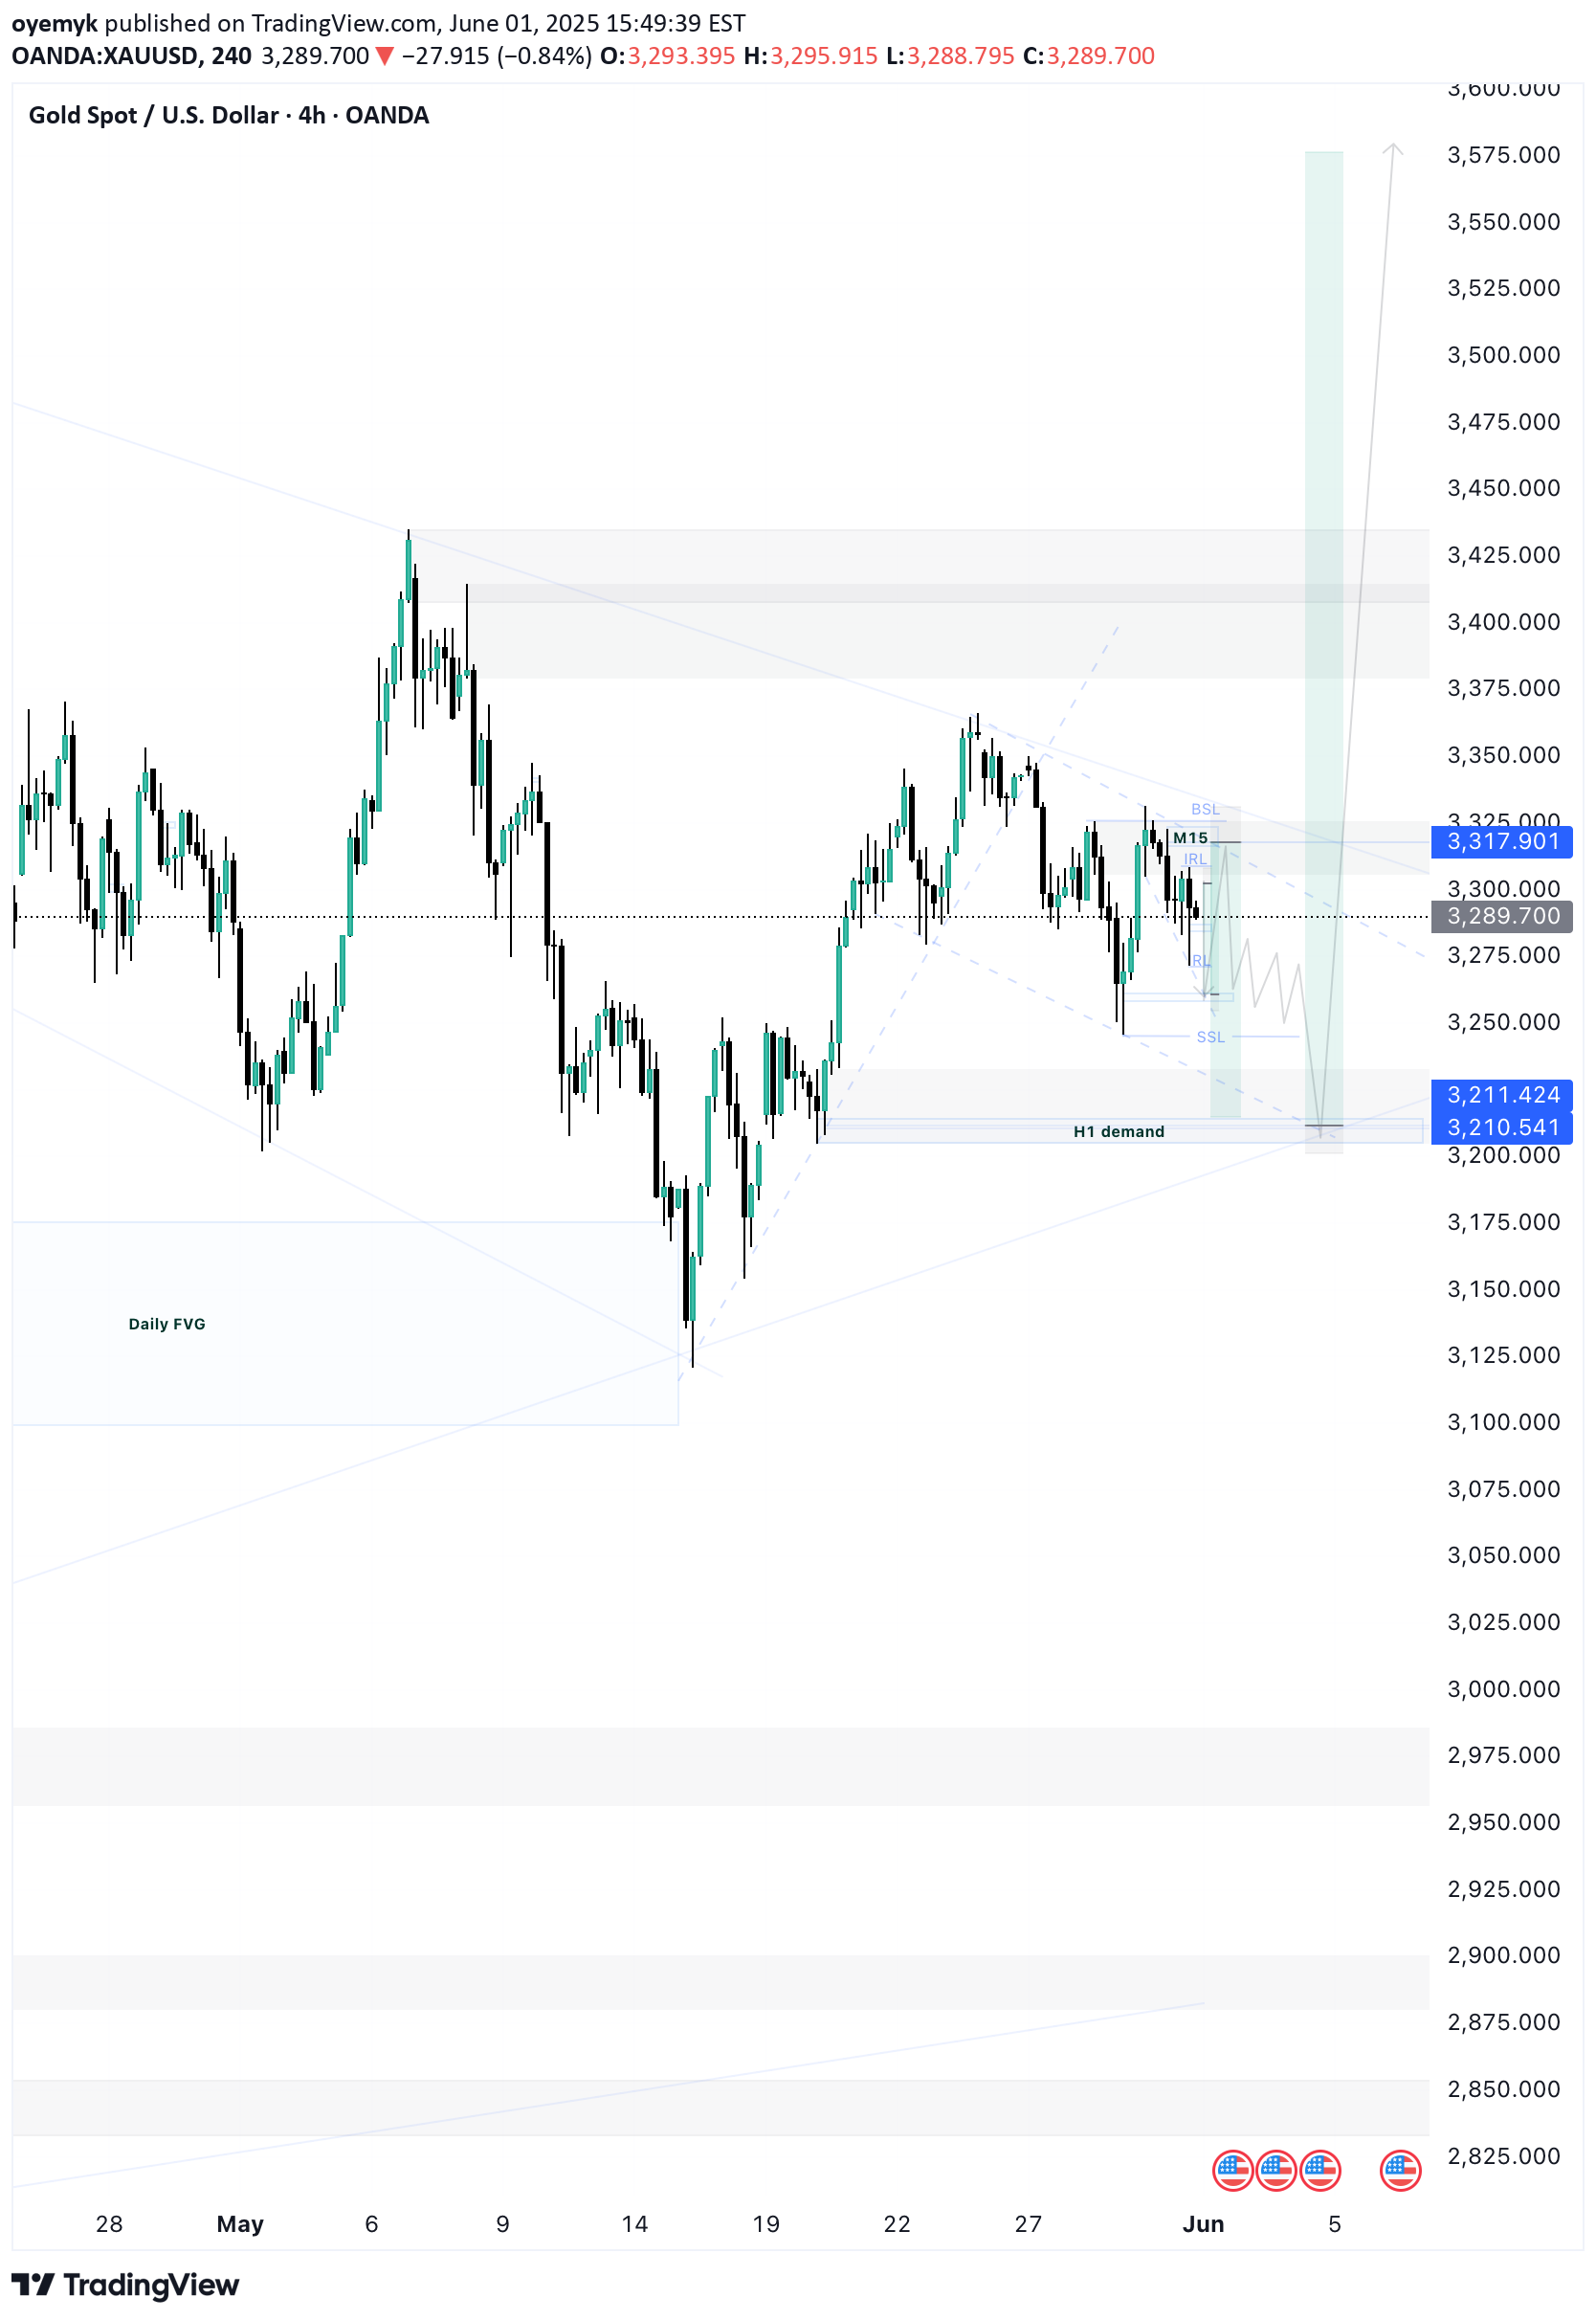
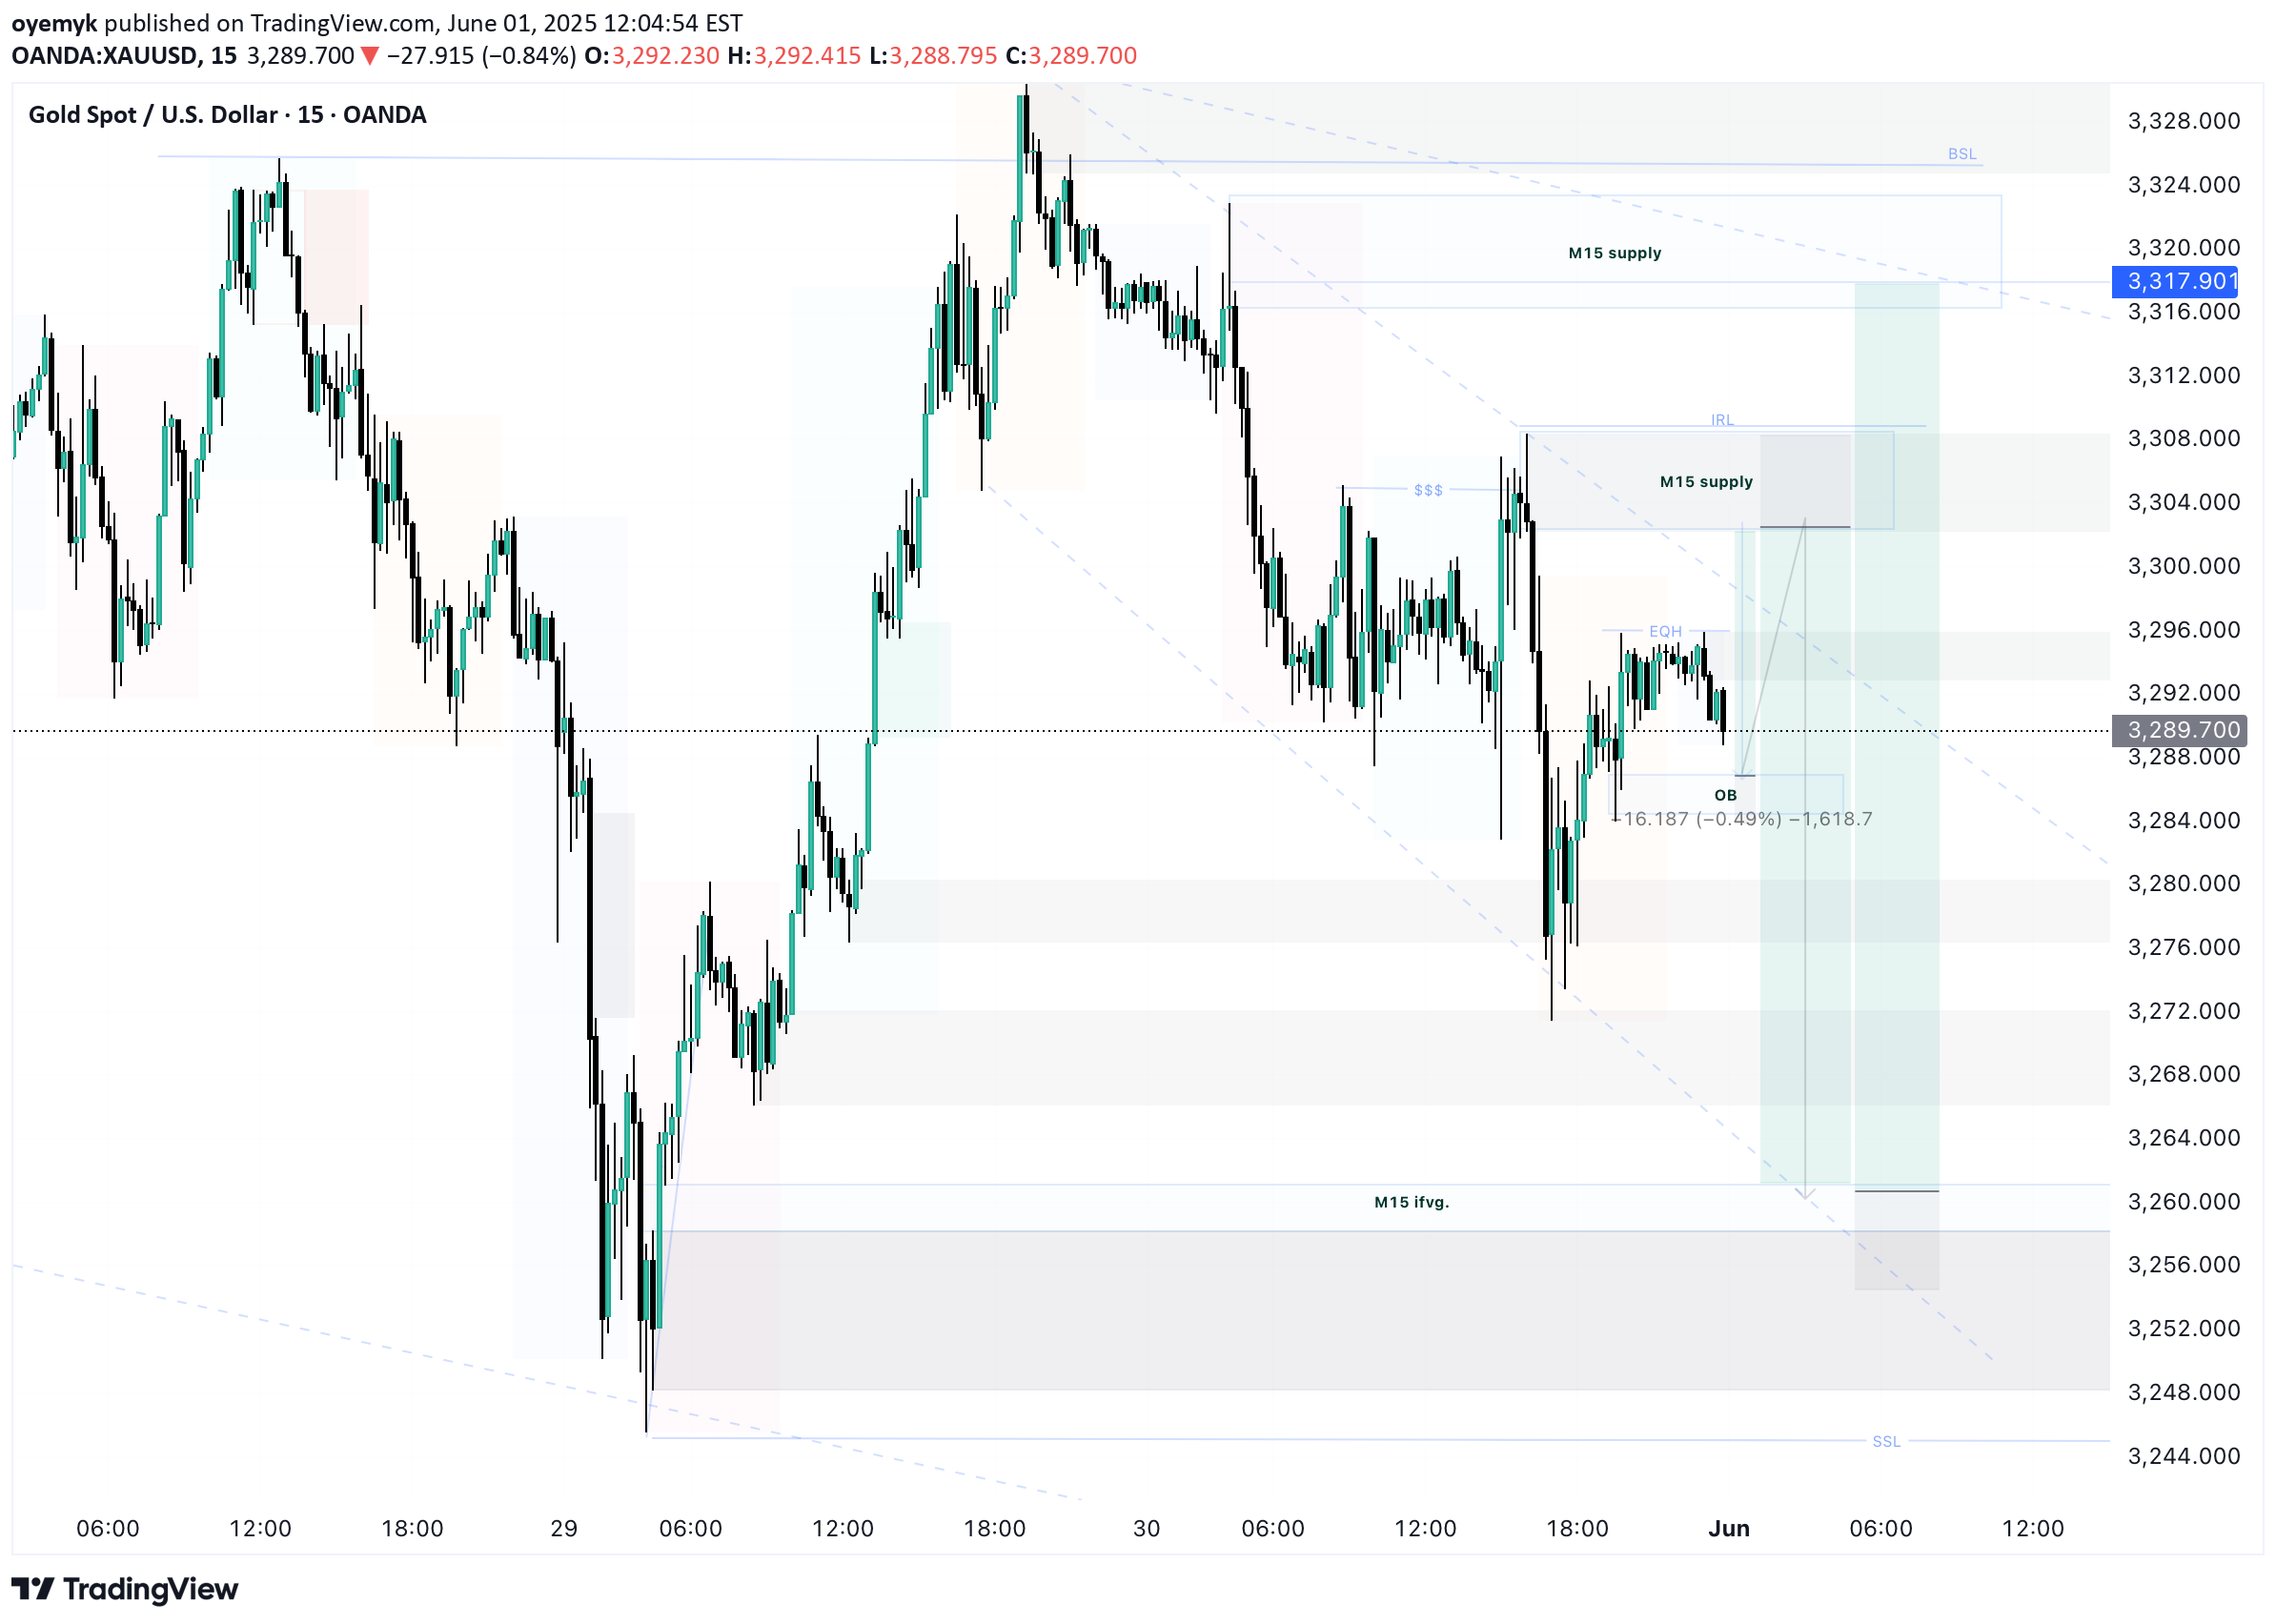
صعود طلا: فرصت خرید جدید پس از توقف دولت آمریکا و الگوی مثلث صعودی!

The recent US government shutdown has provided an upside opportunity for the yellow metal, as the shutdown has left investors with uncertainty. As a result of that we can see opportunities presented and aligning with the chart patterns price has been following. Friday closed with an ascending triangle on the smaller timeframes, up to M15, which is clearly yet to break out. However, it MAY be possible to see a low momentum breakout or no breakout and or a reversal to sweep the Sell-Side liquidity left on Thursday, where buyers should step in for continuation at the H1 Demand. Ensure to manage your risk and protect your psychology and capital. Have a profitable week!
oyemyk
Further Correction in Sight

We can see Price making a reversal after sweeping the Wednesday daily high and shifting structure while leaving an Hourly and 15 minute Imbalance. This is clear indication that price intends to make further correction before continuing to the upside. And the first target would be Wednesday low, before we can experience any significant upside movement. As a result, there are trading opportunities clearly highlighted in the chart below. Have a profitable week guys.
oyemyk
Gold correction still ongoing?

After a strong bullish rally, we can see price retracing and presenting an opportunity to the bulls who initially missed out. But it is important to not get caught in the middle. The key to a continuation trade is choosing the right levels for entry, which can be seen clearly highlighted on the chart. The weekly imbalance below current Price Action. It is also important to not that the RSI is heavily diverging on up to the M30 time frame where the market closed last Friday, which may present an opportunity for the sweep of the liquidities price left behind last week. Trade responsibly and adapt to market conditions. Wishing you a profitable week.
oyemyk
Gold Bullish Continuation
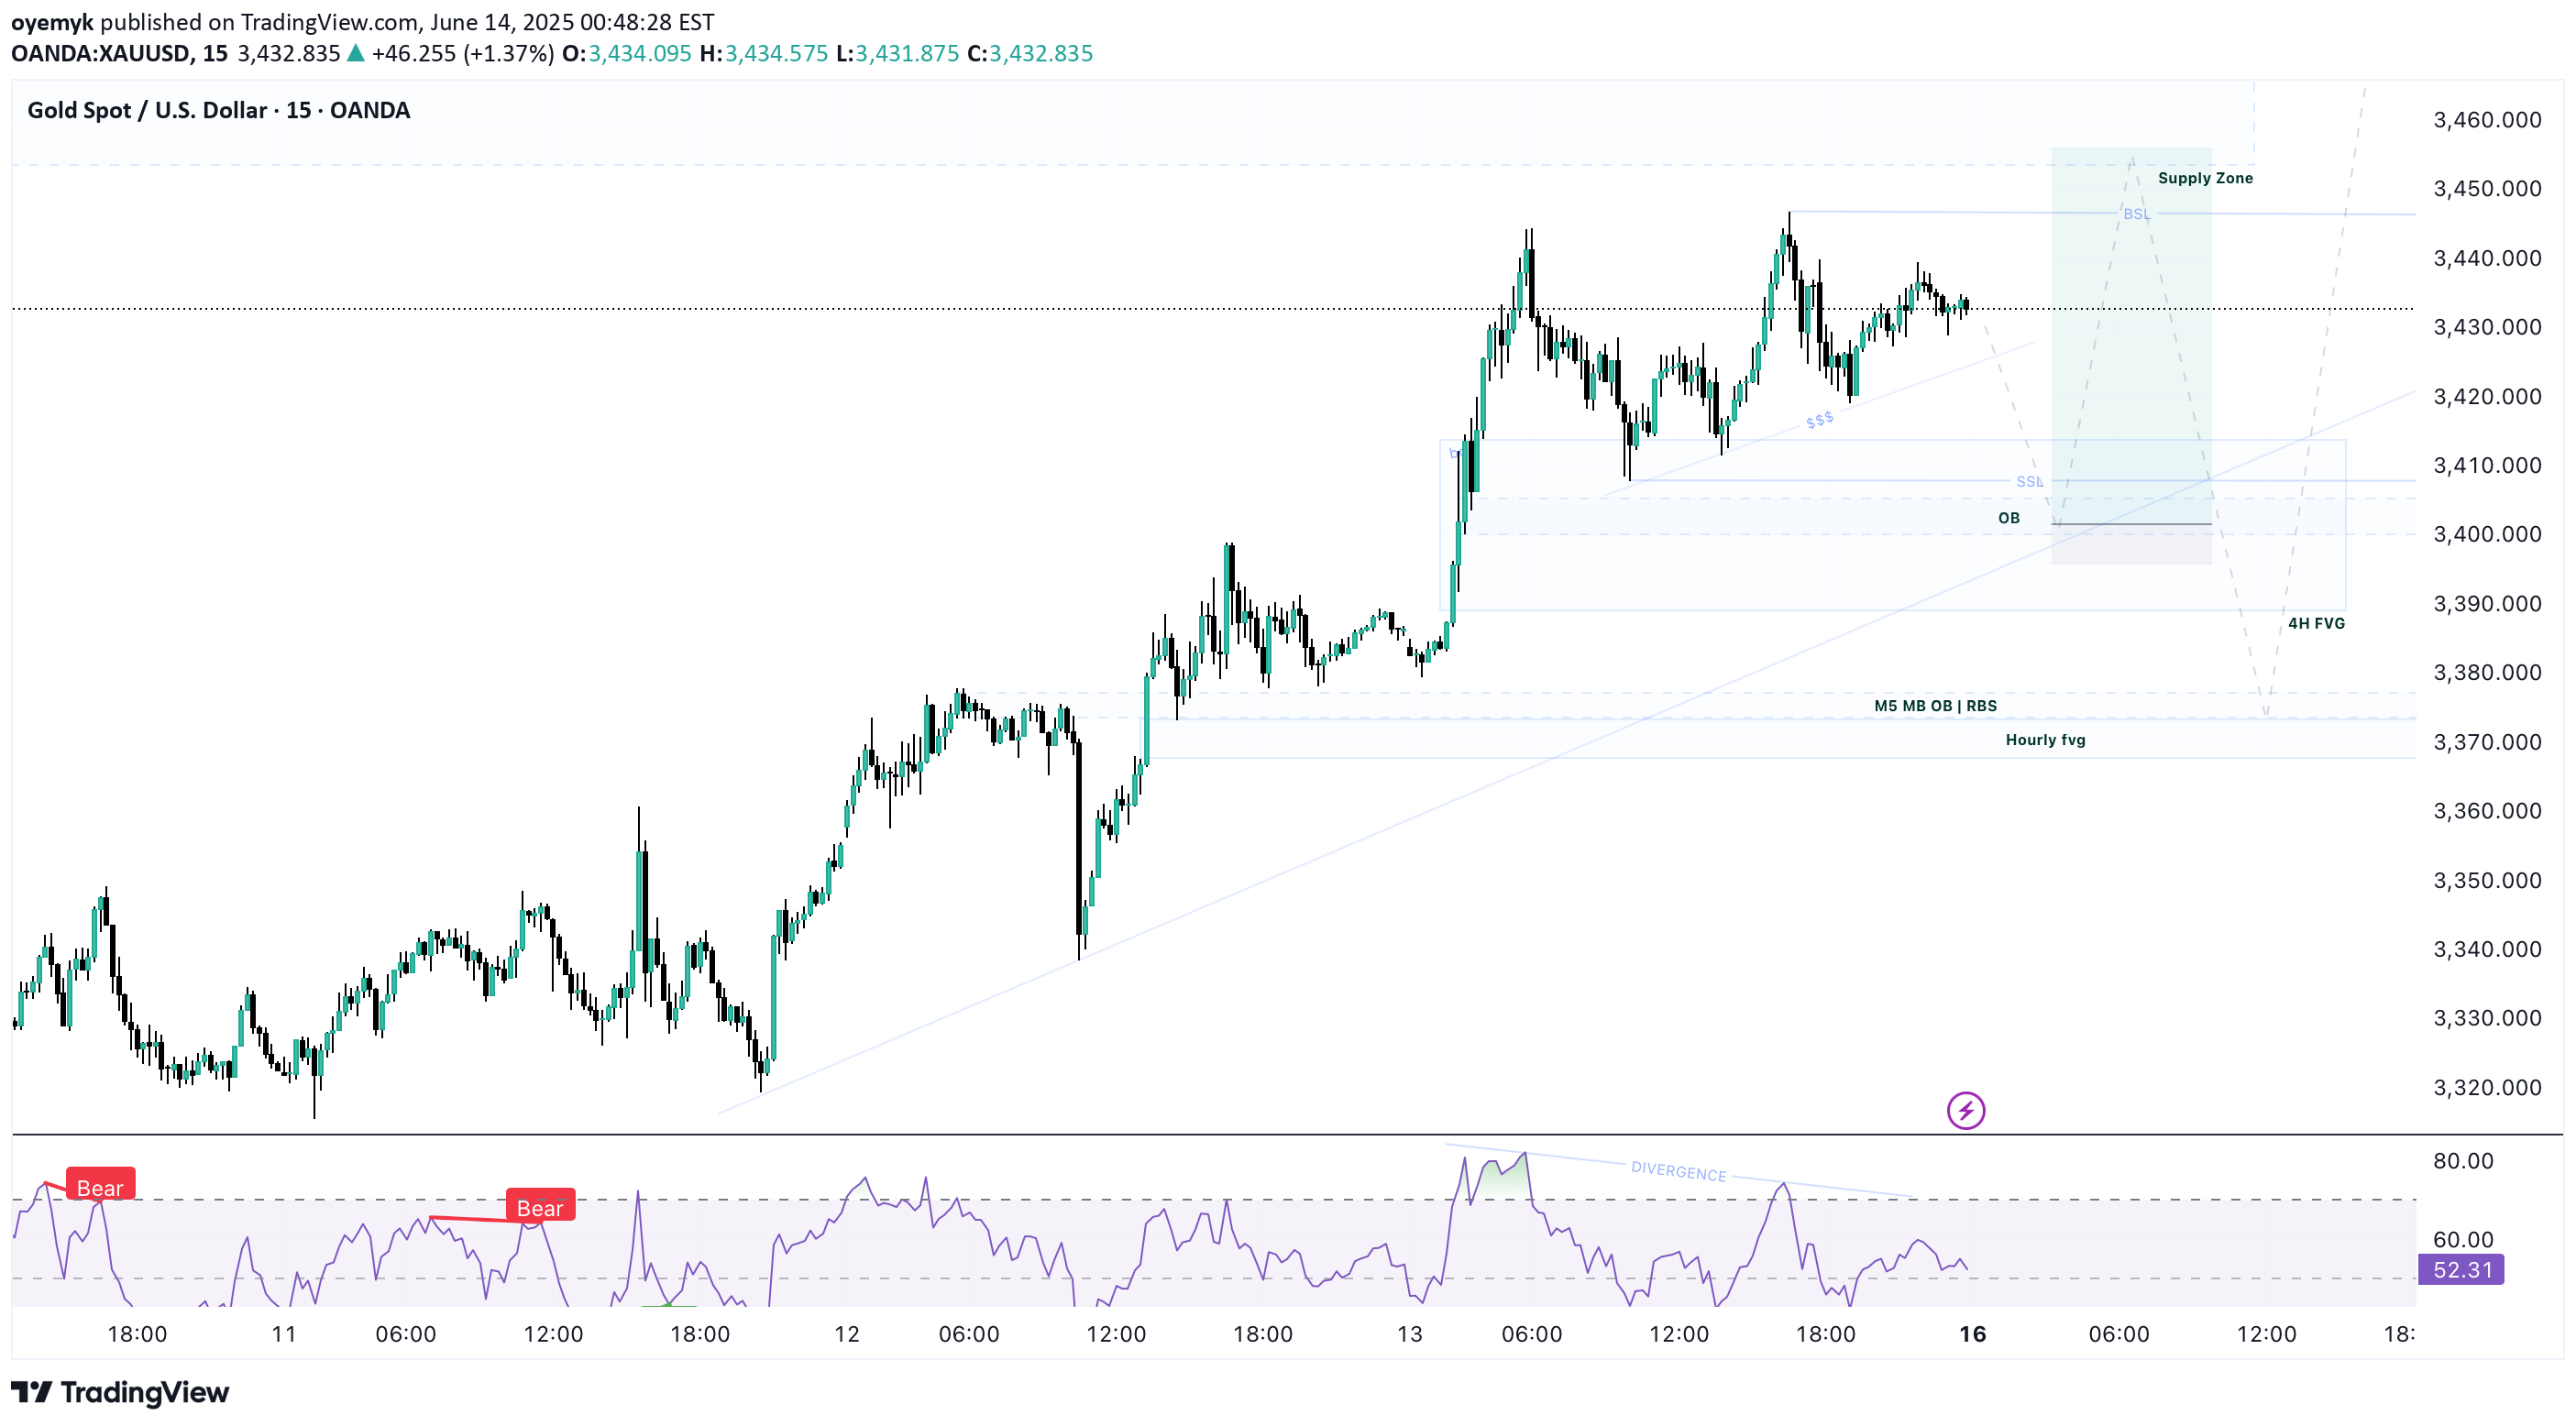
The decision of the daily and weekly candles to close bullish shows a clear indication of further bullish intentions.As visible on the chart, Price has been ranging after mitigating a 4 hour Fair Value Gap and has stayed within the range. However, since it'll eventually have to make a decision, the possibility of a more upside movement appears to be more likely.Moreover, fundamentally, the rising geopolitical tensions further fuels its bullish fire as the demand for the favorite safe-haven asset increases - Gold.Furthermore, technically visible trading opportunities are visible on the chart - However, we may face a pull back at the Supply zone above current price as the 15 minute chart shows bearish divergence on the RSI. As a result, the occurrence of price making a higher high and the RSI making a Lower High heightens the possibility of a pull back to the Mitigation Block/ RBS (Resistance became Support) Zone of 3384-8867. Should price make a further drop below this level, a deeper fall may be anticipated.Always put your equity first, As tough as trading is, the upside is that opportunities always appear in the market. Don't blow your account and emotional balance on a trade or trade idea, another will come, maybe even better. Manage risks. Wish you success.
oyemyk
Symmetrical triangle breakout
The breakout of the currently forming chart pattern could mean the resumption of the bullish trend* sorry friends, I wrote the he tailed analysis and it disappearediso if anyone is interested, write in the comments then I'd take the pain of providing a synopsis.*
oyemyk
Gold sideways at week open
Currently we can see that Gold has just invalidated a 4 hour Imbalance that aligned with several confluences that should have fueled a bullish move. This leads us to believe that the next bullish move might wait a few days, while price creates and takes necessary liquidities, while moving within the descending channel.As a result, I have highlighted urea's of interest and possible tradable levels promising up to 1,100 pips (11,000 points).Higher timeframe analysis will be released soon.
Disclaimer
Any content and materials included in Sahmeto's website and official communication channels are a compilation of personal opinions and analyses and are not binding. They do not constitute any recommendation for buying, selling, entering or exiting the stock market and cryptocurrency market. Also, all news and analyses included in the website and channels are merely republished information from official and unofficial domestic and foreign sources, and it is obvious that users of the said content are responsible for following up and ensuring the authenticity and accuracy of the materials. Therefore, while disclaiming responsibility, it is declared that the responsibility for any decision-making, action, and potential profit and loss in the capital market and cryptocurrency market lies with the trader.