
nothingchangehere
@t_nothingchangehere

What symbols does the trader recommend buying?
Purchase History
پیام های تریدر
Filter
nothingchangehere
تحلیل تکنیکال بیت کوین: آیا سر و شانه نزولی در راه است؟ (استراتژی ورود و خروج)
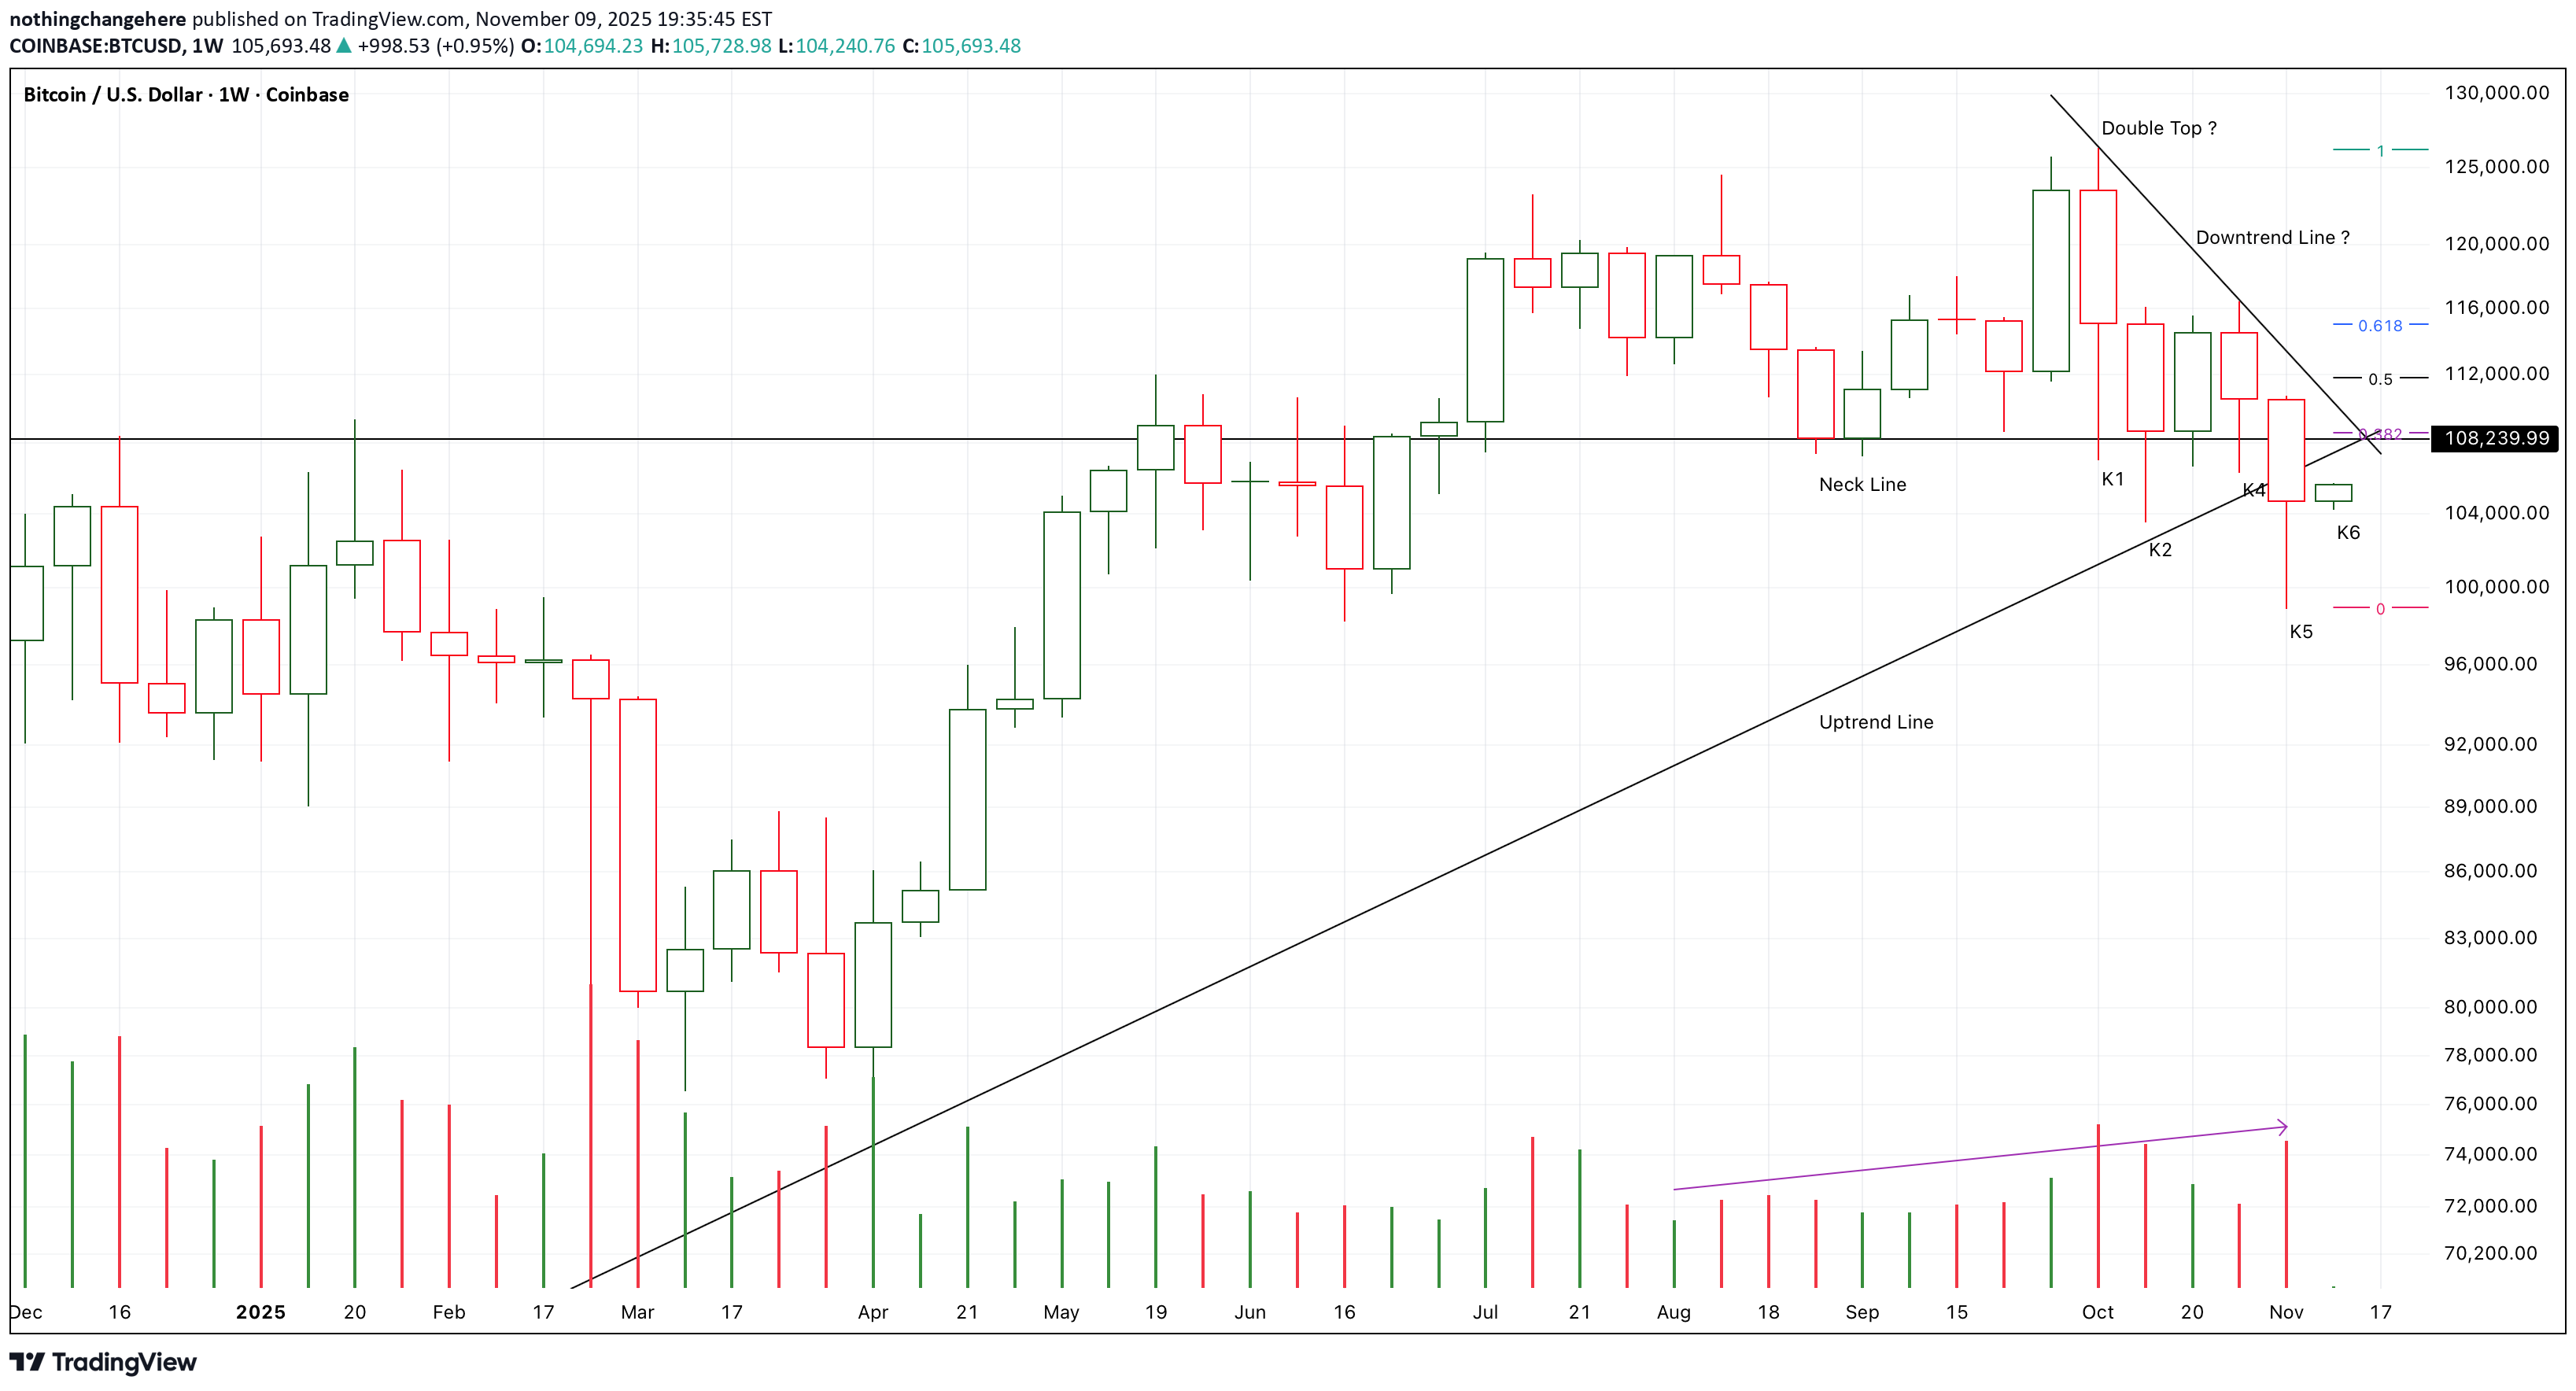
https://www.tradingview.com/x/8MYzCvvv/ K5 close below the neck line of a potential bearish head-shoulder pattern. K5 also close below the long-term uptrend line. If I bought it earlier, I will try to cut off all my long-term positions and even try to short it. If K6 is a green candle like K3 and close upon K5, K5 will be a fake down, And the consolidation around the neck line will keep expanding. Even a bull run will start here. But the possibility is relatively low now. I don’t think the market will keep accelerating to fall down, And ,if the following candles return back to test 0.5fib area, It will be a potential good place to short it there. Short-111.2K/Stop-116.6K/Target-90K
nothingchangehere
Chart Pattern Analysis Of Gold.

https://www.tradingview.com/x/S09EQbdK/ After K1 breaking up the uptrend channel, The market accelerate to get away from the Channel. Both the increasing demands and the expanding candle body verified the strength of the potential bullish wave(3). Perhaps, K4 will keep climbing up to get to the end of wave(3) at about 4.4K area. If I bought it earlier, I will try to decrease my long-term positions there. Of course, The expensive metals are still in the long-term bull market, At least, it will last for one more year.
nothingchangehere
Chart Pattern Analysis Of Bitcoin.

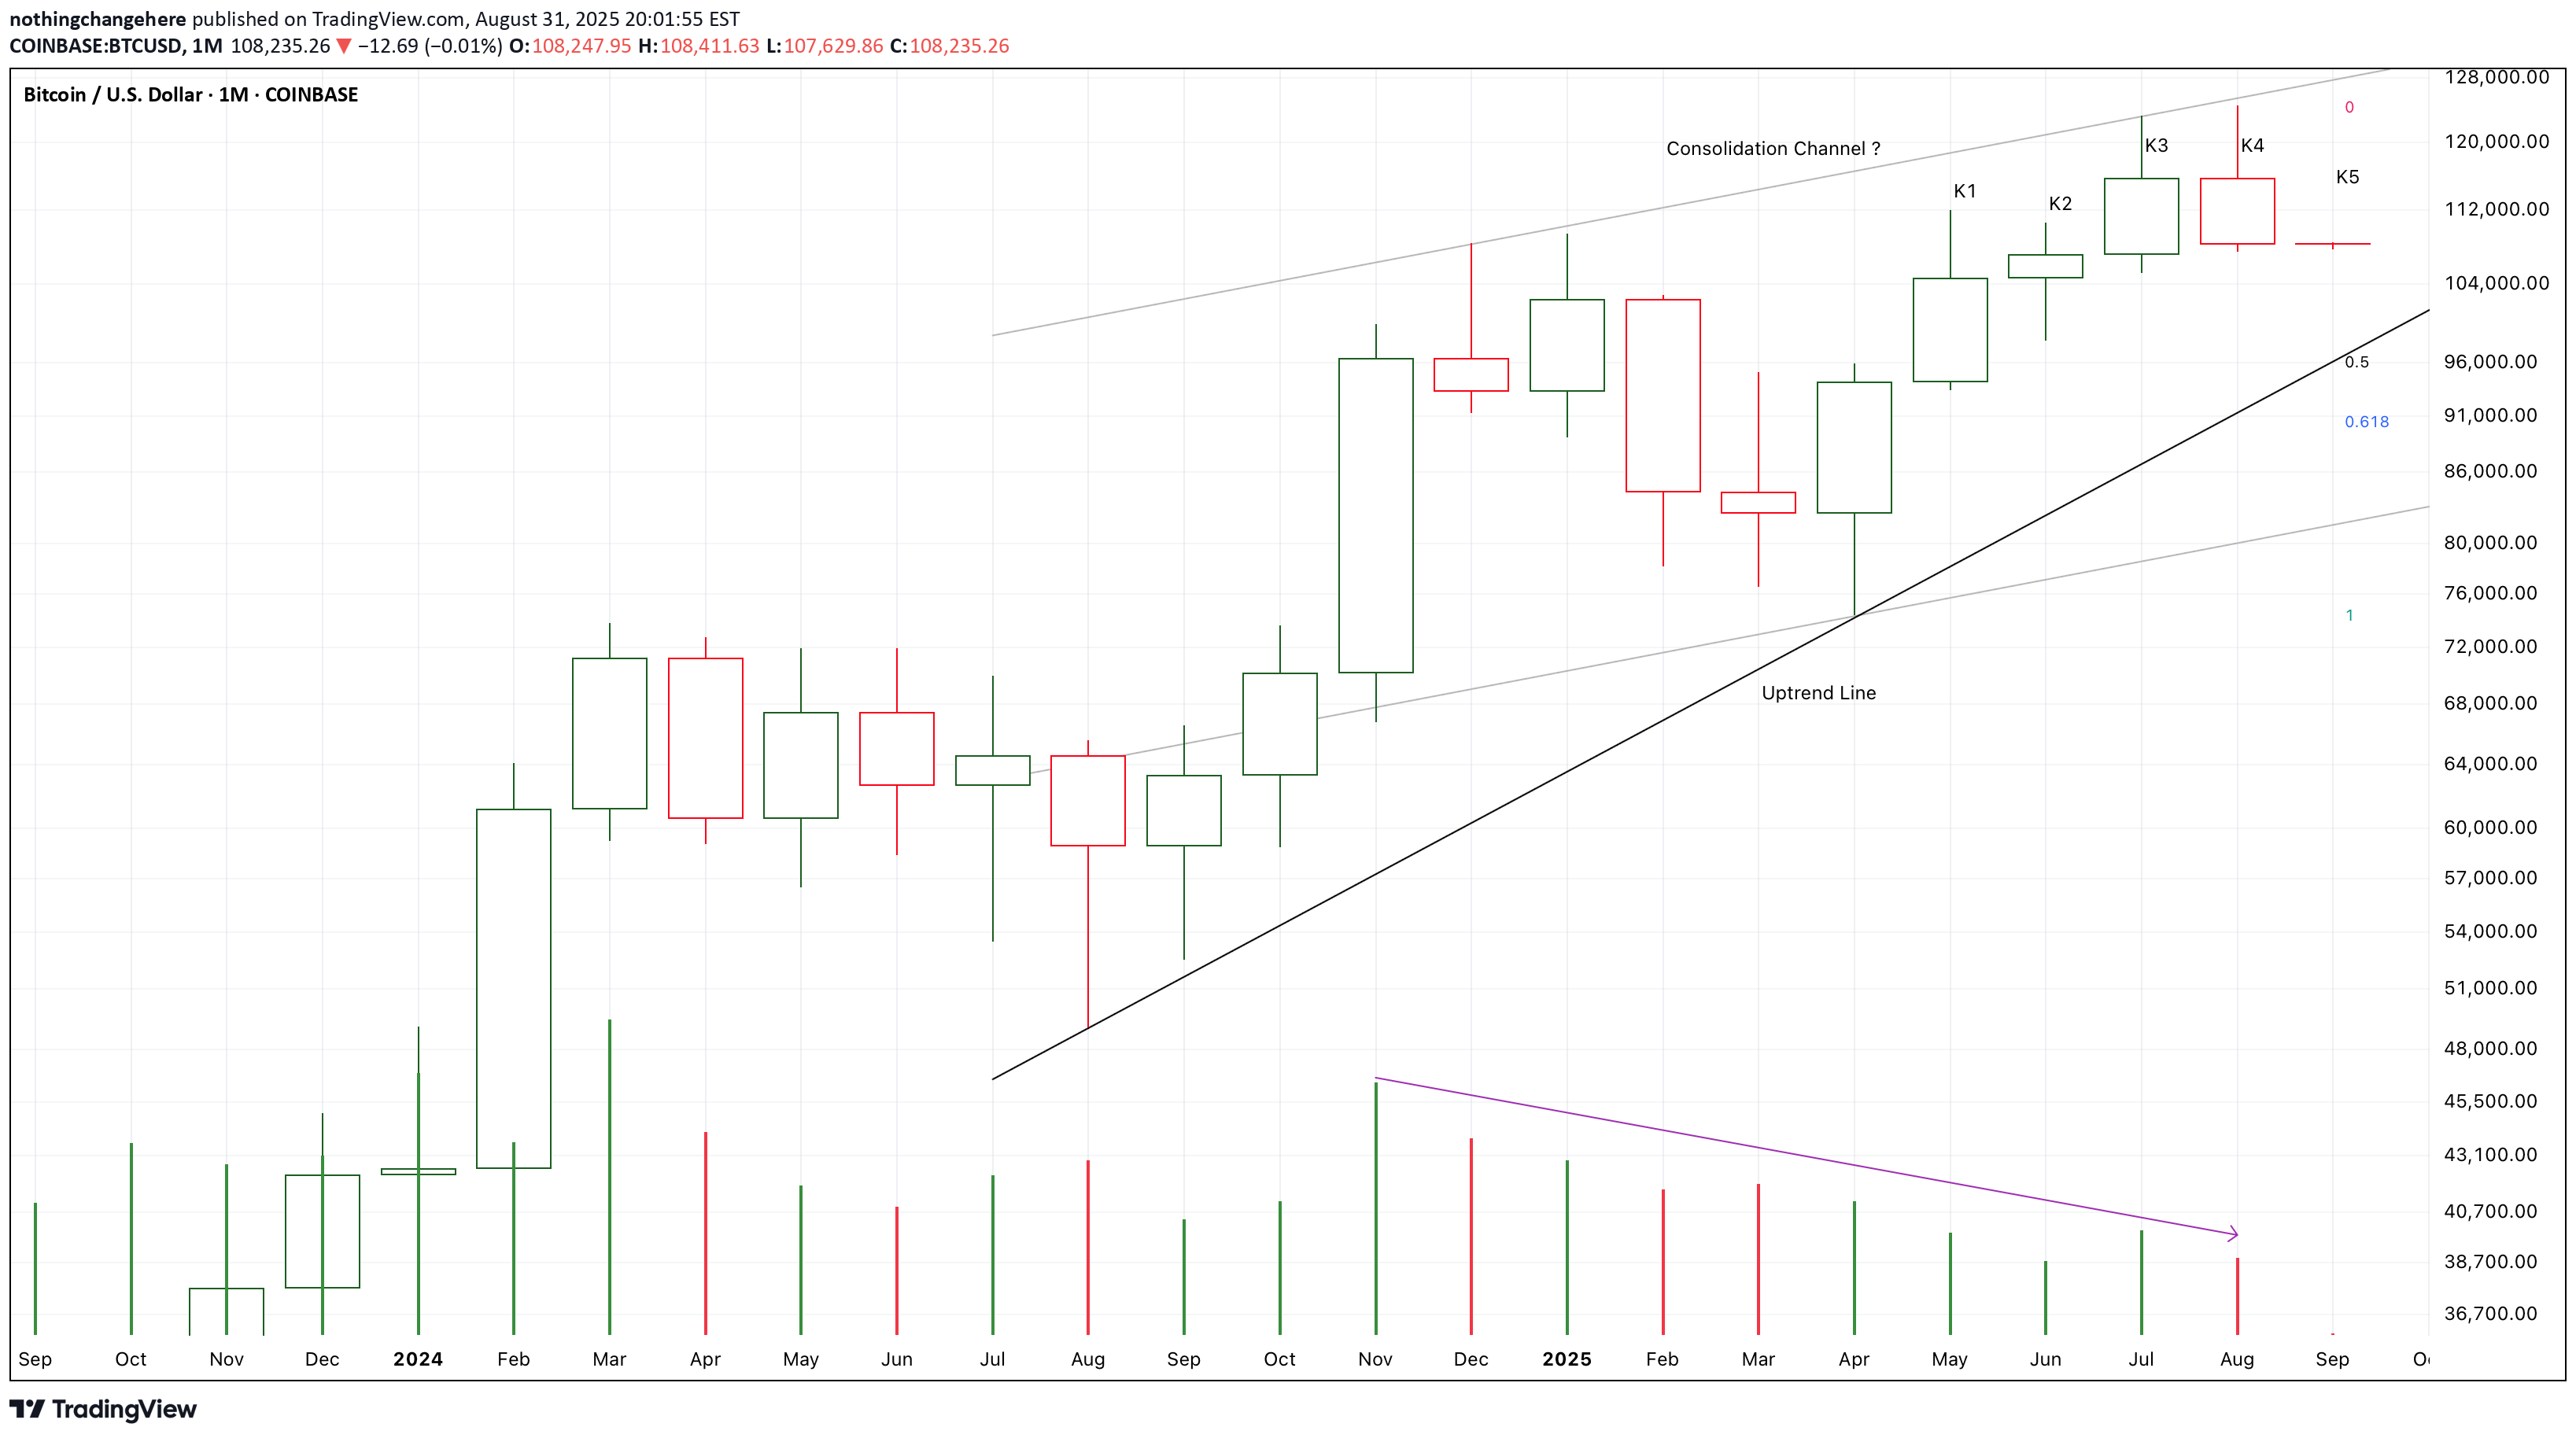
https://www.tradingview.com/x/QVMAFQWD/ After K2 breaking up a bullish triangle pattern, The market failed to accelerate to get away from the support line. From K2 to K6, There is a trend that both the price and demands keep decreasing to a lowest level. It verified a weakness of the market. I am expecting a pull back to retest the support at the following cancels to verify a valid break up of K2. If K6 is a red candle, There will be a bearish evening star pattern and the market will most likely fall to test the support.K2 and K3 is a bearish engulfing pattern, K4 nearly close below K1. K4 also close below the long-term uptrend line. The demands or supply pressure decreasing to a lowest level in a bullish triangle pattern or a potential bearish head-shoulder pattern. If K5 still close below the uptrend line, The market will choose to break down, And, a bear run may start here. On the other hand, If K5 close upon K4, Another bull run may start here.After K2 break up the bullish uptrend triangle pattern, Another bull run start here. The market will touch 140K area. It is not safe to short it anymore. So, I will cut off at least half of my long positions at MSTZ. If K3 consolidate around the resistance, It will be a good place to buy it here.
nothingchangehere
Chart Pattern Analysis Of Bitcoin.
https://www.tradingview.com/x/jnonE733/ After K3 break up the previous higher high, K4 return back immediately. It seems that K3 was a potential fake up candle, But it must be verified by K5. I am expecting a doji candle of K5 close at low price area to terminate the three years bull market here. If I bought it earlier, I will try to cut off most of my long-term positions and even try to buy MSTZ to short it. On the other hand, If K5 close at high price, The following candles will test 128K area or even break up it. Long-88K/Target-98K/Stop-87K Short-115K/Target-89K/Stop-116KFrom K1 to K3, It is a strong three soldiers advancing pattern under increasing supply pressure. It break down the support. But the overall supply pressure keeps at low level, Perhaps it is not a valid break down. It must be verified by K4. If K4 still close below the support, The risk will increase. The long-term uptrend will be terminated here. If K4 close upon K3, It is still possible that the following candles will return back to test 123K area. Long-88K/Target-98K/Stop-87K Short-115K/Target-89K/Stop-116K
nothingchangehere
Chart Pattern Analysis Of Bitcoin.
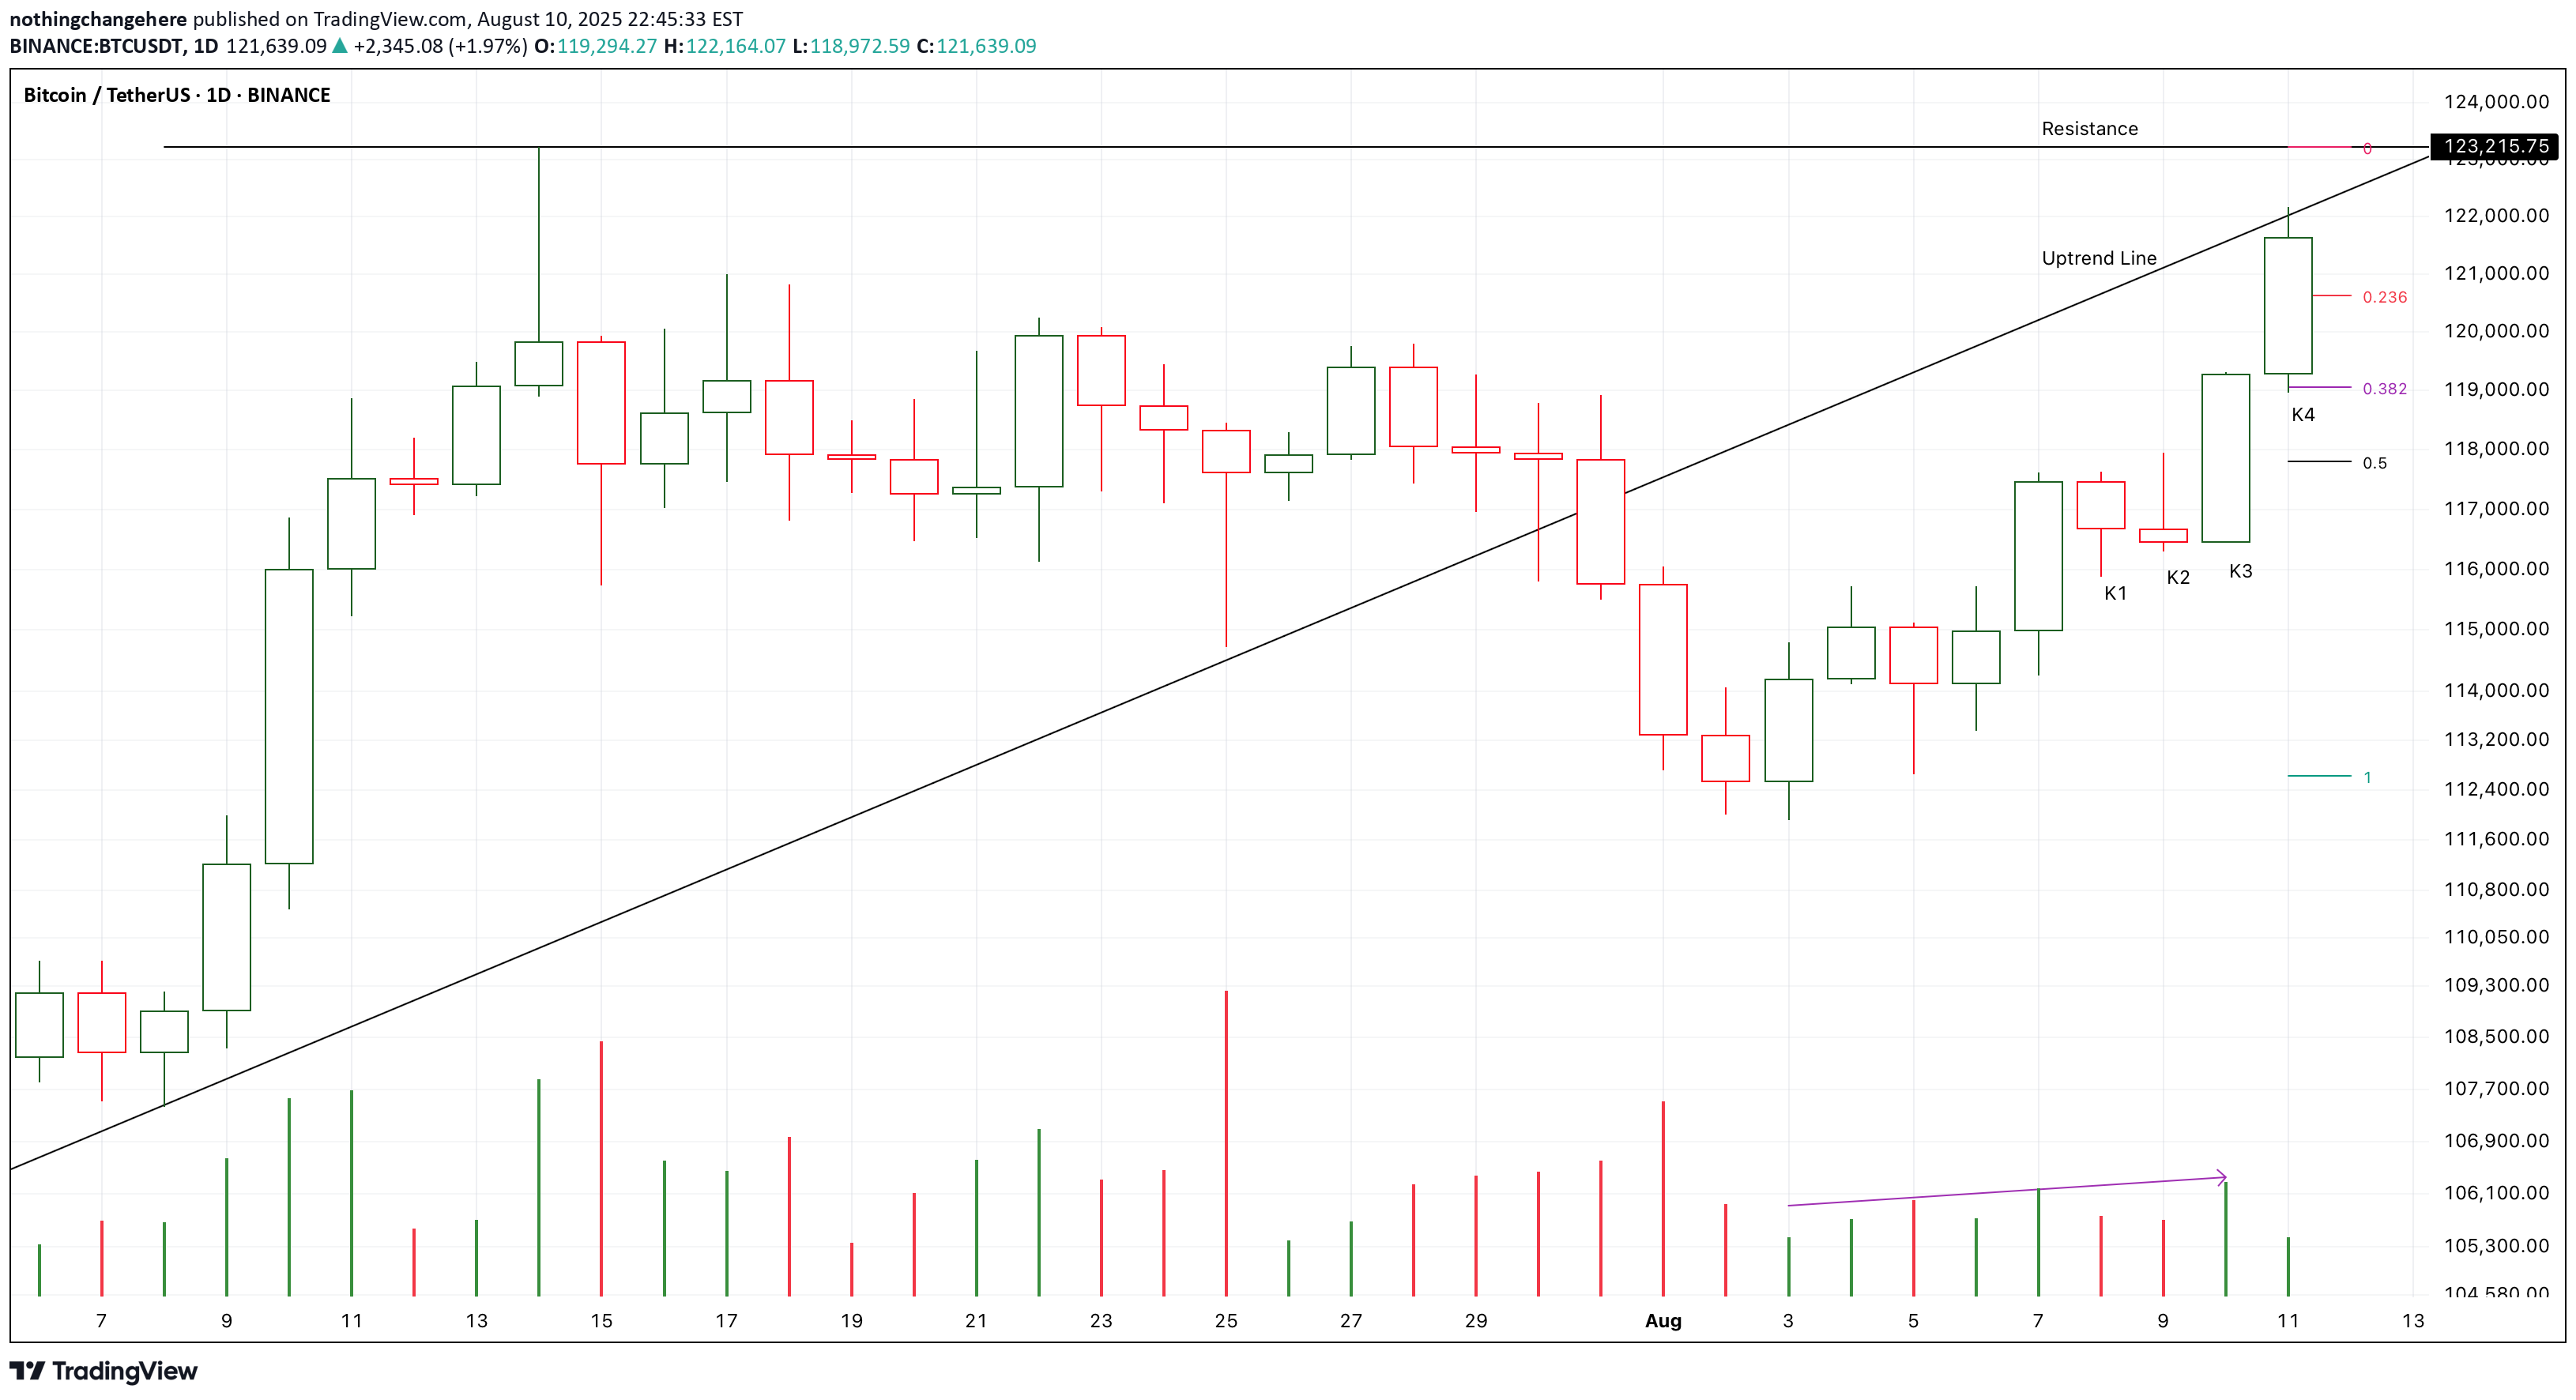
https://www.tradingview.com/x/CSqZwlpO/ K3 and K4 verified an accelerating motive wave of a short-term uptrend. I am leaving from 119K to 123K. I am expecting a consolidation around the resistance. If the following candles fall to test 0.5fib area, I will try to buy it there. Long-118K/Target-125K/Stop-116.5K
nothingchangehere
Chart Pattern Analysis Of Bitcoin

https://www.tradingview.com/x/tPIOYsKb/ From K2 to K4, It is a strong bullish three soldiers advancing pattern with increasing demands. It is likely that K4 will close upon the high price area. And, it is likely to be a valid break up here. The potential target is about 127-130K after 3 weeks. On the other hand, Compared to the nearest motive move, The demands keeps at the lowest level. It is an early signal of weakness. Perhaps this is a final motive wave. I will try to get out of the market and even try to short it if the following candles move to the upper limit of the uptrend channel. Also, I am expecting a doji candle of K5 to test the neck line. It is a potential good place to buy it there. Long-115518/Stop-111K/Target-127K Long-114388/Stop-111K/Target-134KFrom K1to K3, It is a strong bullish three soldiers stalled pattern with increasing demands. It is likely that K4 will close upon the high price area. And, it is likely to be a valid break up and an accelerate motive wave here. The potential target of the double bottom consolidation pattern at about 121-128K after 3 weeks. At the same time, The supply pressure sharply increased at K2, It is an early signal of weakness. Perhaps a small scale running flat pattern will consolidate around the upper limit of the channel, And then, the market will keep accelerating. I will try to get out of the market and even try to short it if the following candles move to 125K area. Long-115888/Stop-111K/Target-127K
nothingchangehere
Chart Pattern Analysis Of ETH.

https://www.tradingview.com/x/SPumSWUO/K2 verified a potential fake down of K1.And,the supply pressure near the neck line keep decreasing.It seems that K6 will choose to break up or fall down.If the following candles close upon the neck line,I will try to buy in.If the following candles close below K3,The risk will sharply increase.Long-2388/Stop-2345/Target-2800Long-2420/Stop-2345/Target-2800Long-2488/Stop-2345/Target-2800
nothingchangehere
Chart Pattern Analysis Of Bitcoin.

https://www.tradingview.com/x/c1C59CsR/K1 and K2 verified a potential strong support,If the following candles K5 or K6 close upon the downtrend line like K2,Another bull run will keep climbing up.It will be a good place to buy it around the downtrend line.If the following candles consolidate around the resistance to verify the bullish momentum,It will also a good place to buy it around the resistance.On the other hand,If K5 or K6 close below K4 to verify the resistance,The market will fall to test the support for more times,I will try to buy it at about 100K area.Long-101618/Stop-100618/Target-120KLong-103188/Stop-102188/Target-120KK1 nearly close upon the resistance,It verified the bullish momentum.It seems that the following candles will finally break up it.I will try to find opportunities to buy in.On the other hand,If K2 or the following candles verified the effectiveness of the resistance,It is still possible that the market will fall to test 100K area again.Long-106888/Stop-105888/Target-120KLong-108988/Stop-107988/Target-112KK1 and K2 is a bearish harami pattern,It seems that a short-term consolidation will start here if K3 is still a weak candle to verify the expectation.If the following candles successfully retest the neck line,I will try to find opportunities to buy in.Long-107318/Stop-106318/Target-120K
nothingchangehere
Chart Pattern Analysis Of Bitcoin

https://www.tradingview.com/x/ddq4ZlDH/From K1 to K3,It is a three soldiers advancing pattern,It close below the uptrend line and the neck line of a potential double top pattern.It seems that a short-term bear run will fall to test 102K area.I will try to buy it there if the following candles couldn’t close below 0.618fib line.On the other hand,If K4 return back upon the neck line immediately,K3 will be a fake down and the following candles will keep climbing up to test 112K area.Short-106318/Stop-107318/Target-102188K6 is a weak candle under low volume,And also,It failed to close upon the resistance to verify the bullish momentum of K5.It seems that a larger scale consolidation is here.If K7 fall to test 0.382fib line,I will try to buy it at about 98K area.On the other hand, If K7 start with a bull gap and accelerate to break up the resistance,The strong bull market is still possibly to come back.K5 close upon the resistance under sharply increased volume,K6 verified that K5 was possibly a fake up candle.If K7 start with a bear gap and accelerate to break down K4,The market will verify the effectiveness of the resistance.And a short-term consolidation or a price correction will start here.The potential support at about 91-96K area.I will try to buy it there.On the other hand, K6 failed to close below K5,If K7 close upon K6,That will verify a valid break up of K5.And another bull run will start here.K2 to K4 verified a potential fake down of K0,The support at 0.382-0.5fib area is really strong.If K5 close upon K0,Another bull run will start here to test 110K area.On the other hand,If K5 close below K3,It is likely that the nearest short-term downtrend will expand down to accelerate to test 98K area.Short-110.5K/Stop-111.5K/Target-98KLong-104.1K/Stop-103.1K/Target-109.5KK1 break down the neck line,But K2 failed to accelerate to verify the strong bullish momentum.So, it is obviously that the short-term bear trend couldn’t lasts for a long time and fall deep.If K2 return back upon the neck line,A sharp rebound or another bull run will start here.On the other hand,K1 is also a first test to the potential support,If there are more tests to verify the strength of the line,Another bull run will start there.I will try to buy it then.Short-104108/Stop-105108/Target-98KLong-97588/Stop-96588/Target-120K
nothingchangehere
Chart Pattern Analysis Of Bitcoin

https://www.tradingview.com/x/S3xhWLRG/K3 is a weak break down,It failed to close below K2.It seems that K4 will test the uptrend line to verify K3 was a fake down or not.If K4 close upon K3,Another bull run will start here to test 112K area.If K4 or K5 are doji candles around the support,It is likely that a sharp price correction will start here to test 102K area.K5 and K6 are two bullish candles,It seems that K6 will close upon or near the resistance.The supply pressure keeps decreasing.All of this are good signals for the bull market.On the other hand,The candle body of K6 is still too small,It couldn’t verify the strong bullish momentum,K7 must accelerate to break up to verify the strong market,If not,I will expecte a 3-4 weeks consolidation around the resisitance and then break up to test 120K area.I don’t think it is a good idea to short it here with heavy positions.Perhaps after two months, The three years bull market will get to its time limit.
Disclaimer
Any content and materials included in Sahmeto's website and official communication channels are a compilation of personal opinions and analyses and are not binding. They do not constitute any recommendation for buying, selling, entering or exiting the stock market and cryptocurrency market. Also, all news and analyses included in the website and channels are merely republished information from official and unofficial domestic and foreign sources, and it is obvious that users of the said content are responsible for following up and ensuring the authenticity and accuracy of the materials. Therefore, while disclaiming responsibility, it is declared that the responsibility for any decision-making, action, and potential profit and loss in the capital market and cryptocurrency market lies with the trader.