
nezyrinfx
@t_nezyrinfx

What symbols does the trader recommend buying?
Purchase History
پیام های تریدر
Filter
nezyrinfx
XAU/USD 5th Wave
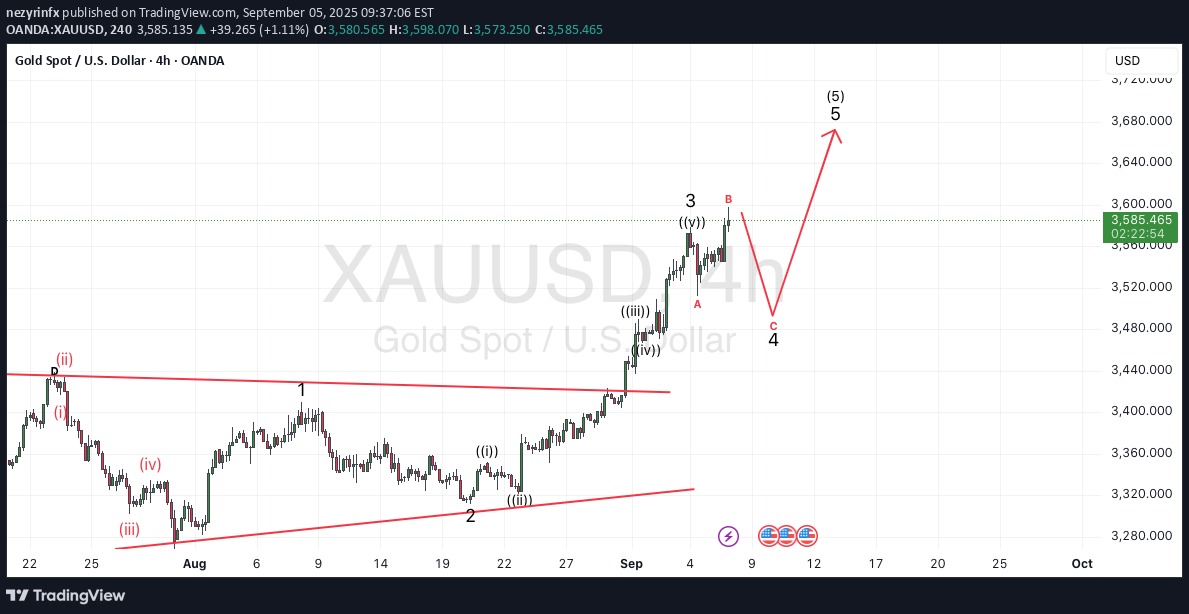
After the Daily chart breakout after forming triangle, now price is climbing on the 5th final wave from the low of 28th Sept 2022. Expecting price to make retracement/pullback after completing wave 3 of (5). And one final push towards $36xx - $37xx region
nezyrinfx
XAU/USD Triangle ABCDE Pattern
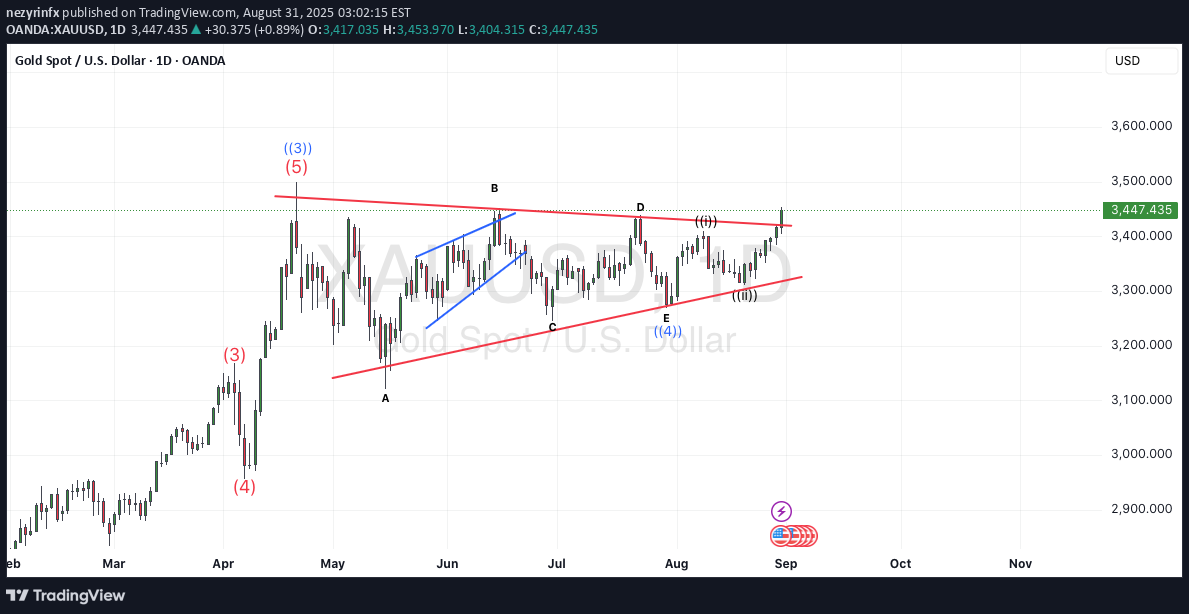
This pattern already made a breakout to the upside. It means Wave ((4)) has been completed in a form of Triangle ABCDE on the Daily timeframe chart. Expect price to climb and breaking peak of 22nd Apr 2025.
nezyrinfx
XAU/USD ABC Correction
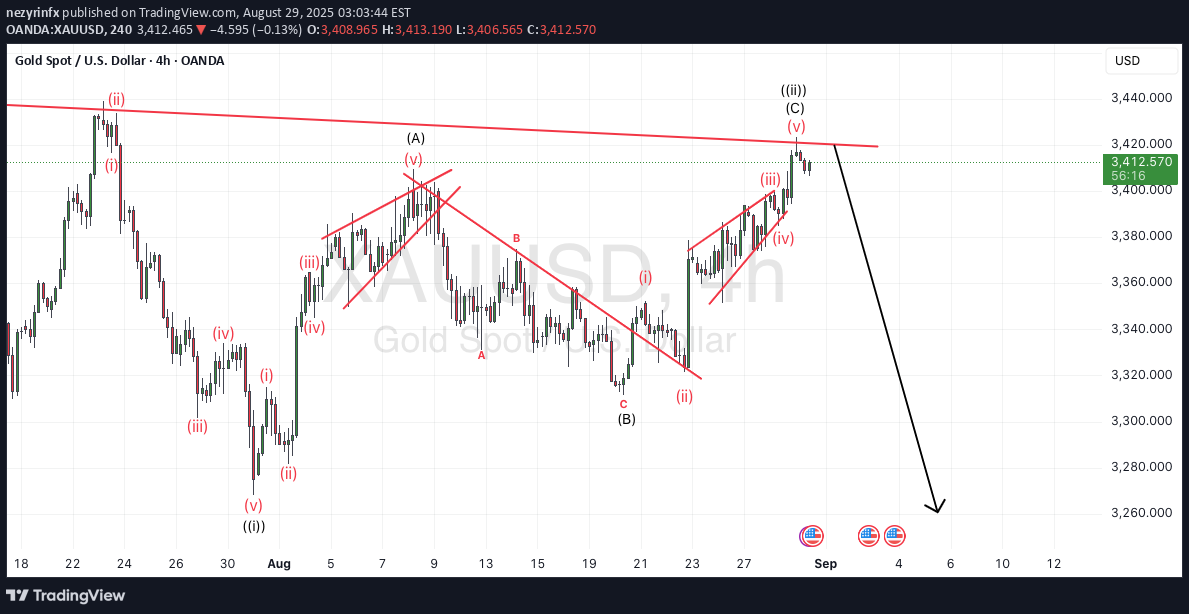
Took this one a long time to develop with a lot of Ending and Leading Diagonals formed in the structures and as long as price doesn't break above 23rd July high, it is still a valid view for it. On the Daily chart, we could see a triangle is forming or already formed which confirms it is a Wave ((4)) before one more more high could be seen to make it for Wave ((5)) from the low of 14th November 2024.Failed to realize this pattern as it already made a breakout to the upside. It means Wave ((4)) has been completed in a form of Triangle ABCDE. Expect price to climb and breaking peak of 22nd Apr 2025
nezyrinfx
XAU/USD Wave Count

Wave (B) of ((ii)) suggested to have ended as Expanded Flat Correction ABC and right now price is to expected to decline to complete Wave (C) of ((ii)) before moving up again in at least 3 waves.
nezyrinfx
XAU/USD Wave Count Update

Looks like wave (B) (red) forms in a triangle structure and now price has broken down below the end of wave (A) and soon will complete wave (C) before climbing back again to finish off wave ((5))
nezyrinfx
XAU/USD Wave Count Update

Price climb from the low of 7th April is close to an ending for 5 waves and soon will be making pullback.
nezyrinfx
nezyrinfx
XAUUSD ABC Correction Alternate View

From previous analysis, an ABC Running Flat Correction could be ended at low of $1680 and price might climb to make new high.
nezyrinfx
XAUUSD ABC Correction

Price decline from peak of March suggested to end with 5 waves internal structure of Leading Diagonal. An ABC Correction is anticipated to happen before further decline. Alternatively, price ending at low of $1680 could be a Running Flat ABC from peak of August 2020 and price is starting to climb towards $2500 - $2700.
nezyrinfx
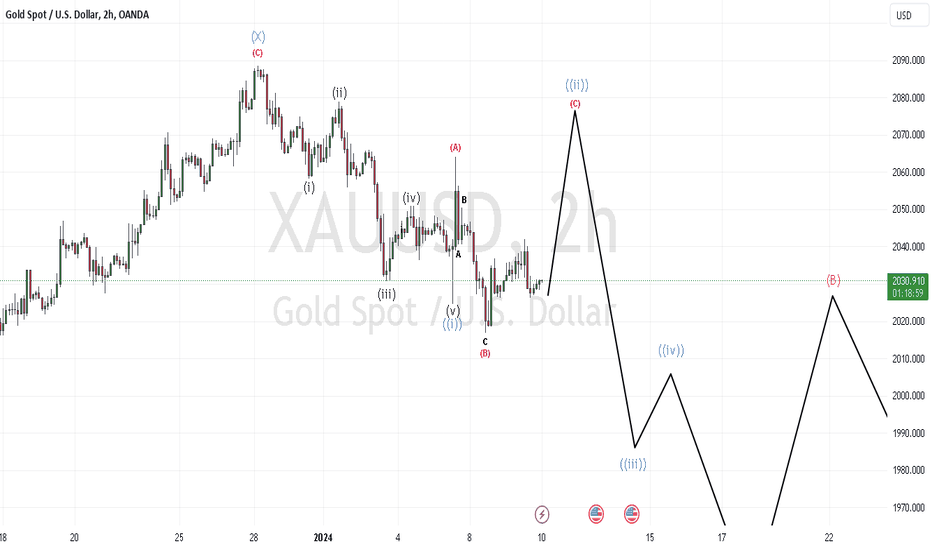
XAU/USD WXY Correction

Price climb from the low of 16th May looks to be forming in a WXY Corrective Wave structure where wave (X) looks to be formed in a flat correction of ABC. We could expect a pullback after the rally on 10th June for wave (B) of (Y) before another push up for wave (C) of (Y) to complete this retracement from peak of $2070.
Disclaimer
Any content and materials included in Sahmeto's website and official communication channels are a compilation of personal opinions and analyses and are not binding. They do not constitute any recommendation for buying, selling, entering or exiting the stock market and cryptocurrency market. Also, all news and analyses included in the website and channels are merely republished information from official and unofficial domestic and foreign sources, and it is obvious that users of the said content are responsible for following up and ensuring the authenticity and accuracy of the materials. Therefore, while disclaiming responsibility, it is declared that the responsibility for any decision-making, action, and potential profit and loss in the capital market and cryptocurrency market lies with the trader.