
msezng
@t_msezng

What symbols does the trader recommend buying?
Purchase History
پیام های تریدر
Filter
msezng
اتریوم در آستانه موج ۵ صعودی؟ حمایت ۳۵۰۰ دلار و اهداف جدید قیمت!
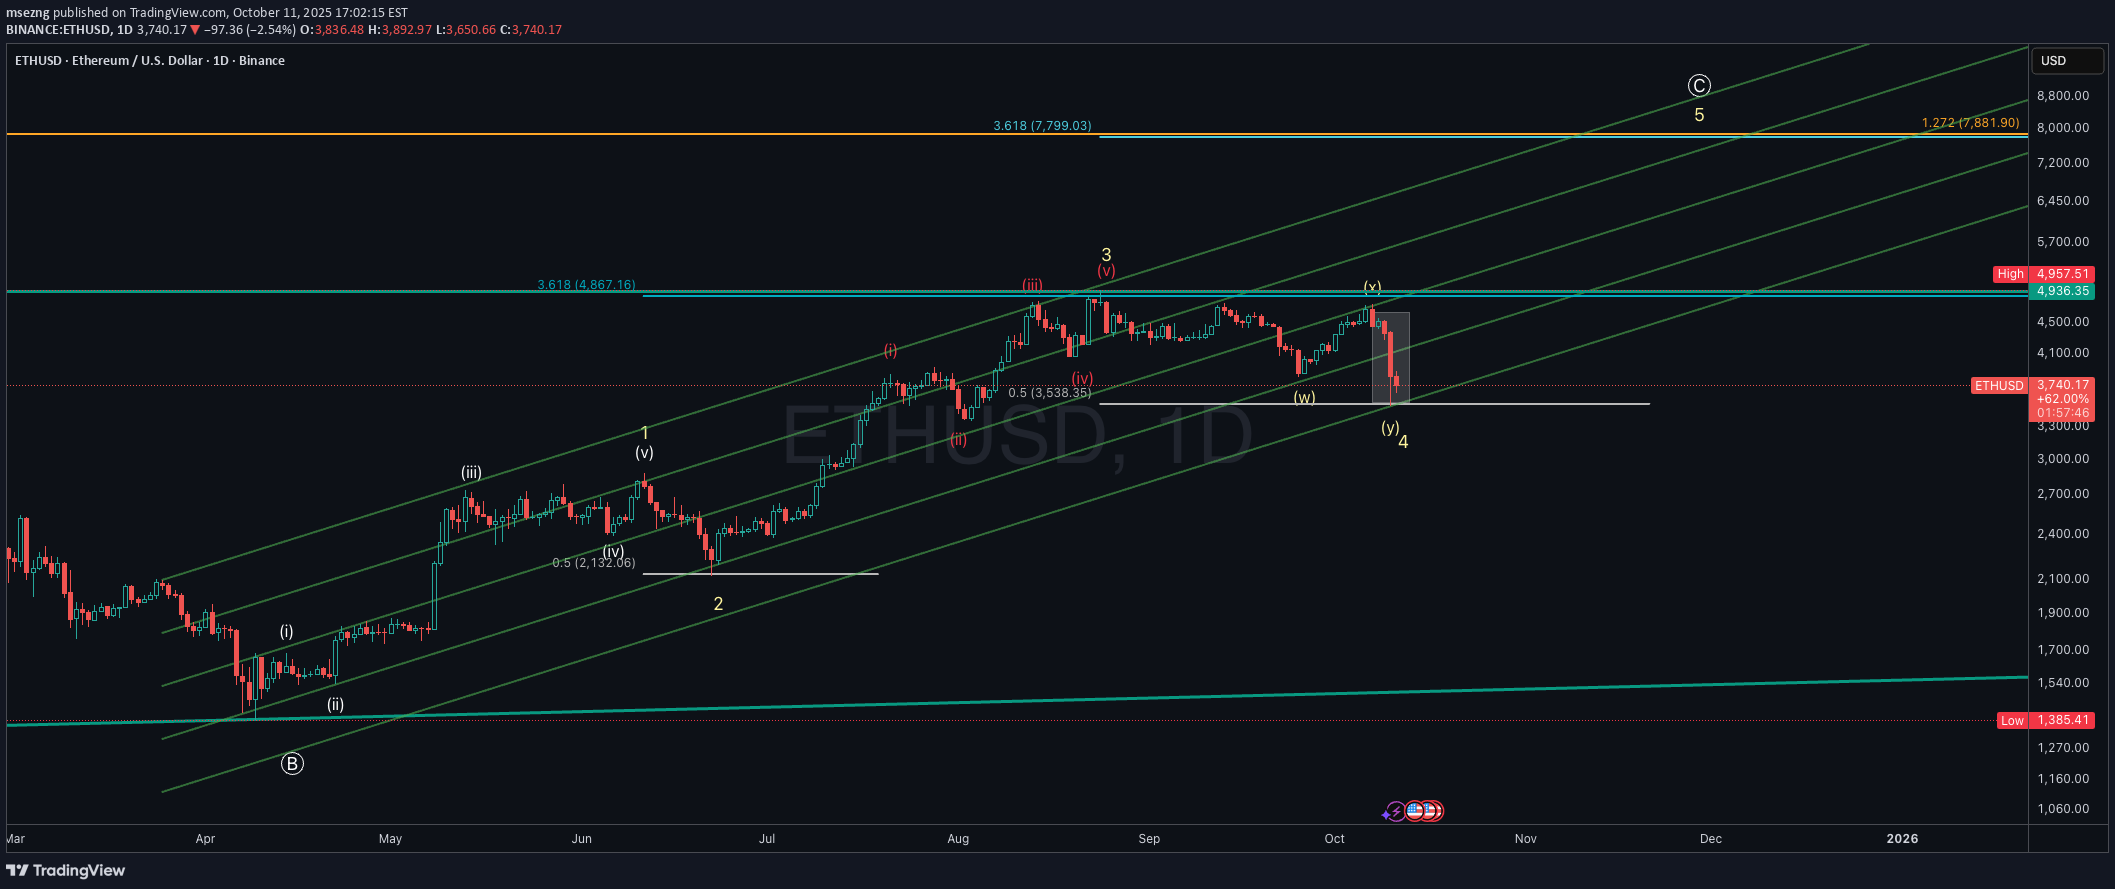
Ethereum (ETHUSD, Log Mode) appears to be completing a Wave 4 corrective structure (W–X–Y) within the broader impulsive cycle from the March lows. Wave 4 found strong support near the 0.5 retracement level around $3,500, aligning with the lower parallel channel of the wave 3 advance. A potential Wave 5 rally could begin once confirmation of reversal is seen, with upside targets projected at: $4,867 (3.618 extension of Wave 1) $7,800–$7,900 (1.272 extension of the macro structure) If ETH breaks below $3,500, it could invalidate this immediate bullish count and suggest a deeper correction. Key Levels: Support: $3,530 / $3,350 Resistance: $4,867 / $7,800 Invalidation: Below $3,500 Watching for signs of a Wave 4 bottom to confirm the start of Wave 5, potentially leading Ethereum into new all-time-high territory in the coming months.
msezng
آخرین موج صعودی تسلا: هدف نهایی ۵۶۴ دلار و پایان الگوی هارمونیک سایفر!

Tesla is progressing through its final impulsive Wave 5, with upside targets aligning at $563–$564, confluencing with the 1.272–1.618 Fib extensions and the completion of the Cypher harmonic (point D). Once this target is reached, a corrective decline is anticipated, forming the Cypher retracement and potentially filling untested gaps below. Key levels to watch: Upside target: $488.5, then $563–$564 zone (Cypher completion). Downside retracement: possible move back toward the $350–$360 region (0.618–0.786 support). Invalidation: A breakout above $565 would invalidate the Cypher completion zone and suggest extended bullish continuation. A breakdown below $400 before reaching $488 invalidates the Wave 5 structure. This scenario blends Elliott Wave 5 projections with harmonic Cypher confluence for a potential high-probability setup.
msezng
تحلیل تکنیکال تسلا (TSLA): آماده انفجار به سمت ۶۳۱ دلار پس از اصلاح کلیدی!
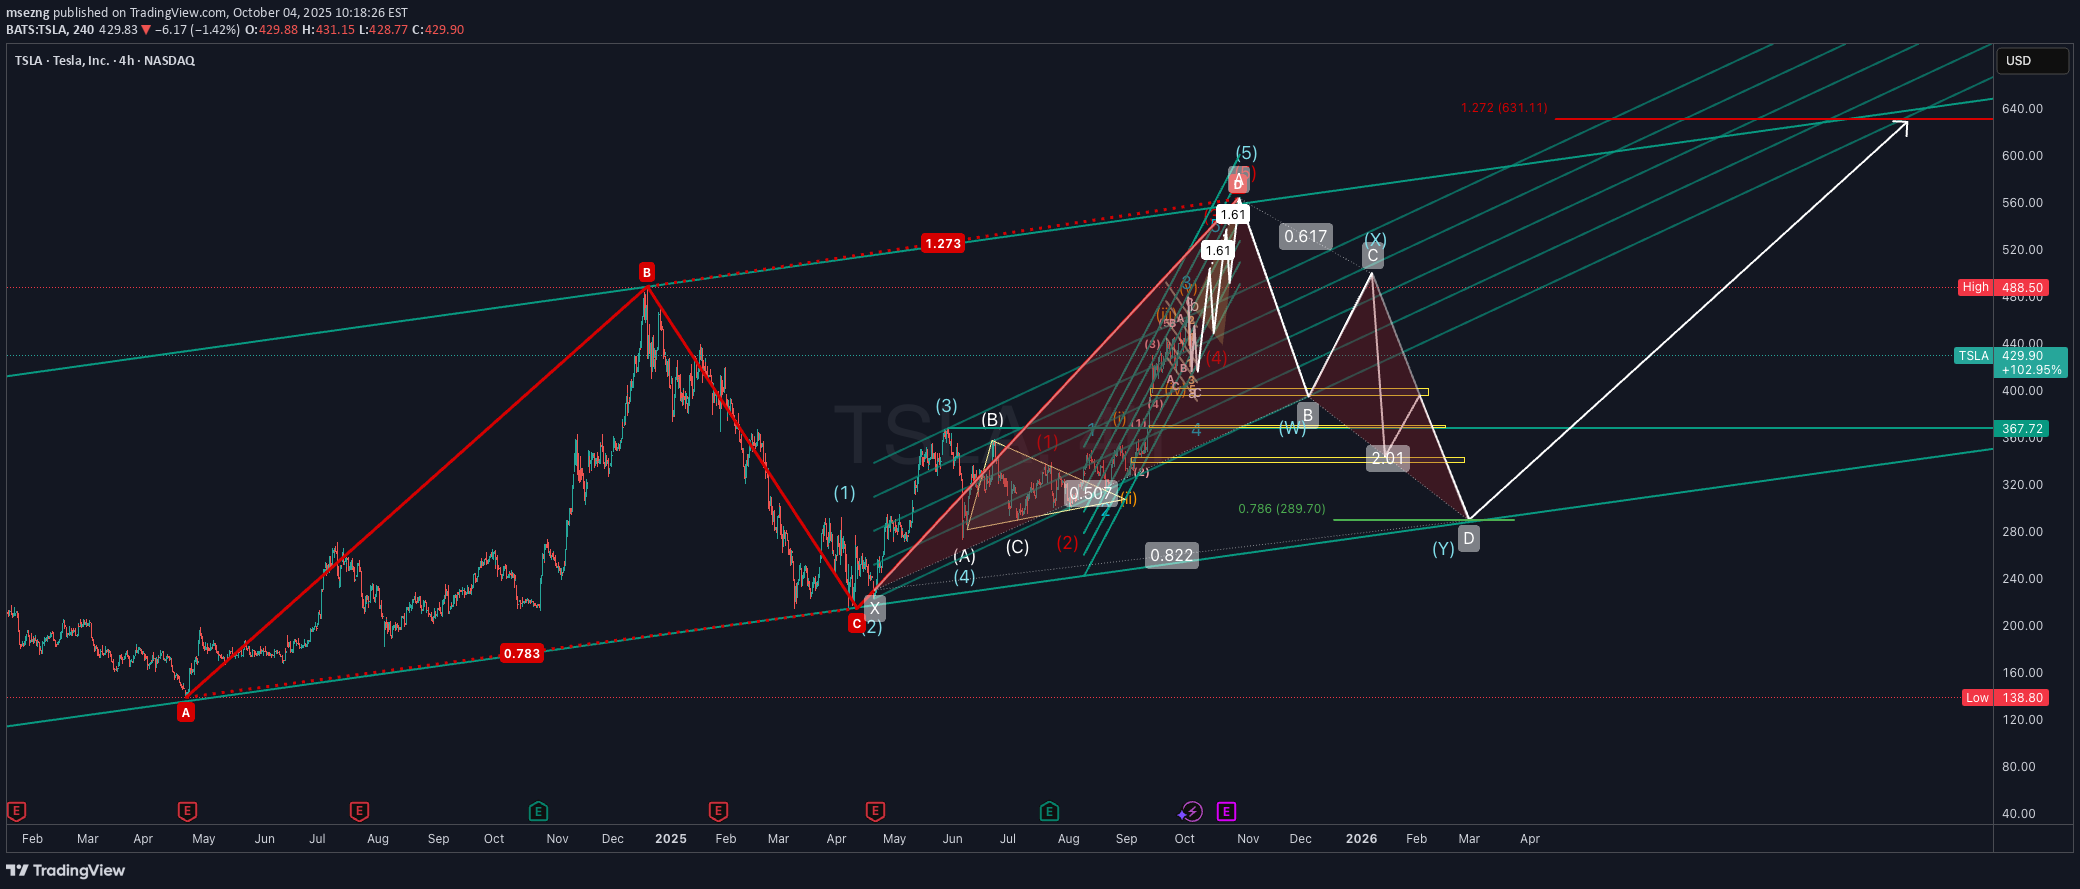
Tesla (TSLA) appears to be completing its final impulsive wave toward the $563 region, which also aligns with the D point completion of the ABCD harmonic pattern. Once this move is finished, the expectation is for a corrective phase that forms a Bat harmonic. This retracement would also work to fill in the untested gaps left behind during the recent rally, with a potential bottom around the 78.6% Fibonacci level. From there, the next bullish leg could initiate, targeting the 127.2% extension at $631. This move would not only confirm the harmonic reversal but also complete a larger Three-Drive pattern that originates from the initial ABCD structure. Key Levels to Watch: ABCD Harmonic D point: ~$563 Bat Harmonic completion zone: ~78.6% retracement Next rally target: $631 (127.2% extension, Three-Drive pattern confirmation) Invalidation Scenarios: A clean breakout above $563 without corrective rejection would invalidate the Bat harmonic setup and suggest an extended bullish run. A failure to hold above ~$367 (channel/structure support) would weaken the harmonic roadmap and risk a deeper bearish continuation instead of a Three-Drive completion. This roadmap suggests a critical short-term top before a deeper correction sets the stage for a much larger rally.
msezng
پیشبینی مسیر حرکت قیمت تسلا (TSLA): موج اصلاحی 4 و هدف نهایی 500 دلار!
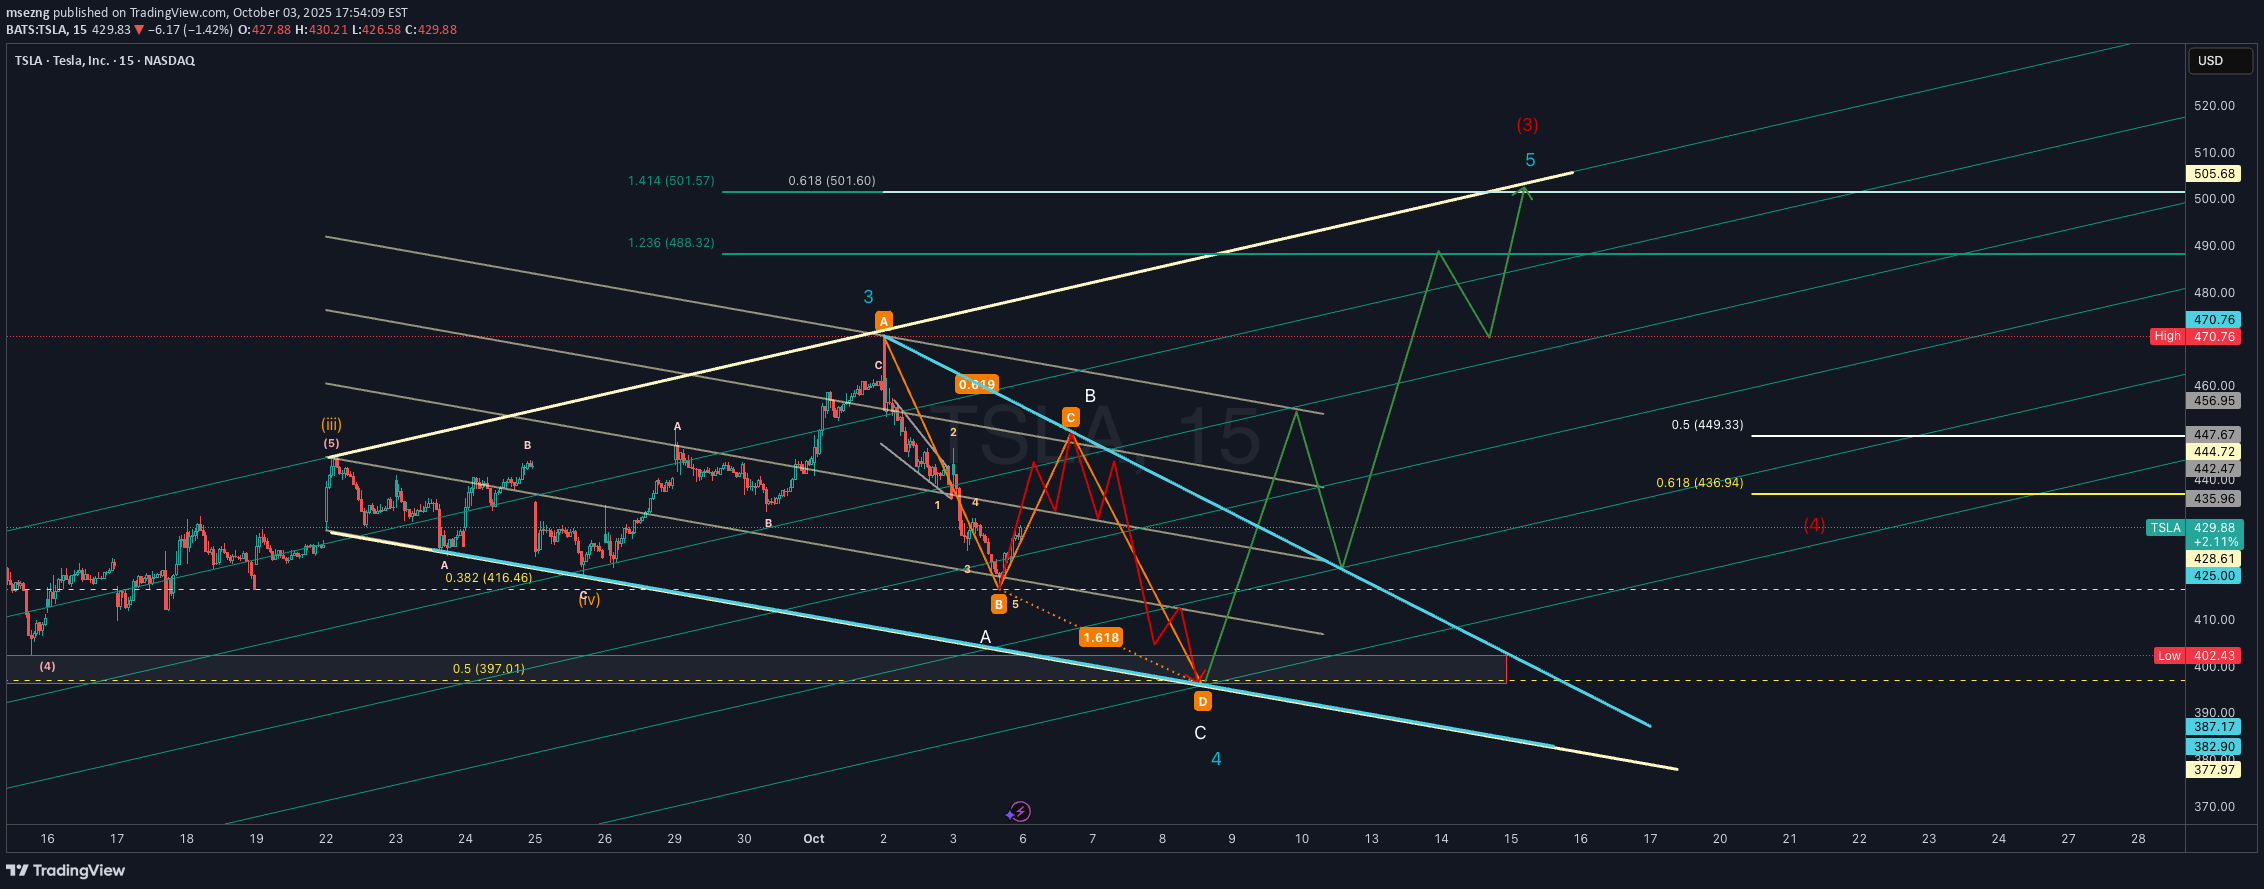
Tesla (TSLA) is forming a potential Wave 4 correction that aligns with an ABC harmonic structure. Price action suggests a possible deeper retracement into the 0.5–0.618 Fibonacci support zone (436–449 area) before resuming its larger uptrend. If Wave 4 completes near the harmonic “D” zone (highlighted support box), the next leg higher could target the 1.236–1.414 Fibonacci extensions around 488–501, in line with Wave 5 projection. Key levels to watch: Support: 436.9 (0.618 retrace), 425 psychological, 397 strong support. Resistance: 444.7, 470.8 (previous high), 501–505 (Wave 5 target). Bullish scenario: Wave 4 completes soon, leading to a strong Wave 5 breakout towards 500+. Bearish scenario: Breakdown below 425–397 support could invalidate the bullish count and extend correction lower. The other possibility is that it is actually unfolding a flat correction in Wave 4 after completing Wave 3 near the recent high. The structure suggests price may continue to consolidate within the corrective channel before setting up the next impulse leg. Bullish scenario: Flat correction completes, setting the stage for Wave 5 rally toward 490–505. Bearish scenario: Breakdown below 397 invalidates the bullish count and signals deeper retracement.
msezng

Tesla (TSLA) is completing a contracting triangle (ABCDE) as wave (iv), setting up for a potential wave (v) of 3. With delivery numbers scheduled for Thursday, momentum could build into the report, creating a rally toward the 455–460 zone, which also aligns with channel resistance and the 1.618 extension. This would complete a ABCD harmonic pattern.Tesla has officially reached at the target price at the 161.8% fib today. It will having its delivery number report tomorrow and that will decide if this ABCD harmonic turn into a extended ABCD harmonic or it went get pulled back to the B point.
msezng

This chart presents Tesla (TSLA) on the weekly timeframe, plotted in logarithmic scale using a custom trend channel (not a pitchfork). The analysis combines price structure with key Fibonacci retracement and extension levels to highlight major inflection points in Tesla’s long-term trend. Channel Structure: The log channel has consistently guided price swings, showing respect for both upper and lower boundaries across multiple cycles. This provides a framework for projecting potential tops and bottoms. Fibonacci Confluence: • Price is currently reacting around the 0.618 retracement ($430) from the previous major swing, a historically significant level for Tesla. • Upside targets align with the 1.618 extensions ($753–$780), creating a strong confluence zone for a potential long-term resistance. • Key downside supports sit at $367, $272, and $218, each coinciding with fib retracements and historical pivot zones. Market Structure: The chart highlights repeating rounded top and bottom formations, suggesting cyclical behavior in Tesla’s price action. Rounded bottoms have historically marked accumulation zones, while rounded tops have aligned with distribution phases. Current Outlook: After reclaiming the mid-channel region and pushing through significant resistance, Tesla is now at a pivotal stage. A confirmed breakout above $488 could open the path toward the higher channel range and eventual fib targets. Failure to hold $430, however, risks a retrace back to $367 or lower channel support.
msezng

The Macro View: The broader structure indicates that the peak in late 2024 marked the completion of a primary Wave ③. The subsequent decline into the April 2025 low was a standard a-b-c zigzag correction, successfully completing the large-degree Wave ④. This has set the stage for the next and final impulse wave of the entire sequence. The Micro View & The Key Pattern: The rally from the April 2025 low marks the beginning of our primary Wave ⑤. This wave will itself subdivide into five smaller waves. The key to this entire count is the complex Wave (2) of ⑤ that took place from June to August. This was not a simple pullback but a W-X-Y complex "double three" correction. Wave W was the initial rally from the April low to the June high. Wave X manifested as a classic contracting triangle, consolidating energy and building cause for the next major move. Wave Y is the current breakout we are witnessing now, marking the end of the entire corrective phase and the resumption of the primary uptrend. Future Projection: With the W-X-Y correction now complete, TSLA appears to have begun its powerful Wave (3) of ⑤. This is typically the strongest and most extended part of an impulse. Short-term: We expect the initial breakout to continue, finish forming Wave v of (1). Mid-term: Initial price targets for the completion of the entire Wave ⑤ sequence point towards the $520 - $560 zone, which aligns with the 1.618 - 1.886 Fibonacci extension levels of the preceding impulse. Invalidation: This bullish outlook remains valid as long as the price stays above the low of Wave (2) of ⑤, established at the end of the triangle around the $310 level. A break below this point would invalidate this specific count.
msezng

This is a long-term analysis of Tesla (TSLA) stock on the weekly timeframe, combining Elliott Wave Theory, Fibonacci extensions, and price structure (base formations) within a broad logarithmic trend channel. Key Highlights: 🔹 Base Formations: Base 1 (2010–2013): First consolidation before TSLA’s breakout. Base 2 (2014–2019): A wide triangle structure leading to explosive growth. Base 3 (2021–2024): Ongoing range suggesting wave (2) correction. Base 4 (2026–2032): Projected future range before a possible euphoric blow-off phase. 🔹 Elliott Wave Structure: Current wave count suggests TSLA is finishing wave (2) of a larger 5-wave structure. Bullish impulse expected with wave (3), (4), and (5) leading to new ATHs, potentially into the $8,000–$10,000+ range. A corrective ABC phase may follow, bringing price back toward key support (~$450 zone), aligned with Fibonacci retracements and channel support. 🔹 Fibonacci Levels: 0.618 and 2.618 extensions align with historical breakout points and future resistance zones. Long-term projection targets include $1,226, $4,400, and potentially $8,000+, with eventual reversion to the mean. 🔹 Log Channel: Price has respected a long-term ascending channel. Midline and upper resistance bands guide potential future resistance zones.
msezng

This chart presents a detailed Elliott Wave analysis on Tesla (TSLA) in the 4-hour timeframe. The price structure from the April low suggests a completed corrective ABC pattern, forming a solid wave (4) base. A new bullish impulse appears to be underway, with wave (1) and (2) of wave (5) already confirmed. We are now tracking the development of wave (3), which has the potential to extend toward the 1.618 Fibonacci extension zone around $426, with intermediate resistance at $406.84 (1.414 Fib). The projected wave (5) could complete near $440, marking the end of a larger degree 5-wave impulse structure. Key levels to watch: support near $320.47 (0.5 retracement level of wave 1–3) and resistance at $360–380 before the next leg higher. Two possible scenarios are outlined: Primary Path (solid lines): Strong bullish continuation toward wave D and (5). Alternate Path (dotted lines): Short-term correction back to the trendline support before resuming the uptrend. The chart also highlights the breakout from a long-term descending trendline and a potential cup-and-handle continuation pattern, supporting the bullish thesis. 📈 Trade Plan: Watching for confirmation above $360 to target $406 and $426+ in the coming weeks. Stops should be considered below $310 depending on risk tolerance. NFA
msezng

This looks like a textbook example of Richard Wyckoff's "Creek" analogy. For months, the stock faced a "creek" of selling pressure around the $280-$300 resistance line, turning back any attempt to move higher. Before the big move, the price "backed up" to a Last Point of Support (LPS) to gather steam—that was the dip we saw back in Phase D. Then came the powerful "Jump Across the Creek," a breakout with strength and volume, launching us into what appears to be Phase E. But the story isn't over. The sharp pullback we're seeing now isn't necessarily failure. It's the critical "Back-Up to the Edge of the Creek." The stock is testing if the old resistance (the far bank of the creek) will now hold as new support. The question now is: Does the ground hold for the next launch higher, or does the price fall back into the water? This is the moment of truth.
Disclaimer
Any content and materials included in Sahmeto's website and official communication channels are a compilation of personal opinions and analyses and are not binding. They do not constitute any recommendation for buying, selling, entering or exiting the stock market and cryptocurrency market. Also, all news and analyses included in the website and channels are merely republished information from official and unofficial domestic and foreign sources, and it is obvious that users of the said content are responsible for following up and ensuring the authenticity and accuracy of the materials. Therefore, while disclaiming responsibility, it is declared that the responsibility for any decision-making, action, and potential profit and loss in the capital market and cryptocurrency market lies with the trader.