
mohamadrezaKhorsand
@t_mohamadrezaKhorsand

What symbols does the trader recommend buying?
Purchase History
پیام های تریدر
Filter
mohamadrezaKhorsand
Golden Hunt with ICT Strategy: Perfect XAU/USD Analysis in the 1

Hey everyone! Today, I’m excited to share a fascinating analysis of the XAU/USD pair in the 1-hour timeframe using the ICT strategy. I’ve added a free indicator to the chart that not only identifies swing points but also beautifully connects them with lines. This indicator even marks the days of the week, Fair Value Gaps (FVGs), and includes a 20-period EMA. It’s truly an amazing tool! What’s more, it has features for displaying Kill Zones, sessions, and Silver Bullet, but I’ve turned those off for now to keep the focus on the essentials. As you can see, Break of Structure (BOS) points are clearly marked, and I’ve highlighted the areas where the market structure has shifted. Notice how sometimes strong swing highs or lows are "hunted" by a shadow that pierces through, leading to a sharp bearish move afterward. The indicator highlights most of these hunts in red, helping us better anticipate market movements. For entering trades, I used a simple tool to highlight green zones on the chart. I employed Fibonacci retracement levels of 61.8%, 70.5%, 79%, and 50% to pinpoint key entry areas. Additionally, using a custom method based on standard deviation, I marked potential future price zones with dotted lines. In summary, this analysis combines advanced ICT techniques with practical tools to give you a clearer view of gold’s movements. I hope these insights help you achieve more successful trades! ✨
mohamadrezaKhorsand
XAU/USD ICT IDEA

🚀 Unicorn Strategy on the 1H and Daily Time Frame - Bullish Outlook 🚀In the 1h time frame, a Unicorn strategy pattern has formed, giving us a bullish perspective. I'm targeting an ideal buy zone below 50% of today's upward movement (Monday, September 2, 2024). I've identified two potential zones:1️⃣ Zone 1: Located below the London KillZone.2️⃣ Zone 2: Spotted within a 15-minute FVG.By applying standard deviation coefficients, I can better identify the probable target areas and subsequent reactions. 🧠🔔 Important to Note: The previous week's low has been breached, and there’s a high probability that the price will aim to reach the high of the previous week formed on August 28, 2024. However, we must consider another scenario: the price might start reversing from areas below the Weekly High (WH) due to a Hunt and Breaker Block pattern that has formed in the daily time frame. Since this pattern lacks an FVG, it's not a Unicorn. 🦄I've also identified another zone, marked in blue in the second image, which could be a potential sell zone for the Hunt and Breaker Block pattern on the daily time frame. 🔵🎯 Conclusion: In my view, a short-term buy opportunity exists, but the long-term strategy favors selling in the blue-marked zone. 💹Mohammadreza Khorsand@AtiProfit on Telegram🚀✨ Keep an eye on these levels and trade smart! ✨🚀
mohamadrezaKhorsand
XAUUSD GOLD Structure

in the XAUUSD Gold Structure is the Bullish because : in the 4H structure, after reaction to the DE Order Block, the structure in the 15min has changed. note: after reaction in the Order Block we can use this formula: 4H LPP = 15min CHOCH of course in the 15-minute chart, the structure changed from bearish to Bullish because the 15-minute CHOCH has been completed. this is just my idea you can test it. Be successful and profitable SCEPTEREDING
mohamadrezaKhorsand
baby doge coin babydogeusdt analysis update
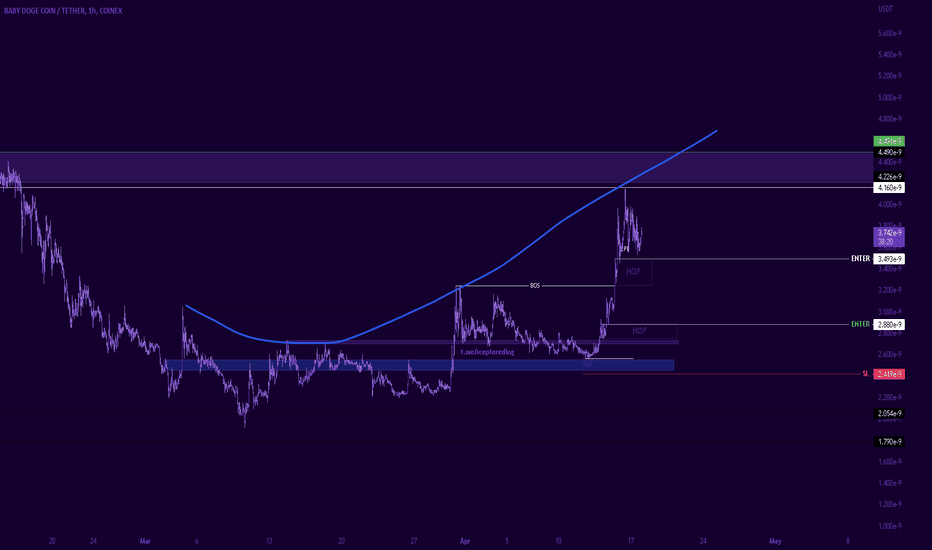
According to the previous analysis, the upward movement in this coin is quite clear. New areas are marked for re-entry. Also, the area where entering can cause the price to fall has also been determined.
mohamadrezaKhorsand
baby doge coin babydogeusdt analysis
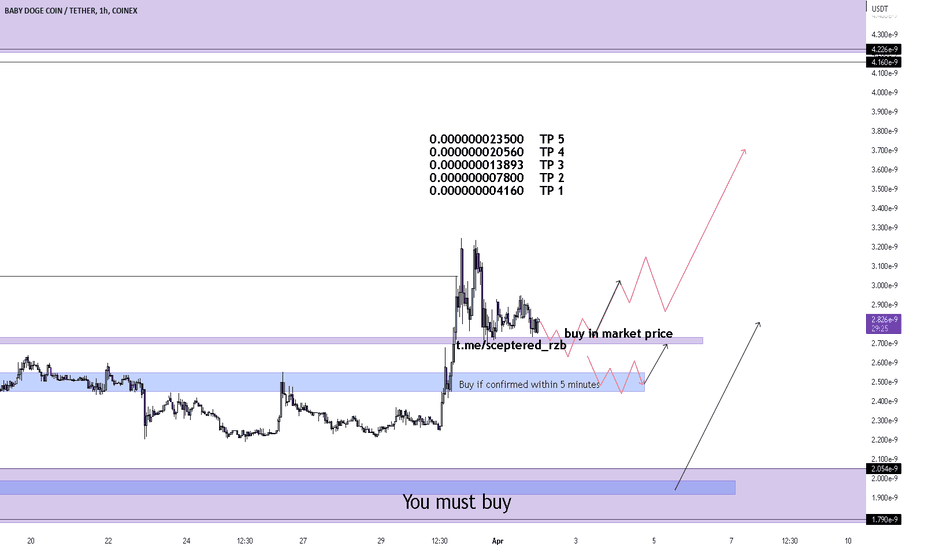
Maybe baby Dodge have a pump Therefore, we enter at the current price. If the price reaches the specified areas, I will buy it. what is your opinion ? 0.000000023500 tp5 0.000000020560 tp 4 0.000000013893 tp 3 0.000000007800 tp 2 0.000000004160 tp 1
mohamadrezaKhorsand

mohamadrezaKhorsand
SIGNALS EUSUSDT

The upward movement is formed from the place of origin. This upward movement will be valid
mohamadrezaKhorsand
SIGNALS BTCUSDT

Due to breaking the structure, there is a strong possibility of growth
mohamadrezaKhorsand
interior of the pivot

The price has reacted to the interior of the pivot and this is a sign of the beginning of a new uptrend.
mohamadrezaKhorsand
✅ Two scenarios for XAU/USD ✅
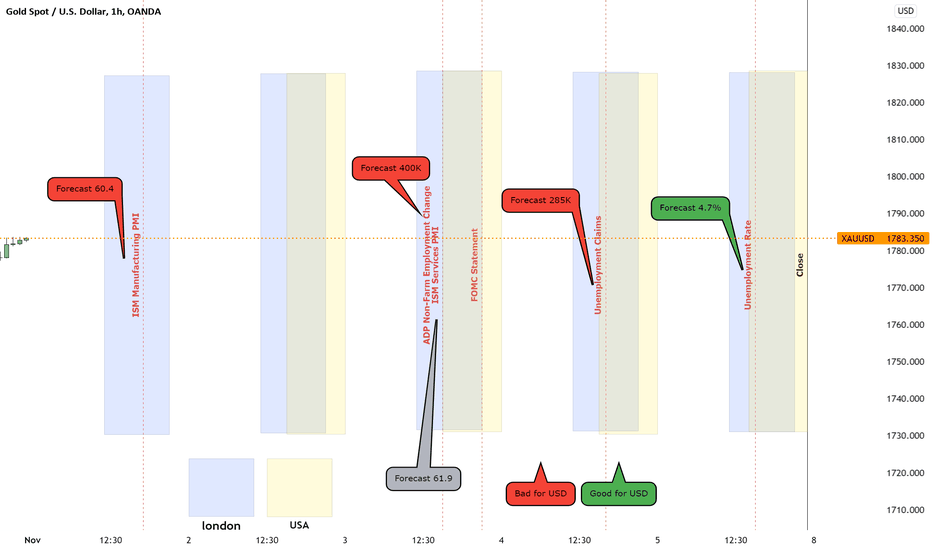
There are two ideas for gold. Since the fundamental news of the dollar gives the possibility of a decline in the value of the dollar, there is a possibility of an upward scenario. But because the 12-hour trend line is broken, there is a possibility of a bearish scenario. Two scenarios: ✅ Scenario 1: The trend line is broken, the pullback market does and then continues its downward trend to reach the price of 1760 to 1750. ✅ Scenario 2: The price hits the bottom of the channel and reacts upwards and moves towards the 1820 and 1830 prices.
Disclaimer
Any content and materials included in Sahmeto's website and official communication channels are a compilation of personal opinions and analyses and are not binding. They do not constitute any recommendation for buying, selling, entering or exiting the stock market and cryptocurrency market. Also, all news and analyses included in the website and channels are merely republished information from official and unofficial domestic and foreign sources, and it is obvious that users of the said content are responsible for following up and ensuring the authenticity and accuracy of the materials. Therefore, while disclaiming responsibility, it is declared that the responsibility for any decision-making, action, and potential profit and loss in the capital market and cryptocurrency market lies with the trader.