
mfadisaleh
@t_mfadisaleh

What symbols does the trader recommend buying?
Purchase History
پیام های تریدر
Filter
mfadisaleh

Gold (XAU/USD) – 1H Chart Analysis Trend: Price is moving in an uptrend, supported by the rising red trendline. Key Support: 3640 – 3650 zone (blue demand area). Key Resistance: 3707 – 3710 (red horizontal line). Scenarios: Bullish (green): Pullback to 3640–3650 then strong rally toward 3730–3750. Moderate (red): Small correction, retest resistance, then gradual rise. Sideways (blue): Range movement before breakout. Smart Money Signals: Recent BOS (Break of Structure) shows bullish bias. A close below 3640 would invalidate upside scenarios. 👉 Bias: Bullish above 3640, targeting 3707 → 3730–3750.
mfadisaleh
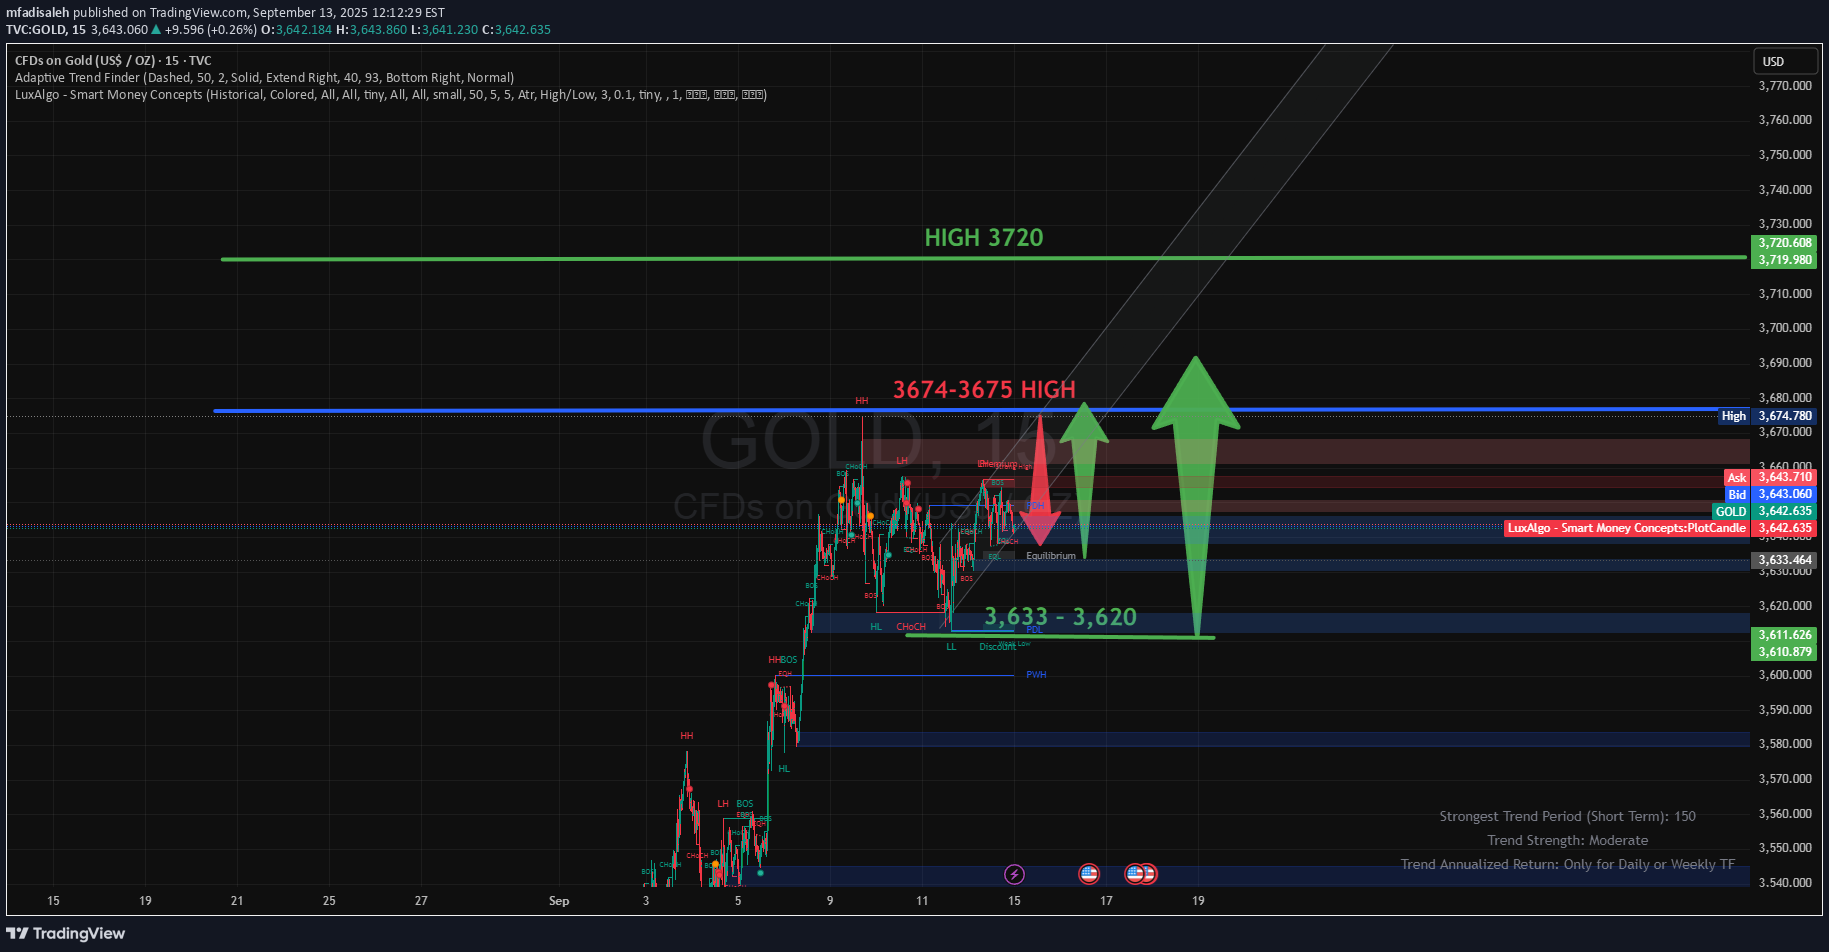
📈 Possible Scenarios Bullish Scenario (Trend Continuation): If the price breaks the 3,674-3,675 area and holds above it, then new targets will be reached at 3,700-3,720. Bearish Scenario (Correction): In the event of a price rejection from the Premium area, then a decline to test 3,633-3,620. A break of this area could push gold towards 3,560 and then 3,480 (Equilibrium). ✅ Conclusion Gold is in a very strong uptrend. It is currently in a sensitive zone (Premium + Weak High). It is best to wait for confirmation: Break and hold above 3,675, then continue the upward trend. Rejection and decline from this area, then a correction towards 3,620-3,560.
mfadisaleh

در تایم فریم ۵ دقیقهای، الگوی مثلث صعودی تشکیل شده که دیدگاه خرید را تقویت میکند. شایان ذکر است که شکست سطح ۳۰۲۲.۰۶۰ صعود به سمت تارگت ۳۰۲۴.۰۱۰ را پشتیبانی کرد و در صورت شکست این سطح، انتظار میرود قیمتها به سمت سطح ۳۰۲۵.۳۱۰ حرکت کنند. سطوح حمایت و مقاومت: سطح پیوت ۳۰۲۳.۰۵۶، حمایتها: S۱: ۳۰۲۲.۳۱۳، S۲: ۳۰۲۱.۳۶۶، S۳: ۳۰۲۰.۶۲۳، مقاومتها: R1: ۳۰۲۴.۰۰۳، R2: ۳۰۲۴.۷۴۶، R3: ۳۰۲۵.۶۹۳
Disclaimer
Any content and materials included in Sahmeto's website and official communication channels are a compilation of personal opinions and analyses and are not binding. They do not constitute any recommendation for buying, selling, entering or exiting the stock market and cryptocurrency market. Also, all news and analyses included in the website and channels are merely republished information from official and unofficial domestic and foreign sources, and it is obvious that users of the said content are responsible for following up and ensuring the authenticity and accuracy of the materials. Therefore, while disclaiming responsibility, it is declared that the responsibility for any decision-making, action, and potential profit and loss in the capital market and cryptocurrency market lies with the trader.