
maikisch
@t_maikisch

What symbols does the trader recommend buying?
Purchase History
پیام های تریدر
Filter
Signal Type
maikisch
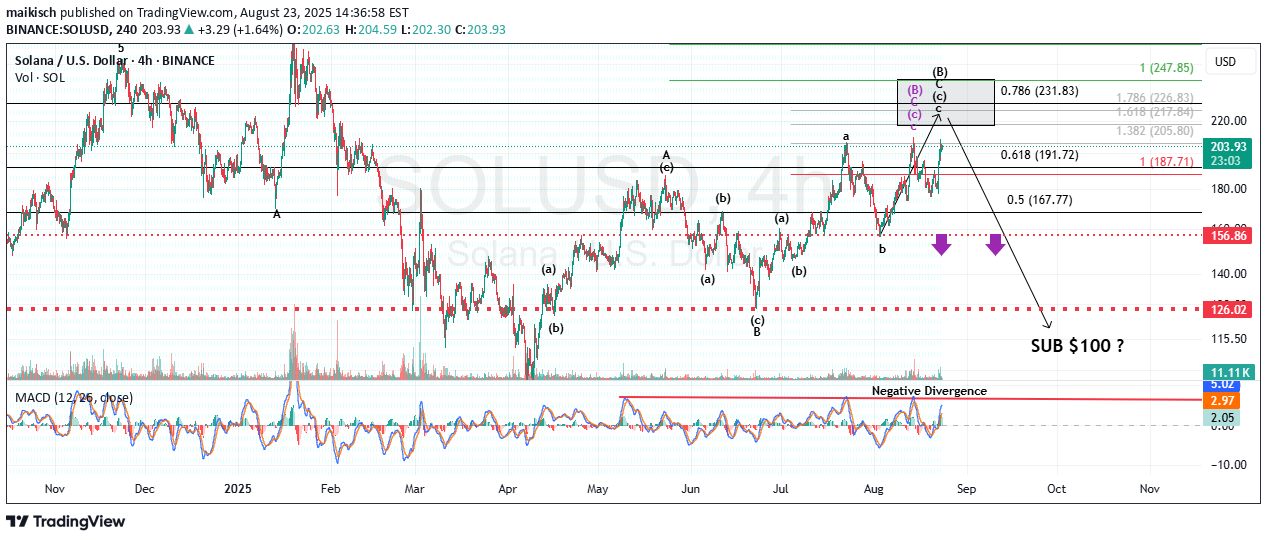
Solana is currently trading just below the target box outlined by the black primary count. I continue to expect that, over the coming days and weeks, price will eventually reach this zone before any pattern develops that could threaten the red dotted line support areas shown on the below chart.
maikisch
I rarely cite financial news in my market updates. My reasoning is simple: all perspectives, bullish or bearish, are ultimately reflected in price action. That price action forms patterns, and those patterns can be analyzed to produce reasonable forecasts. After years of applying Elliott Wave theory, this approach has consistently stood the test of time. That said, I’ll break from tradition today, as I believe the following excerpt is particularly relevant to my latest Trading View update. It comes from Barbara Kollmeyer’s article, “There’s a slow-motion crisis in bonds — and this bearish strategist thinks it will hit stocks.” For context, I regularly track multiple market indices, futures contracts, single stocks, and notably, the yield on the 30-year U.S. Treasury Bond. For the past year, I’ve highlighted the counterintuitive rise in long-term yields that ironically began when the Fed started cutting its benchmark rate in September 2024. While brief divergences between long-term yields and Fed policy aren’t unusual, this persistent uptrend is different. The yield has been carving out a clear pattern of higher highs and higher lows, appearing now on the verge of a breakout—not just toward incremental new highs, but potentially into a runaway scenario for long-term rates. This is why Albert Edwards’ recent comments caught my attention: “There is a slow-motion crisis unfolding in the government bond markets that equity investors continue to ignore at their peril. The upward grind for long bond yields has been relentless, yet investors keep ignoring that to focus instead on more bullish metrics such as the latest reporting season driven by the mega-cap IT stocks, that promises a pot of gold at the end of the AI rainbow.” His perspective resonated with me. Having lived through the dot-com boom and bust, I recall how new technologies can fuel outsized market optimism. AI undoubtedly carries transformational potential, much like the Internet. But just as it took nearly two decades for the Internet to fully translate from speculative boom to tangible economic value, AI’s payoff will likely follow a similarly extended trajectory. It’s not an immediate catalyst. What I am certain of is this: the cost of long-term money is rising, with implications far beyond bond charts. Higher yields directly affect mortgage rates and other long-term financing costs. More importantly, sustained upward pressure in long-term rates has the potential to weigh heavily on equities, broader markets, and asset valuations for far longer than many currently expect. https://www.tradingview.com/chart/US30Y/Z8089Ako-Long-Term-Rates/
maikisch
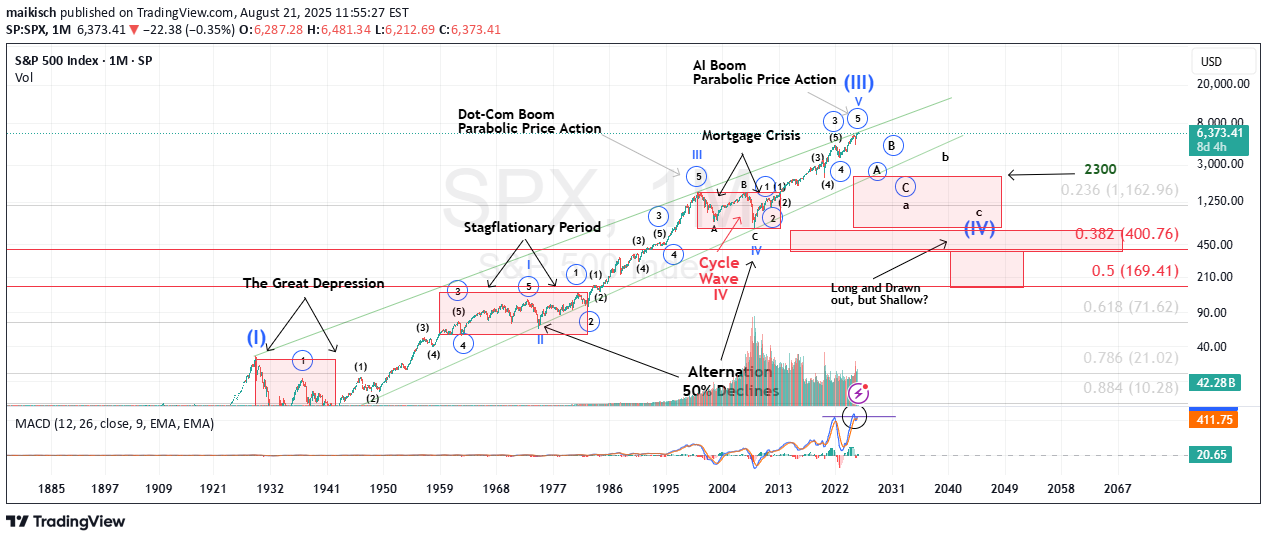
It’s widely accepted that Mark Twain once said (or wrote) that “history does not repeat itself, however it tends to rhyme”. Historical Parallels to a Super Cycle Wave (I) Top in U.S. Equities The road to a major market top is often paved with echoing patterns from the past, and today's landscape bears an uncanny resemblance to pivotal historical events that preceded economic upheaval. The 1918 Spanish Flu—though less economically damaging in the U.S. than elsewhere, still triggered a 1.5% drop in GDP and a 2.1% decline in consumer spending. The resulting economic weakness, paired with rising inflation, eroded real returns on equities and short-term government bonds for years. Then came the 1929 stock market crash, the spark that ignited the Great Depression. Driven by a perfect storm of extreme speculation, sky-high valuations, and a regulatory vacuum, the collapse revealed the systemic fragility beneath the euphoria. Adding fuel to the fire, the Smoot-Hawley Tariff Act of 1930 slammed the brakes on global trade. By sharply raising tariffs on imports, it invited swift retaliatory measures from abroad. The result: a devastating plunge in both U.S. exports and imports, deepening the economic crisis and worsening unemployment. Smoot-Hawley has since become a textbook example of how protectionist policy can magnify economic damage. Modern Echoes: A Cycle Repeating? Fast forward to the present and we see unsettling similarities. The Covid-19 pandemic serves as a modern analog to the 1918 flu, disrupting global supply chains and triggering a steep drop in GDP and consumer spending. Unlike the post-WWI period, however, inflation didn’t precede the crisis, it exploded afterward, fueled by pent-up demand and fiscal stimulus, giving rise to persistent “sticky” inflation....and NOT TRANSITORY. In a similar inversion of sequence, the Trump-era tariffs—modern-day echoes of Smoot-Hawley, were enacted before any major equity downturn, not after. Still, their long-term impact on global trade and supply chain reliability remains a pressure point for the economy. Most critically, speculation and valuation excess are again center stage. Just as the roaring ’20s were characterized by euphoric risk-taking, today’s U.S. equity market is trading at record-high P/E ratios, despite rising macroeconomic uncertainty and deteriorating breadth. These historical and contemporary markers suggest we may be approaching the apex of a Super Cycle Wave (III), a turning point that, like its predecessors, may only be fully recognized in hindsight. It is my contention, that history is currently rhyming. Best to all, Chris
maikisch
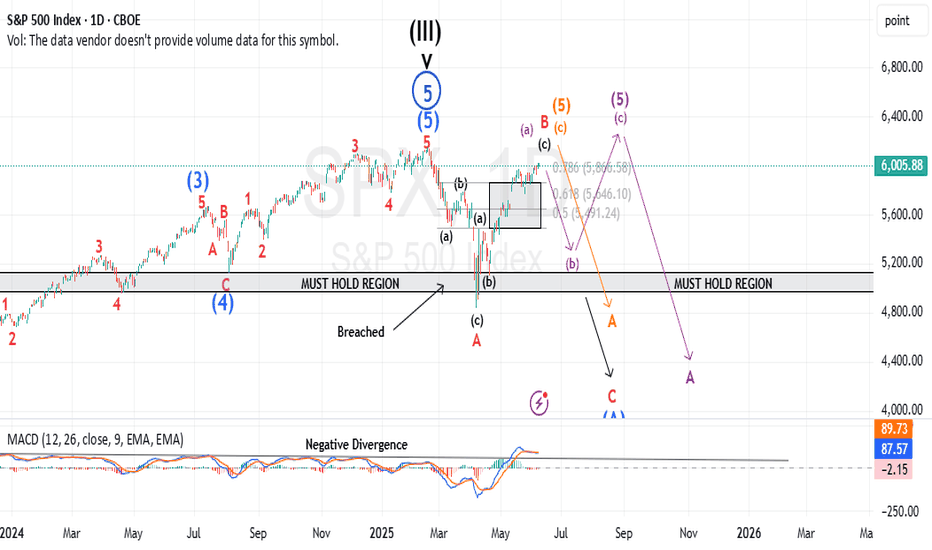
While the futures market has yet to break into new all-time high territory, the previously discussed bearish micro setup has now been invalidated. In its place, we’re witnessing a complex, overlapping advance—creeping steadily toward the prior highs in the S&P 500 (ES). At the micro level, I currently see no compelling bearish setup. However, this grinding upward move—lacking strong conviction from either buyers or sellers—is not necessarily bullish. In fact, it’s a hallmark of a potentially dangerous pattern: a primary degree ending diagonal. If my interpretation is correct, both the “orange” and “purple” wave counts point to the same ominous conclusion. They suggest that what we're seeing could culminate in a sharp, possibly violent reversal—one that would ultimately retrace back to where this entire primary wave began. For reference, that’s just above 4,000, marked by the conclusion of Primary Wave 4 in October 2022. This is the moment for caution—not after the damage is done. Yes, we may push into new all-time highs. But within this fragile and overlapping structure, that outcome is far from guaranteed. Even if we get there, the looming question remains: At what cost?
maikisch
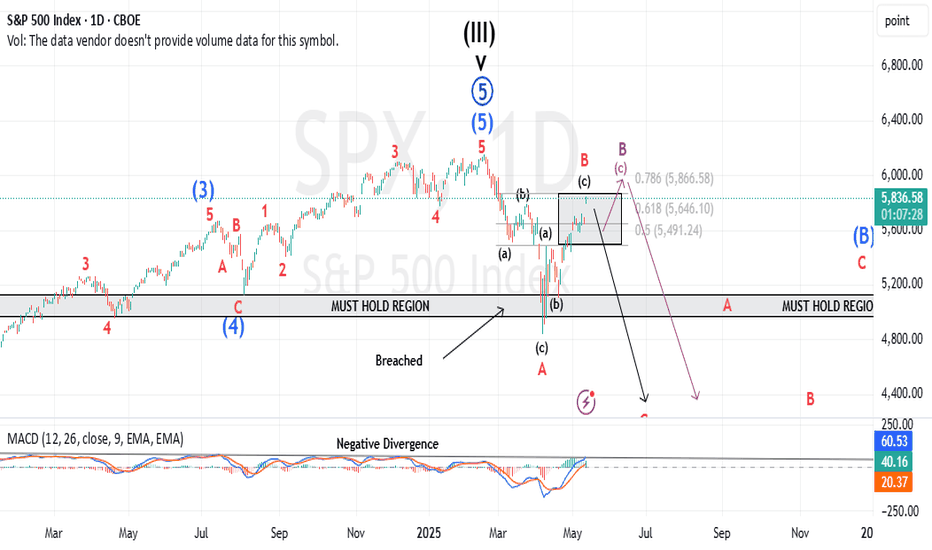
I am tracking a micro pattern with the new local high made in the ES last night and today's price action as a micro 5-down....we should get a slight retrace into the 5960 ish area. Maybe tomorrow...maybe in the overnight session tonight. If price can then breach todays micro low of 5884 in the ES futures...we need to then follow through with a breach of 5857 to give us our first indication, we may have struck a top. From there I am following 2 counts...Purple, or my primary count which is a minor C of Intermediate (A). Best to all, Chris
maikisch
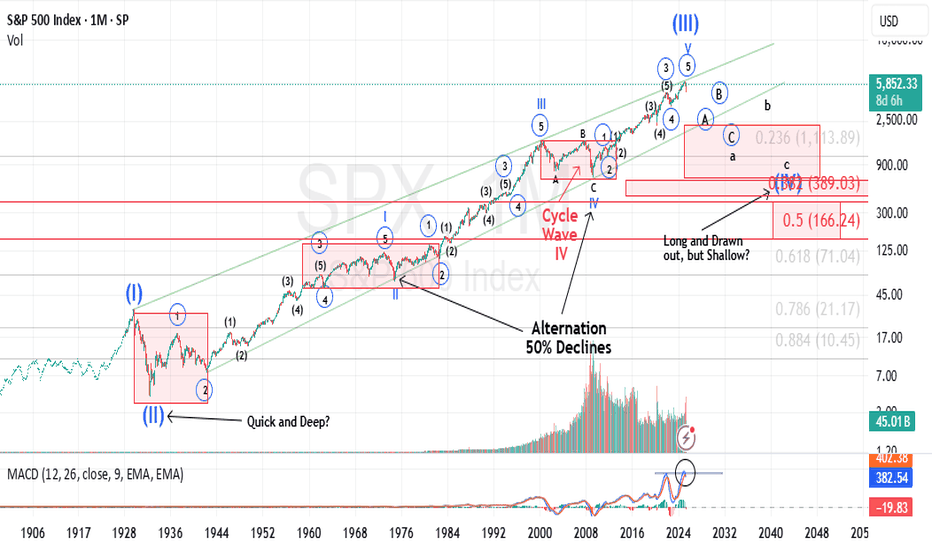
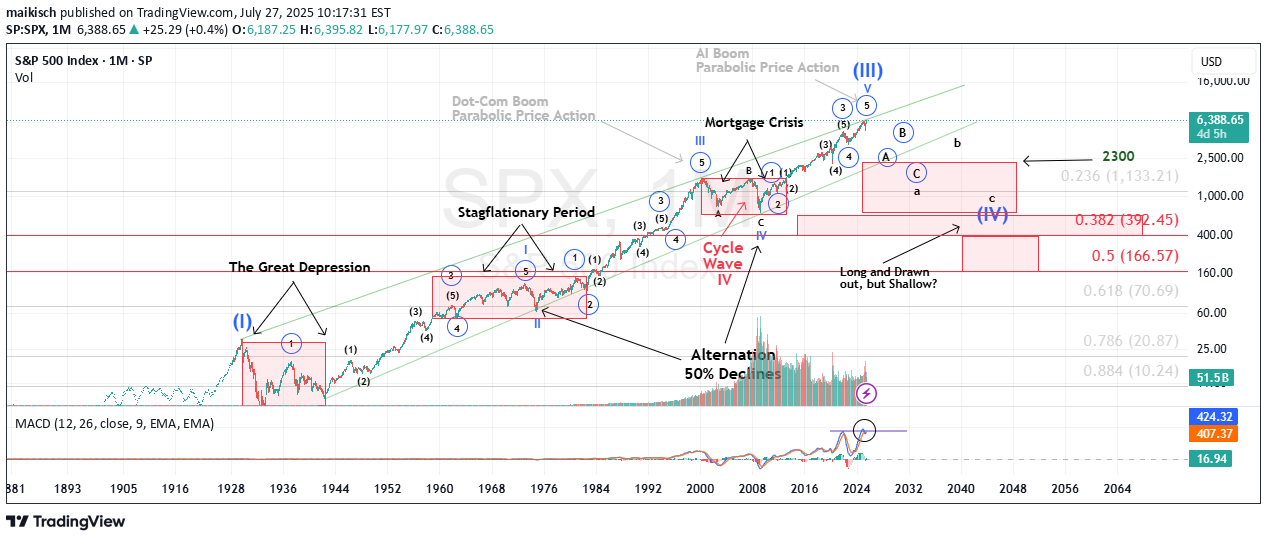
My last market update ended up receiving a comment from a Trading View user that seemingly was mocking the fact that my shorter-term chart posted in an update to my followers had directional arrows down to the approximate area of ES 4400. Here's my longer-term expectations. If some didn't like 4400, I suspect they will equally dislike sub-ES 1,000. Best to all. Chris
maikisch
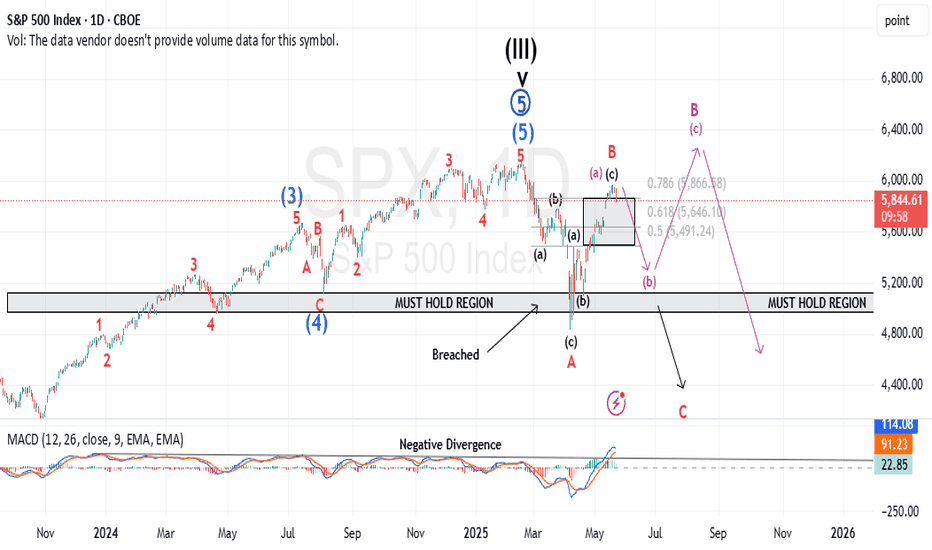
In my last post…” We Have a Full Pattern into The Target Box” … I stated, “I am now looking for a 5-wave pattern to develop to the downside, followed by a 3-wave retrace, that in the coming weeks can take us back out of the target box to the downside.” That pattern may have begun today in the very micro sense. This is very preliminary, so we need follow through to the downside so that in the days and weeks to come, we can confirm a top in minor B.
maikisch
I am now looking for a 5-wave pattern to develop to the downside, followed by a 3-wave retrace, that in the coming weeks can take us back out of the Target box to the downside. Price must breach the 5578 area to give us any indication the pattern to the upside below is cracking.
maikisch
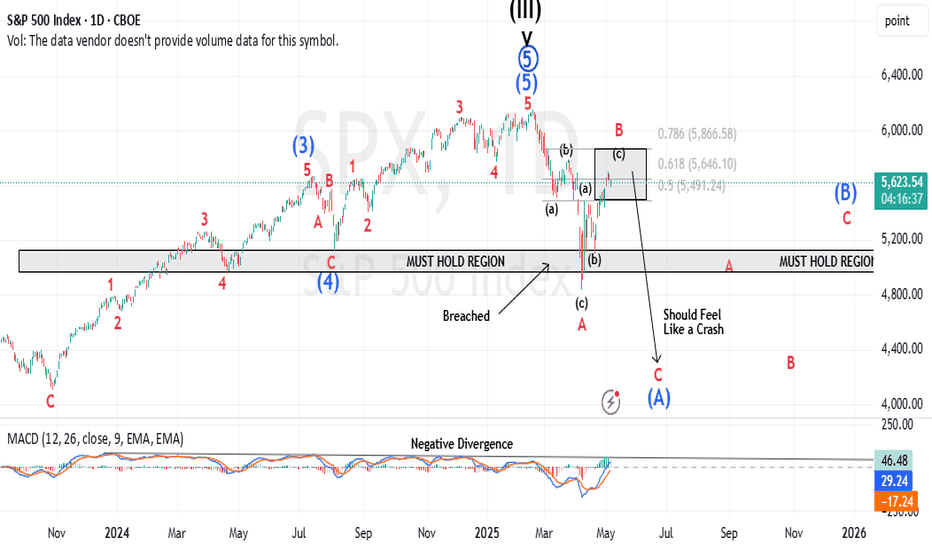
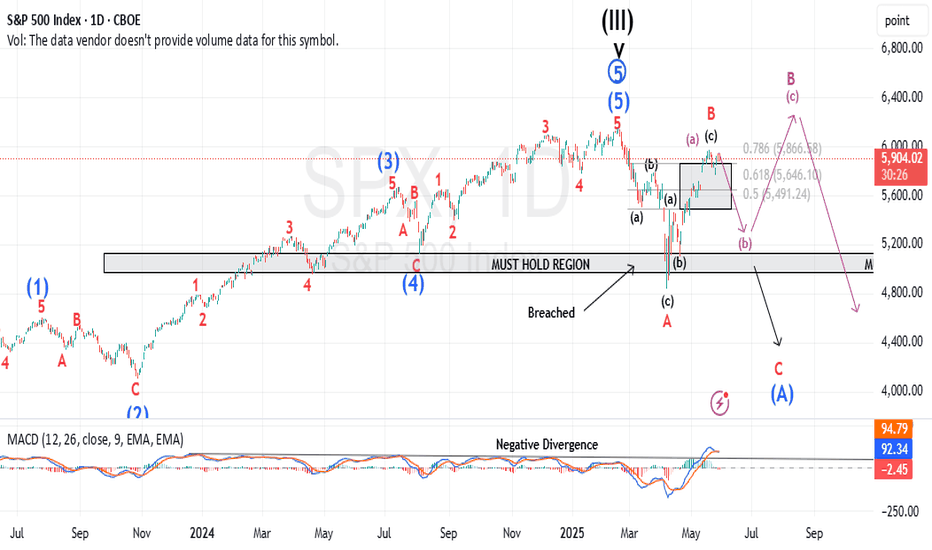
So far, our minor B wave price action has not thrown us any curveballs, which is somewhat unusual considering B waves can become very complex. As I get into the micro price action, this pattern would fit better completed with at least one more high. Nonetheless, I will offer a warning, we are in the target box...if you are long, please use stops, and make sure your position size is risk managed. Best to all, Chris
maikisch
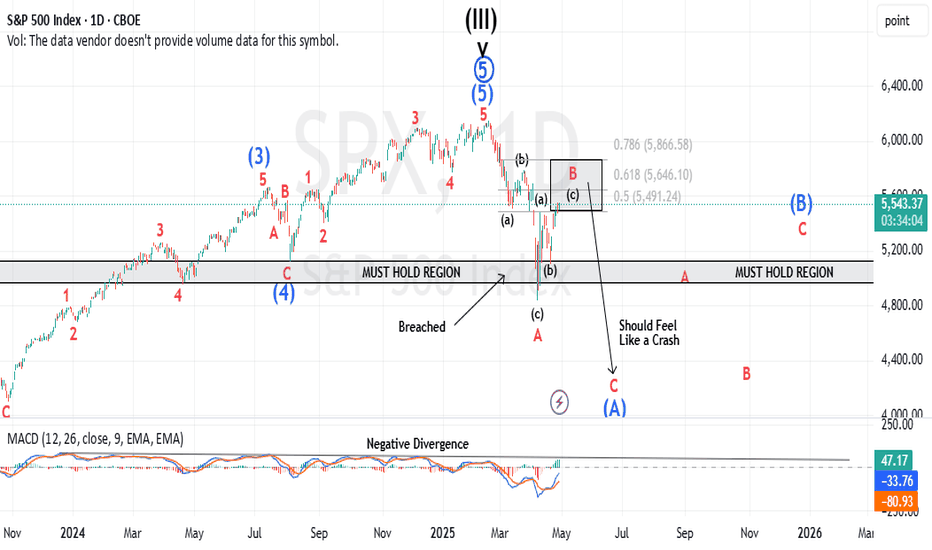
As per the individual stocks I cover that have not yet reached their ideal retracement areas I am looking for the SPX to get higher into my target box. In any event it's reasonable for me to say we're in a B wave and therefore our pattern can develop into something more complex. Nonetheless, I am mainly looking for MACD to reach the zero line at the very minimum. The take-a-way from this update is I am looking slightly higher in the markets for slightly longer...before our minor C wave takes hold of the market. Best to all. Chris
Disclaimer
Any content and materials included in Sahmeto's website and official communication channels are a compilation of personal opinions and analyses and are not binding. They do not constitute any recommendation for buying, selling, entering or exiting the stock market and cryptocurrency market. Also, all news and analyses included in the website and channels are merely republished information from official and unofficial domestic and foreign sources, and it is obvious that users of the said content are responsible for following up and ensuring the authenticity and accuracy of the materials. Therefore, while disclaiming responsibility, it is declared that the responsibility for any decision-making, action, and potential profit and loss in the capital market and cryptocurrency market lies with the trader.