
kzenbel
@t_kzenbel

What symbols does the trader recommend buying?
Purchase History
پیام های تریدر
Filter
Signal Type
kzenbel

با بررسی نمودار روزانه LTCUSD، مشاهده میشود که حرکات قیمت بالای ناحیه حمایتی ادامه دارد. تا زمانی که سطح 81.95 شکسته نشود، ارزیابی میشود که در صورت حرکت قیمت بالاتر از سطح 89.70، میتواند با عبور از سطح 147.35، سطح 228.20 را هدف قرار دهد.
kzenbel

بر اساس بررسی نمودار هفتگی جفت ارز ADAUSD، مشاهده میشود که حرکات قیمت در حال ادامه با شکلگیری یک الگو فنجان بالای ناحیه حمایتی است. تا زمانی که سطح ۰.۵۱۰۴ برای این ارز دیجیتال شکسته نشود، انتظار میرود که حرکات قیمت با عبور از سطح ۰.۷۴۳۳، ابتدا سطح ۱.۴۶۵۳ را هدف قرار داده و سپس به سمت سطح ۲.۲۳۹۸ پیش رود.
kzenbel
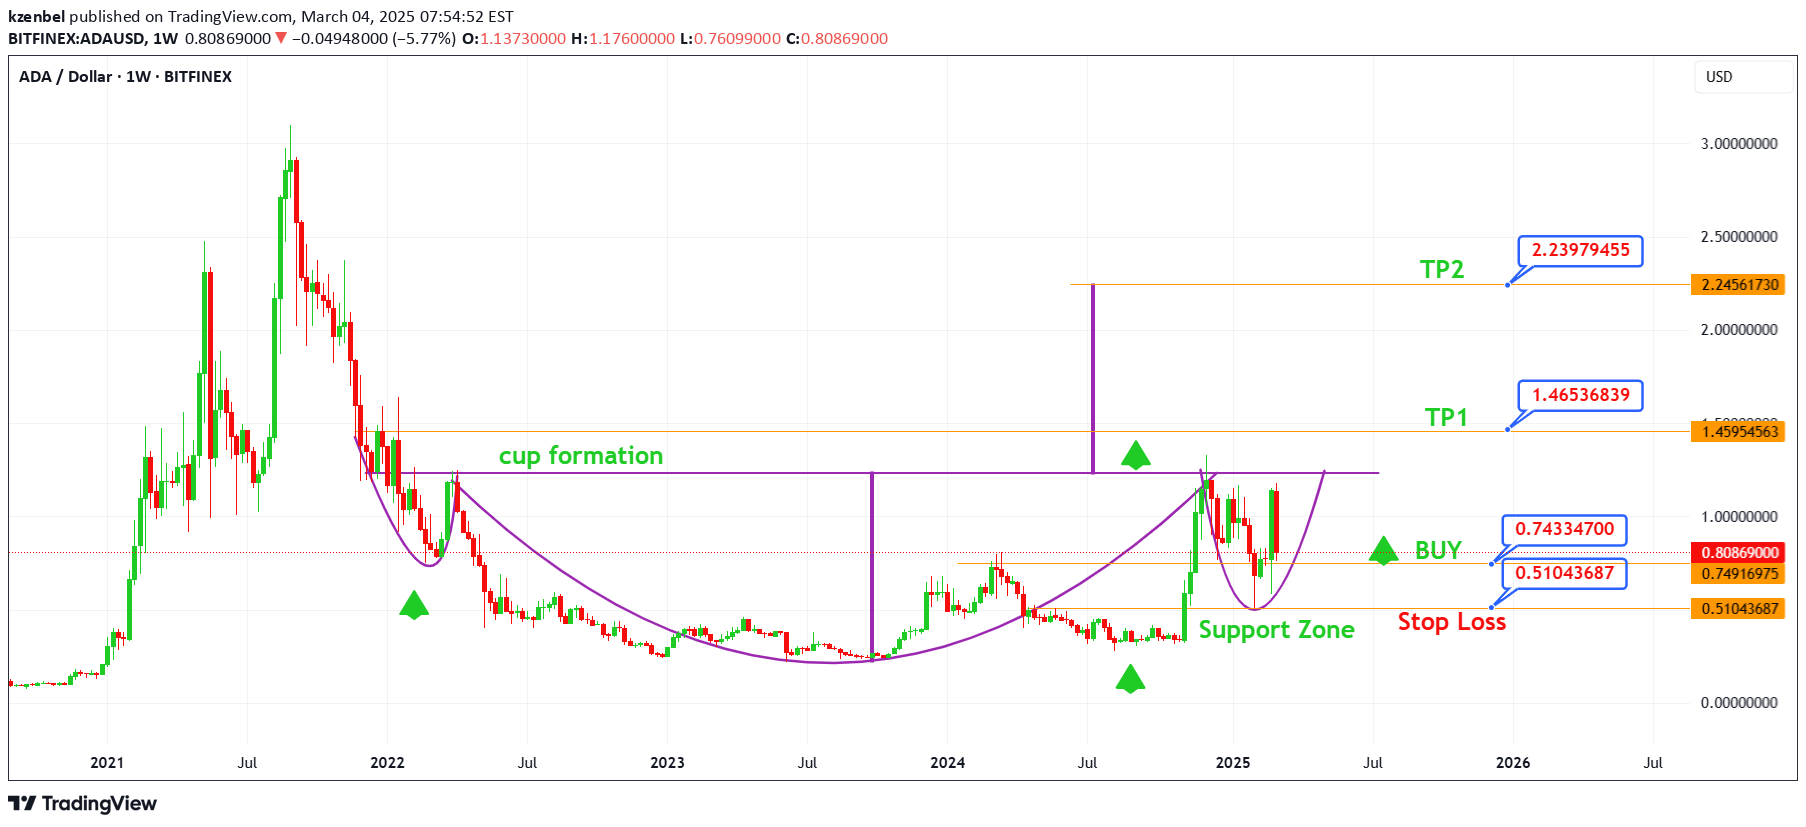
When the ADAUSD weekly chart is examined; It is observed that the price movements continue with the formation of a cup above the support zone. As long as the crypto's 0.5104 level is not broken down, it is evaluated that the price movements above the 0.7433 level can exceed the 1.4653 level and target the 2.2398 level.
kzenbel

با بررسی نمودار هفتگی ADAUSD، مشاهده میشود که حرکات قیمت با تشکیل یک الگوی فنجان بر روی ناحیه حمایتی ادامه دارد. تا زمانی که سطح 0.5104 شکسته نشود، ارزیابی میشود که قیمت میتواند با عبور از سطح 0.7433 و سپس عبور از سطح 1.4653، سطح 2.2398 را به عنوان هدف خود قرار دهد.
kzenbel

When examining the weekly graph of the BTCUSD pair; We note that price movements continue over the support area by forming the cup. As long as the 67,000 level of the encoded currency is not broken, price movements are expected to exceed 74000 level of 109590 and target the level of 130750.
kzenbel

When the BTCUSD weekly chart is examined; It is observed that the price movements continue above the support zone with a cup formation. As long as the crypto's 67000 level is not broken down, it is evaluated that the price movements above the 74000 level can exceed the 109590 level and target the 130750 level.
kzenbel

When BTCUSD is examined; It is observed that price movements continue with the formation of bowls on the support zone. Unless the 67000 level of the crypton is broken down, it is considered that the price movements over 74000 levels can go up to 109590 and make the target of 130750 level.
kzenbel

When examining the chart for four hours for the gold pair against the US dollar; We note that price movements continue below the resistance area. As long as the price of an ounce of gold cannot exceed the level of 2927, it is expected that price movements below the level of 2907 will break the level of 2860 and decline to the level of 2820.
kzenbel

When the XAUUSD 4-hour chart is examined; It is observed that price movements continue below the resistance zone. As long as the Gold Ounce price cannot exceed the 2927 level, it is evaluated that the price movements below the 2907 level may break the 2860 level and retreat to the 2820 level.
kzenbel

When the XAUUSD 4 -hour graph is examined; It is observed that price movements continue below the resistance zone. Unless the 2927 level of gold ounce price can be moved up, it is considered that the price movements below the 2907 level can be reduced to 2820 levels by breaking the level of 2860.
Disclaimer
Any content and materials included in Sahmeto's website and official communication channels are a compilation of personal opinions and analyses and are not binding. They do not constitute any recommendation for buying, selling, entering or exiting the stock market and cryptocurrency market. Also, all news and analyses included in the website and channels are merely republished information from official and unofficial domestic and foreign sources, and it is obvious that users of the said content are responsible for following up and ensuring the authenticity and accuracy of the materials. Therefore, while disclaiming responsibility, it is declared that the responsibility for any decision-making, action, and potential profit and loss in the capital market and cryptocurrency market lies with the trader.