
jokenakrub7
@t_jokenakrub7

What symbols does the trader recommend buying?
Purchase History
پیام های تریدر
Filter
Extension Wave 5

The extension wave 5 will run to its maximum at 138.2% and most likely end at 100-123.6%. Therefore, wave 3 will move to 2,075.135 to target wave 5, according to the chart.
Review modify wave

Gold is doing the expansion wave (V) of ⓒ of 5, alternating with the short wave (III). For the expansion wave 5, it should end around 114.6%, the expansion wave (V) ends between 100-114.6%, which should be consistent with the expansion wave ➄, which should end between 61.8-100%.
Wave III may have ended and is now in the process of wave IV.

Gold may be in the process of wave IV in a Flat or Triangle pattern with an interesting retracement target of 38% as shown in the chart.
End of wave (iv .

Wave ⚪iv retraces shallowly at 23.6% and now the graph is making wave ⚪v with a target fibo extension of 50 - 66.7%. However, if wave ⚪iv does not end, it may make an expanded flat pattern to grab liquidity before making wave ⚪v.
Enter D1 supply

The chart enters the supply zone and hits the resistance and if it goes back down below the red ema line and there is a divergence from Macd, open a short by tp at Choch.
Wave (4)

The retracing wave could elongated flat A B C down 50%-60%. Along the way there could be a fake TL at 23.6%, a fake S/R flip at 38.2%, a fake W pattern at 50% before bouncing back.
The path of the wave

when wave (1) ends, gold will bounce up again to make wave (2) or make ATH. However, if wave (2) ends, it will find a time to open sell.
Wait for the momentum to return up

The Macd signal in TF 4H is above zero and is still bullish, so it is still waiting for bullish momentum to return along with an input signal from stochatic rsi. However, it could be a pullback to continue down.
During the sideways period
Gold ran between the 2012-2064 price range and is currently in an uptrend, so expect a bullish bar to break through the 2040 sub-resistance level and retest down to sweep sub-liquidity before continuing.
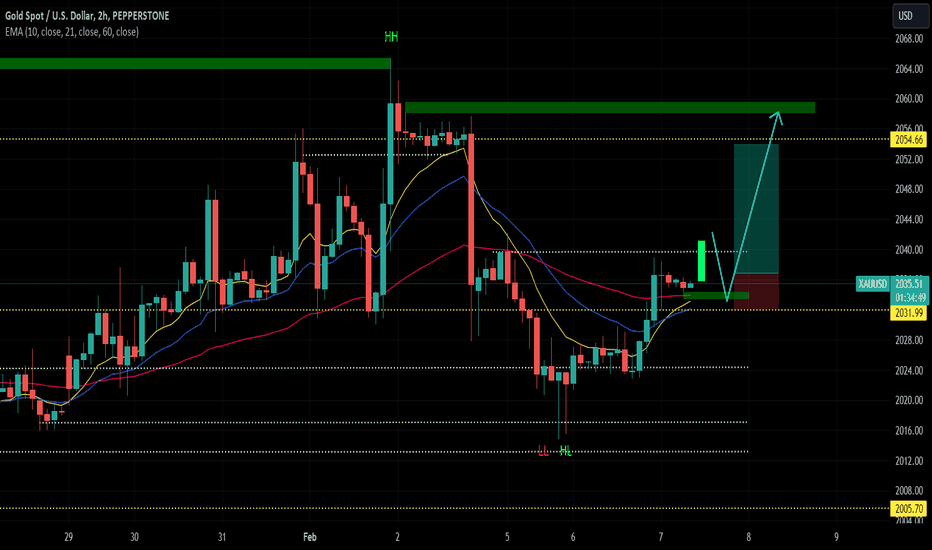
Sideway is in the killing zone

At TF 2H the killing zone begins to appear, so wait for the momentum bars to confirm whether it will go up or down. But overall, the graph has broken the trend but there is still selling pressure.
Disclaimer
Any content and materials included in Sahmeto's website and official communication channels are a compilation of personal opinions and analyses and are not binding. They do not constitute any recommendation for buying, selling, entering or exiting the stock market and cryptocurrency market. Also, all news and analyses included in the website and channels are merely republished information from official and unofficial domestic and foreign sources, and it is obvious that users of the said content are responsible for following up and ensuring the authenticity and accuracy of the materials. Therefore, while disclaiming responsibility, it is declared that the responsibility for any decision-making, action, and potential profit and loss in the capital market and cryptocurrency market lies with the trader.