
jamesibartram
@t_jamesibartram

What symbols does the trader recommend buying?
Purchase History
پیام های تریدر
Filter
jamesibartram
پیشبینی طلا (XAU/USD): آماده ریزش موقت پیش از جهش بزرگ؟ (تحلیل 4 ساعته)

☀️ GOLD – 4H Forecast ☀️ Alright gold gang, let’s talk business — XAU/USD is setting up for something clean 👇 🧠 Bias : Still bullish overall, but we’re chilling in premium territory, and this structure screams “pullback incoming.” Expect a retrace before the next rocket launch 🚀. 🧩 Technical Breakdown: Price just printed a Buy-Side Liquidity (BSL) grab up top — textbook liquidity sweep before a potential correction. We’ve got a strong impulsive leg pushing off a 4H + Daily demand confluence around $3,850–$3,880. The 71% fib retracement zone aligns beautifully with that 4H demand, creating a prime reload area if price dips. The volume profile gap (POI) also hints at untested liquidity sitting below current highs. 🎯 Trade Idea: Entry Zone: $3,880–$3,860 (4H & Daily demand overlap) Target 1: $3,970 (current high retest) Target 2: $4,010+ (continuation into new impulse) Invalidation: Below $3,830 (break of structure + demand failure) ⚙️ Risk Management: Keep risk tight — 1%–1.5% max. If we get a reaction at the 71% level, partials at $3,950 are smart to secure profits before the next leg. 💬 Summary : Gold just ran buy-side liquidity and looks ready to dip into discount before ripping higher again. If we get a clean 4H or 1H confirmation in the demand, expect another bullish leg to unfold.
jamesibartram
Gold - Wave 2 of 5 (1H Forecast)

🚀 Gold 1H Forecast – Wave 5 Loading? 🥇✨ Alright traders, let’s decode this chart 👇 🔭 Bigger Picture We’re cruising inside a clean ascending channel 📈. Wave count shows we’re gearing up for the final push (Wave 5) after a solid corrective move. Price just bounced off that 3,711–3,720 support pocket like a trampoline 🏀. 📉 The Pullback The corrective ABC move (a–b–c) tapped into demand perfectly. Liquidity trend got cleaned up — stops swept, weak hands shaken 😮💨. That bounce birthed sub-wave (i), with (ii) retracing right into support (chef’s kiss setup 👌). 🚀 The Next Impulse Expectation: (iii) blast up into the 3,850s zone 💥 Shallow (iv) pullback (quick snack stop 🍔) Then a final (v) rocket toward the 3,870–3,880 resistance 🎯. ⚡ Key Levels Support : 3,711 → hold this = liftoff. Resistance : 3,857–3,870 supply wall = Wave 5 target. If support cracks, deeper discount levels below 3,677 open up. 🕳 🎯 Play Idea Bias = Bullish (Wave 5 still in play). Look for entries on pullbacks above 3,711 support. Eye profit taking near 3,857–3,870 zone. 📌 Summary: Gold just reloaded at demand, structure screams Wave 5, and momentum’s cooking. Don’t chase green candles — let it dip, then ride the impulse 🚀.
jamesibartram
Gold - Quick Move!

⚡ GOLD – Quick Forecast ⚡ ⏱ 5M View (Lower TF) Price is riding an ascending channel, respecting both trendlines. Strong impulsive leg (yellow highlight) → market broke higher with momentum. Now consolidating just under the upper channel line, cooking for the next move. 🔑 Liquidity & Zones SSL (sell-side liquidity) marked below — prime magnet if price wants a quick dip. Confluence reload area: Fib 71% + Imbalance fill + SSL zone around 3770–3765. If tapped, buyers likely reload here for another rocket. 🎯 Play of the Day Hold current structure = direct push toward 3805–3810 🚀. Deeper retrace into SSL/71% zone = better entry for continuation long. Break below channel low? ❌ Idea cooked, bears reclaim flow. 📝 Forecast Summary 📍 Bias : Bullish (buy dips) 🎯 Target : 3805–3810 🪙 Reload Zone: 3765–3770 ❌ Invalidation : Break below channel low
jamesibartram
Gold Forecast (XAUUSD)

🟡 GOLD – 1H Breakdown Alright traders, here’s the scoop 👀 We’re chopping around mid-range after that last BOS. Liquidity is literally everywhere — BSLs chilling above the highs, SSLs hiding under the lows. Market’s teasing both sides like it’s fishing for stops 🎣. 🔑 Levels to Watch: Buy Zone 1 (Preferred snack stop): 3,600 – 3,620 🍫 Buy Zone 2 (Deeper dip special): 3,560 – 3,580 🥤 Trendline liquidity just waiting to get grabbed… you know how it goes 😏 Upside target: 3,700+ — where the big liquidity bags are stacked 🎯 🛠 Possible Plays: Quick liquidity sweep under the lows → tap into Buy Zone 1 or 2 → rocket launch 🚀 If demand fails, we’re diving into the swing range 3,530 – 3,550 for a bigger reload. 🔍 Outlook Short-term: Expect a cheeky stop-hunt under the lows. Mid-term: Bulls still in control, eyes on that juicy 3,700+ grab. Bias : Liquidity sweep down → Buy for continuation 📈✨
jamesibartram
Gold Trade Setup

🕰 Weekly Structure Gold is still holding a bullish tone overall, with higher-timeframe demand zones supporting the structure. Momentum favors continuation as long as demand levels are respected. 📉 Daily View Price recently broke structure (BOS) and confirmed buyers stepping in. The daily demand zone is aligned with the 4H block, adding confluence for bullish continuation. ⏱ 4H Breakdown Price tapped into 4H demand around 3660–3670. Clean rejection with a strong impulsive leg breaking above resistance. Swing range remains intact with liquidity swept below before the move higher. Upside target zone sits near 3730s, offering a solid risk-reward (around 1:6). 🔍 Outlook Short-term pullbacks into 4H demand (3660–3680) = potential buy entries. As long as demand holds, mid-term outlook remains bullish toward 3730+. Failure to hold demand would re-open downside back into the swing range (~3640–3620). Bias : ✅ Short-term pullback → Mid-term bullish continuation.
jamesibartram
Tesla - Forecast (Before and After)

🕰 Weekly View Price is holding above major support at 325–340 and pushing into weekly resistance around 420–440. The broader monthly trend points higher, with upside liquidity aligned toward the 500–520 zone. 📉 Daily Structure Resistance: 420–440 supply zone. Support: 325–340 demand zone, with a secondary base near 280. Price has broken from a wedge formation and is now testing overhead supply, with potential to retest support before continuation. ⏱ 8H Breakdown Tesla has been trending steadily upward off major support. Clean structure shows momentum building. A breakout and retest scenario could drive price toward 500+ targets, while failure at 420–440 could cause a pullback into 360–380 support. 🔎 Outlook Scenario 1 → Retest support (360–380) before continuation higher. Scenario 2 → Clean breakout above 440 accelerates into 500–520 zone. Bias : Bullish continuation → mid-term target 500+.
jamesibartram
Gold - Forecast 13/9

Weekly: Still bullish, but a demand zone sits lower with Imbalance at 3,400 – 3,450 if price pulls back. Daily: Price is in a rising channel, starting to slow down. Demand at 3,520 – 3,560. 4H: Rising wedge forming, liquidity swept at highs. Two areas of Imbalance refined from weekly. Best buy zone = 3,460 – 3,480. 🎯 Outlook Small pullback likely. If 3,460 – 3,480 holds → push back to 3,640 – 3,660. If not → deeper dip into 3,400 – 3,450 before continuing up. ⚖️ Bias: Short-term pullback → mid-term bullish. Follow for more
jamesibartram
Gold - Supply lined up for a sell

🏷 Bias: Bearish intraday setup Gold is pushing into a supply pocket, showing signs of exhaustion after the liquidity sweep. Expecting a fade lower before any larger buy zone reaction. 📊 Technical Breakdown Supply Zone: 3648 – 3652 acting as intraday resistance. Price Action: Clean rally into supply, forming lower highs. Projection: Likely rejection from current levels, targeting downside continuation. Buy Zone 1: Marked lower around 3610 – 3612 for potential bullish reversal interest. 🎯 Entry & Exit Zones Short Entry: 3646 – 3650 (supply zone test). Target 1: 3636 – 3632 (first demand pocket). Target 2: 3612 Buy Zone 1 (deeper liquidity grab). Reversal Opportunity: Strong reaction at Buy Zone 1 could give a fresh bullish leg.
jamesibartram
Gold - Sell positions are on the table for a short time

🟡 GOLD – Multi-Timeframe Breakdown 🔎 Bias: Bullish, waiting for retracement The higher-timeframe trend remains bullish, but price is showing signs of cooling off after tapping into supply. The focus is now on identifying optimal discount zones for continuation buys. 📅 Weekly View (W1) Strong break of structure (BOS) to the upside. Price created a new swing high above resistance. Expectation: pullback into swing range before continuation higher. 📊 Daily View (D1) Major resistance at 3,650 has held initially. Price is riding a bullish trendline with clean demand zones below. Daily demand at 3,500–3,520 remains valid for a deeper correction. ⏱ 8H View Price rejected major resistance and is now retracing. Sitting just above 3,600 support. Demand zones layered beneath, aligned with lower-TF confluence. ⏱ 1H View Clear 3-zone setup: Buy Zone 1 (Shallow) → 3,610 Buy Zone 2 (Preferred) → 3,590 (aligns with 71% retracement + demand) Buy Zone 3 (Deep) → 3,570 liquidity grab before reversal Current PA suggests sellers may push lower before buyers step in. 🎯 Trade Plan Wait for retracement into Buy Zone 2 (preferred level). Watch for bullish confirmation (candle reversal / liquidity sweep). Short-term target: retest 3,650 supply. Medium-term target: 3,700+ continuation if structure holds.
jamesibartram
Gold - A+ Trade Setup
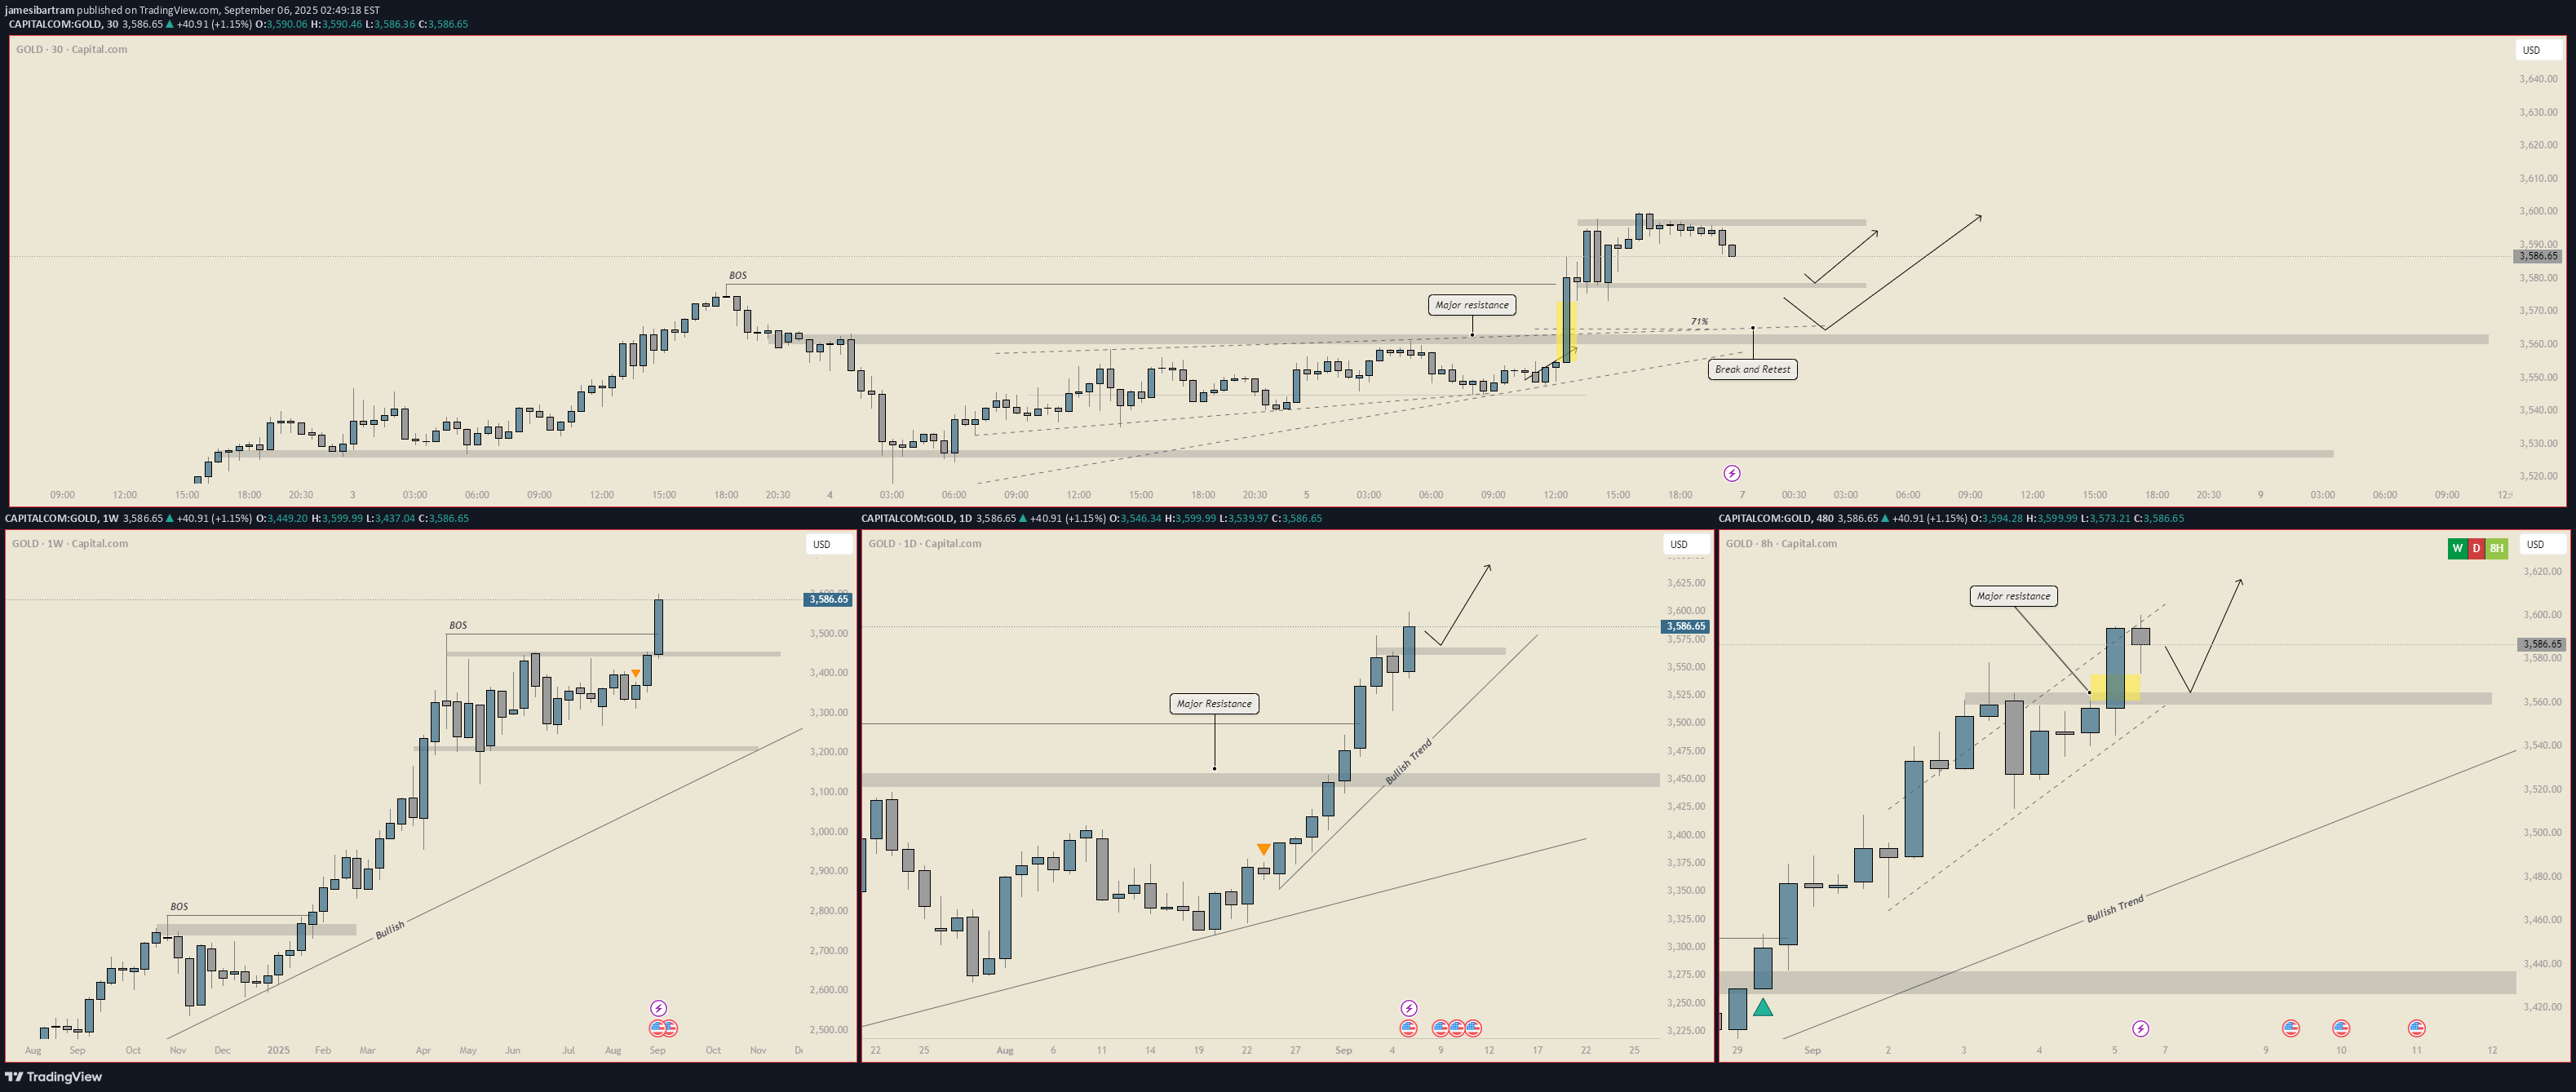
🔎 Weekly View (Macro Bias) Trend: Strong bullish trend intact with multiple BOS (Break of Structure) confirming upward continuation. Resistance: Price has cleared a prior major resistance near 3,400 and is pushing higher. Implication: Weekly bias remains bullish unless we see a sharp rejection back under 3,400 – 3,450 demand. 📉 Daily View (Intermediate Bias) Trend: Clear bullish structure with consistent higher highs and higher lows. Key Levels: Major Resistance: Broken at 3,100, now acting as historical support. Support Zone: Fresh daily demand sits around 3,450 – 3,500. Implication: As long as daily demand holds, expectation is for continuation into 3,600+. ⏱ 8H View (Execution Frame) Structure: Bullish channel still intact. Price broke above resistance and is holding well above 3,560–3,570 demand. Scenario: Possible retest of the 3,560 – 3,570 zone (aligned with bullish trendline) before continuation upward. Upside Target: 3,600 – 3,620 in the near-term. ⏱ 30M View (Fine-Tuned Entry) Recent Action: Price rallied sharply after clearing resistance and is now consolidating. Fib Level: The 71% retracement aligns with prior breakout structure near 3,570, offering a strong intraday buy zone. Plan: Intraday longs on retests into 3,570 – 3,580 with continuation toward 3,600 – 3,610. ✅ Trade Outlook Bias: Bullish on all timeframes. Setup: Buy retracements into 3,570 – 3,580 (30M / 8H demand). Hold for continuation into 3,600 – 3,620 near-term. Invalidation: Clean break below 3,550 (trendline + demand zone) would suggest a deeper pullback toward 3,450 – 3,500.
Disclaimer
Any content and materials included in Sahmeto's website and official communication channels are a compilation of personal opinions and analyses and are not binding. They do not constitute any recommendation for buying, selling, entering or exiting the stock market and cryptocurrency market. Also, all news and analyses included in the website and channels are merely republished information from official and unofficial domestic and foreign sources, and it is obvious that users of the said content are responsible for following up and ensuring the authenticity and accuracy of the materials. Therefore, while disclaiming responsibility, it is declared that the responsibility for any decision-making, action, and potential profit and loss in the capital market and cryptocurrency market lies with the trader.