
hmaroudas
@t_hmaroudas

What symbols does the trader recommend buying?
Purchase History
پیام های تریدر
Filter
Signal Type
hmaroudas
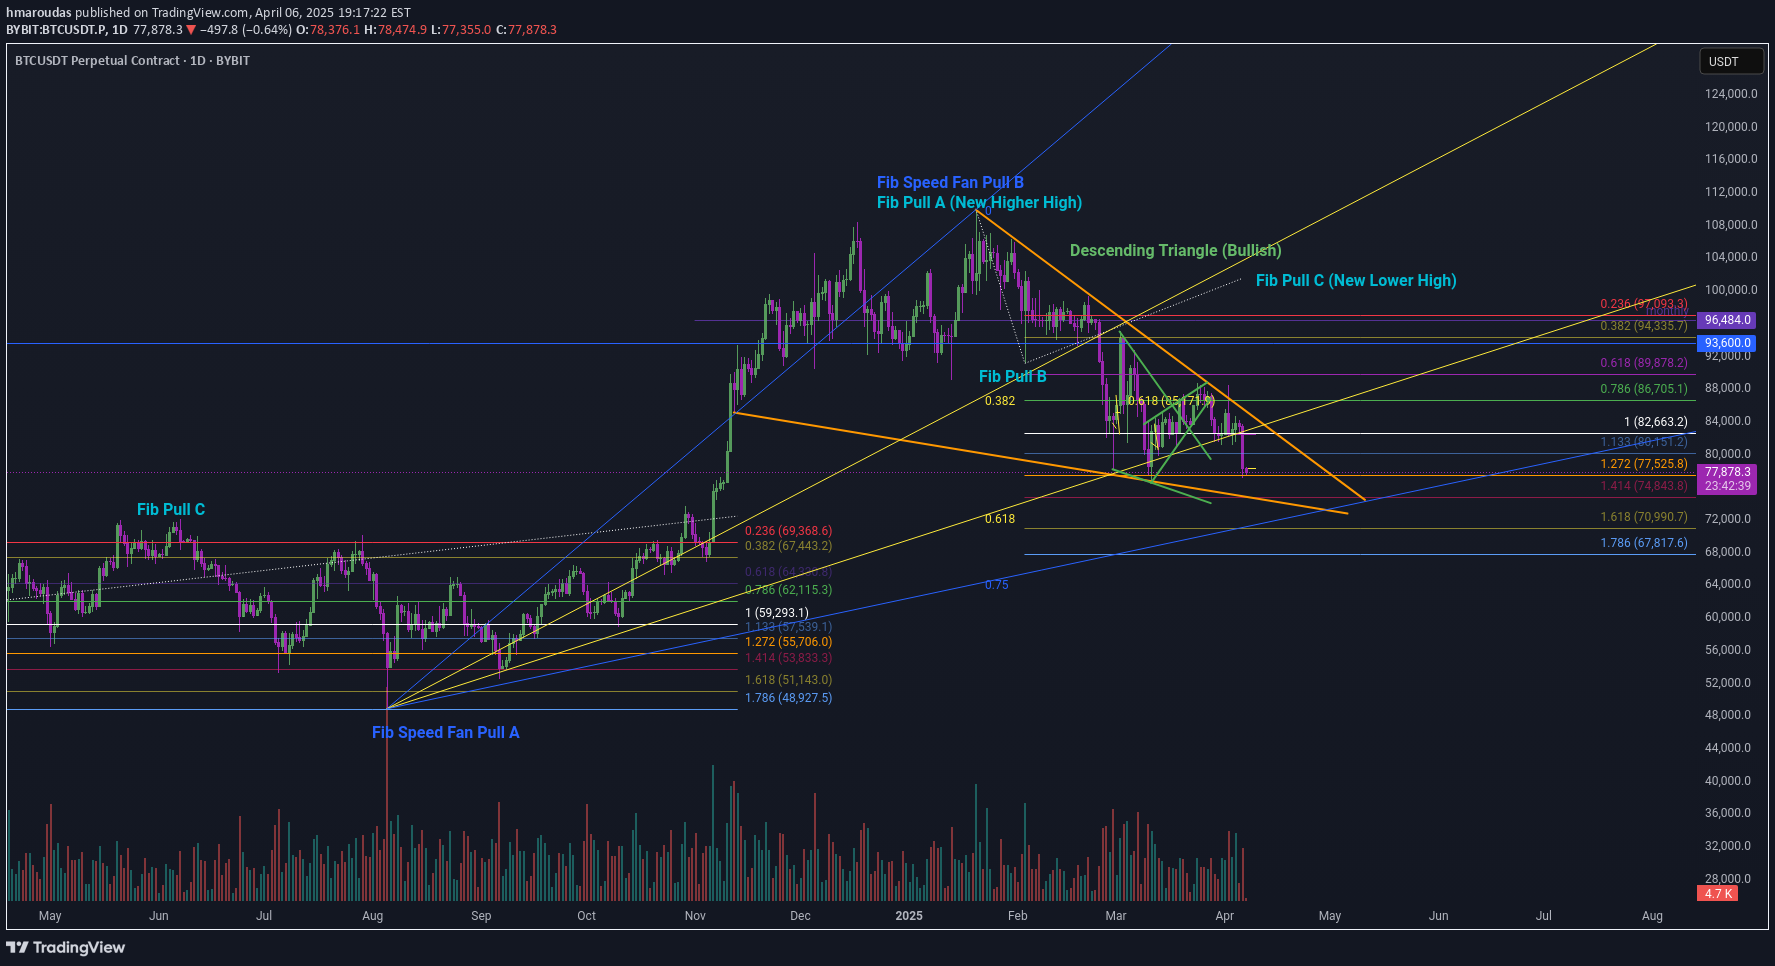
Fib retracement low high low previous vs now. Descending triangle, maybe a fakeout on the 1.618, technically looking good for a swing up. Just an idea but trend looks good for the upside in my opinion
hmaroudas

Trying to keep this clean and not had much time to study the theory exactly! What's drawing me to this pattern the most is the trend lines (brown/orange) IF, 1,2,3,4,5 (Blue)and we've hit wave 5 already. We're very much in the corrective phase (Green). B to C I've drawn the fib highest high to the lowest low (This is trading logic, not sure this is how waves are measured for correctve waves). Just to provide an idea given so much uncertainty in the market. :) Need more time to check the technicals, for me this is a good start. If I had to commit, and I will. Nothing to me at the moment looks bearish! That's my point of view. Just not spot on yet!
hmaroudas

Lets have some fun! Ok, A B C - Fib channel pulled from A to B to C. Flat parallel channel pulled from the obvious range high to low. Dotted white line 0.5 (mid way). Standard fibs: 0.383 to 0.618 resistance. Look back. -> What was resistance now will = support and visa versa. And Current 0.236 seems we've broken out and up so taking it as breaking a level of resistance into an uptrend! And parallel channel 0.5, were above... Fib based channel I learned from Chart Champions. <3 Just an idea.Too short term time frame for Fib Channel. Eh maybe something can be taken from this if performing some analysis. Let me know if you find anything but I think ultimately , fib channels work better on larger time frames. Update on larger time frame:
hmaroudas

Good luck seeing this level again :) This is my kiss you goodbye level. I've had this level drawn for some time now and it's been so well respected! This contradicts my Eliot Wave theory being the 4th wave but this level is awesome! Maybe emotional but, this level is key! Lose it then yes probably more downside. As long as were above, were kicking ass! To the upside!Update on larger time frame:
hmaroudas

Here mini range .. Elliot 12345 perfect 1:1 extension drawn from 1 to 2 to 3 .. (MAX) 1.272 .. before upward momentum. My technical! Dump before a pump :)0.00000703 Massive support! Trust me, I'm a doctor! :DUpdate on larger time frame:
hmaroudas
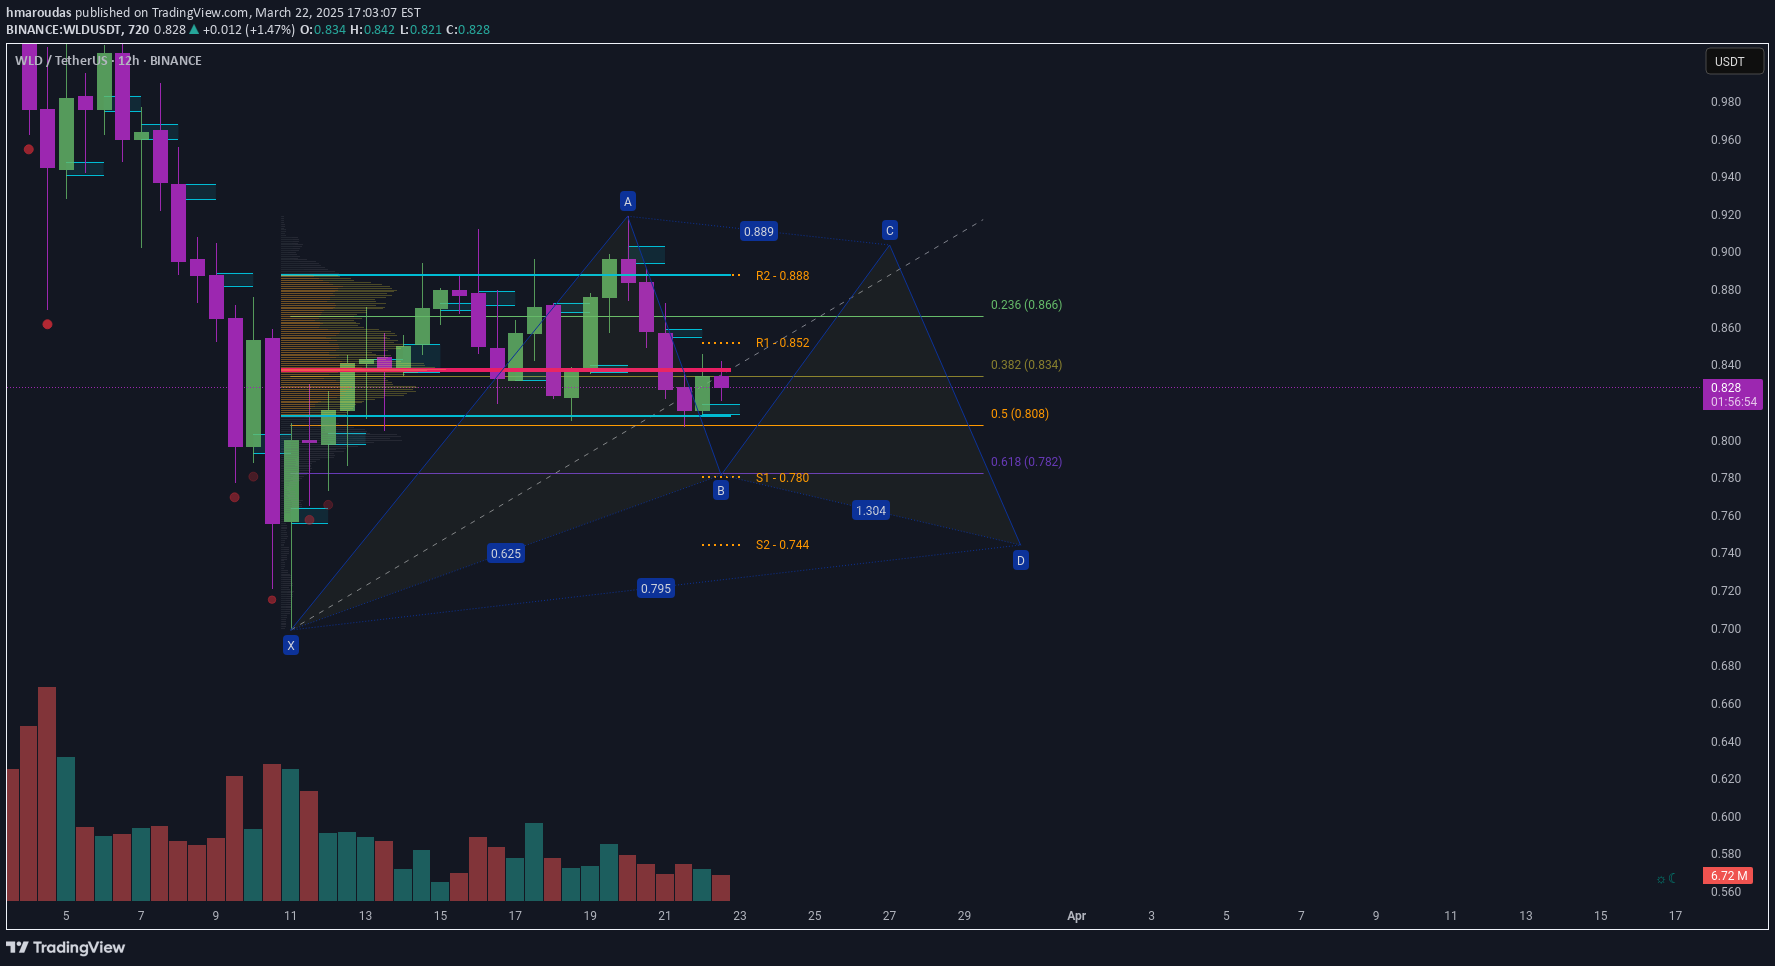
Please see fibs based from low to high gives you 0.618 at the ATR S1. Gartley can retrace up to 0.382 to 0.618. Best case drawn to 0.888 a daily at that level, to retrace back down to 0.782. Very rough analysis based on a post. Given the current Fixed Range Volume looks broken (:D) I'm taking this approach. Have to say, Chart Champions - Daniel. Not sponsored and genuine awesome traders. Love them! Check them out. I'm an absolute novice. Still and always will be learning. But Chart Champions are AWESOME! I LOVE THEM!
hmaroudas

I'll probably get told of for a lack of detail here. But this my friends, is a deadly bullish combo. Already bounced of 0.618, and coming back for the 0.618 on a POC for confluence. I'm not guaranteeing this is bullish, BUT watch for the reaction of the 0.618 again! If we get a good reaction. Super bullish to cover my previous chart resistance levels. Have to say, Chart Champions - Daniel. Not sponsored and genuine awesome traders. Love them! Check them out. I'm an absolute novice. Still and always will be learning. But Chart Champions are AWESOME! I LOVE THEM!
hmaroudas

Example on example: One to keep an eye on is that 1st one on the left - Ascending. Why at the moment it's not a threat? Because the asset has put in a higher high. (What I think). The current trend is, higher high, higher low higher high, higher low. Seems that's being protected. So, interesting! I think if we loose this market structure, well at least I will look back at that ascending triangle low as a range low. At the moment, theres no reason to think that. Just keep that in mind. Follow up to:Hey dudes, hit our big resistance! Yeahh! Looking for a retest and lets see if we can hit that 0.5 price 0.00001315 ... Yeahh! Pump it baby :D We knew that the white line Anchored VWAP was a big one, and top of the channel. Breaking that = mega momentum to the upside.. YeahhGetting too complicated! Needs revising: Update on larger time frame:
hmaroudas

Using indicator - Market Order Bubbles by Laviathan Firstly awesome indicator! Love it for guaging high volume buying and selling (used for panic selling or panic buying). The higher the volume the selling the bigger the red bubbles. Inversely, greedy buying, bigger green bubbles. Sometimes, the bubbles are genuine, as literally big sell offs or strong buys. So, a little strategy, using these bubbles with the trading 101's is very helpful. Here a decending triangle on a 5 minute. Mental sell off's. Trading the decending triangle using the seel offs as a guide to add confluence to the decending triangle. Just an example. Still a great guide to trading 101s. :) ig.com/en/trading-strategies/10-chart-patterns-every-trader-needs-to-know-190514 Couldnt publish on 5 minute. Put on a 5 minute time frame with Market Order Bubbles by Laviathan and you will see what I mean. Happy trading :)
hmaroudas

Eliiot Wave Update Firstly, I'm bias that I believe were in Wave 4. Depicted wave count 1 2 3 4 5 in orange may very well be as it is, in that the last low is 5. My bias comes in because from what I've read, 5th wave usually 1.27 fib extension drawn from 1 to 1 to 2. As can be seen, 1.272 is at 0.0000336. The green paralellel channel from the high to the next higher high. As can be seen with circle support, we found a good reaction to the upside. Short/medium term looking at the Anchored VWAP (White) and channel top as resistance. Currently 1.0 a strong support as well as resistance. My biase based wave theory means that were currently in the 4th wave to the upside, so looking at resitance EXACTLY at the anchored VWAP (white), breaking that to the upside targets of the short fibs drawn to the right that arent extended all the way to the right. Meaning, resistance being,0.382, 0.5, and 0.618. If that is the end of Wave 4. The price would then see a retracemment to Wave 5, to 1.272. Non bias view where Wave 5 has been hit already. Were in a corrective ABC pattern. (This is the part I'm not so sure about). Then Were in A(1) here no one knows how deep that is but it's good that were going up because A = up B = down and C = up (c or 3 being the longest waves. If were in the corrective phase, currently were in Wave A (1). Technically nothing changes. I think. Wait to see how It plays out. Overall, currently I would NOT be bearish, looking at the next resistance first!Which is (either Wave 4 or correction) 0.236 price 0.000095
Disclaimer
Any content and materials included in Sahmeto's website and official communication channels are a compilation of personal opinions and analyses and are not binding. They do not constitute any recommendation for buying, selling, entering or exiting the stock market and cryptocurrency market. Also, all news and analyses included in the website and channels are merely republished information from official and unofficial domestic and foreign sources, and it is obvious that users of the said content are responsible for following up and ensuring the authenticity and accuracy of the materials. Therefore, while disclaiming responsibility, it is declared that the responsibility for any decision-making, action, and potential profit and loss in the capital market and cryptocurrency market lies with the trader.