
hello9dean
@t_hello9dean

What symbols does the trader recommend buying?
Purchase History
پیام های تریدر
Filter
hello9dean
BTCUSDT 1H – Bearish Divergence + Liquidity Zone Below

🟧 BTCUSDT 1H – Bearish Divergence + Liquidity Zone Below 🧠 Market Context: Price pushed into new local highs but is now showing signs of exhaustion as RSI Bearish Divergence emerges — price made a higher high while RSI made a lower high. This often signals a potential pullback or local top. 🔍 Key Observations: Bearish Divergence on RSI (highlighted clearly) Price rejected after a sweep of recent highs High Volume Node (HVN) and liquidity zone forming below around $90,000–$88,000 Volume imbalance visible near 87K –$85k as possible reaccumulation areas 📊 Volume Profile Insights: Low participation above $94k – potential inefficiency POC (Point of Control) aligns near $90,594 Major buyer interest zones: $88,074, $86,132, and $85,165 🕐 Timeframe: 1H 📍 Exchange: Binance 🧭 Tools used: RSI, Volume Profile, Order Blocks, Market Structure
hello9dean
EIGEN/USDT Analysis (4H Chart)

📊 EIGEN/USDT Analysis (4H Chart) This chart illustrates a detailed technical setup on EIGEN/USDT with potential reversal zones and trade opportunities. Key highlights: Long setup: Look for entries around $3.23–$3.46 Target $6-$7
hello9dean
TIA LONG BREAKOUT

Trend Indicators: The Fisher indicator shows bullish momentum crossing into positive territory. Trend Meter confirms a strong uptrend with green dominance. Fibonacci Targets: 0.618 Extension: 9.15 1.0 Extension: 10.37 1.618 Extension: 12.34
hello9dean
WIFUSDT Good R:R to LONG

Trading Strategy: Short-term setup: Entry: $3.14 Target: $3.7, $4.0 Stop-loss: $2.75 Risk Management: Maintain strict stop-loss discipline given the medium risk profile of the current setup.
hello9dean
Pyth Network (PYT) Technical Analysis: Navigating the Waves on t

Introduction Pyth Network (PYT), a project aimed at providing high-fidelity financial data, shows an intriguing chart pattern and technical indicators that provide a mix of bullish and bearish signals. This analysis will dive deep into the current trends and potential future price movements of PYT/USDT based on the daily chart from TradingView. Technical Indicators and Patterns EMA Lines (20, 50, 100, 200): PYT's price is currently below all major Exponential Moving Averages (EMAs), signaling a bearish trend. The EMAs also provide resistance levels on potential upward movements. Elliott Wave Pattern: The chart suggests that PYT may have completed a typical Elliott Wave correction pattern, which could imply the start of a new upward movement if supported by volume and market sentiment. Fibonacci Retracement Levels: The Fibonacci retracement tool, applied from the peak to the trough of the recent major move, indicates several key levels to watch. The 0.382 level at approximately $0.8063 could act as the next major resistance, followed by the 0.618 level at $0.5879 which currently acts as a support. Volume Profile (Visible Range): The Volume Profile shows significant trading activity around the $0.50 mark, which might act as a strong psychological and technical support level going forward. RSI and SQZMOM Indicators: RSI (Relative Strength Index): The RSI is currently at 64.28, which is below the overbought threshold, suggesting there might be some room for upward price action before the asset becomes overbought. SQZMOM (Squeeze Momentum Indicator): This indicator shows an increase in momentum, depicted by the green bars, which could be indicative of a building bullish momentum. Market Structure The market structure shows PYT in a possible reversal setup after a prolonged downtrend. The key will be whether the price can sustain a breakout above the nearest Fibonacci resistance level at $0.8063. Price Prediction and Trading Strategy Short-Term Target: Traders might consider taking profits at around $0.5762 if the price appreciates from the current levels, as it is a significant short-term Fibonacci level. Long-Term Target: For longer-term holders, reaching and sustaining above the $0.8063 level could open up the path towards $1.2729, aligning with the upper Fibonacci extension levels. Conclusion The technical setup for PYT/USDT provides a cautiously optimistic outlook, with several indicators suggesting a potential reversal or at least a significant bounce. Traders should monitor volume and price action around key Fibonacci levels for confirmation of trend direction. Disclaimer: This analysis is for informational purposes only and should not be considered financial advice. Always conduct your own research and consult with a professional before making any investment decisions.
hello9dean
Litecoin (LTC) Technical Analysis: A Comprehensive Look at the 4
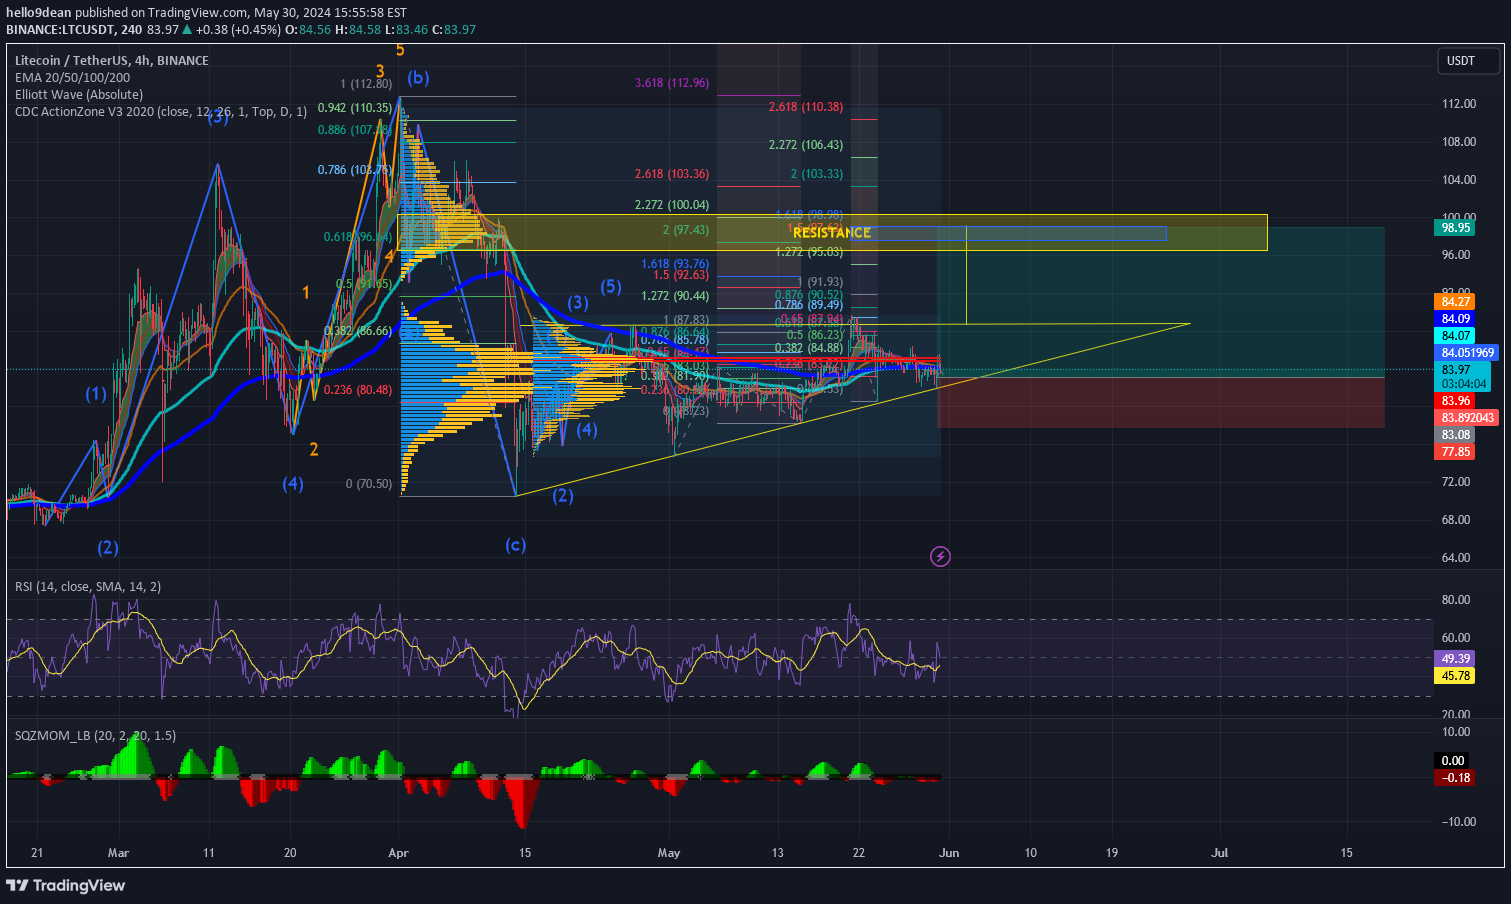
Litecoin (LTC) Technical Analysis: A Comprehensive Look at the 4-Hour Chart Introduction Litecoin has exhibited significant volatility, and the current technical setup suggests multiple trading scenarios. This analysis provides insights into the potential future movements of LTC against USDT, based on the latest data from Binance. Technical Indicators and Patterns EMA Lines (20, 50, 100, 200): The price of Litecoin is currently below the 200 EMA but above the shorter EMAs, indicating mixed signals. The 200 EMA acts as a resistance level, while the 50 and 100 EMAs provide some support below the current price. Elliott Wave Pattern: The chart illustrates a complex Elliott Wave pattern which suggests that Litecoin may be in the latter stages of its correction phase. The completion of this pattern could lead to a new impulse wave. Fibonacci Retracement Levels: The use of Fibonacci retracement levels from the recent high and low points shows significant resistance and support levels. Notably, the 0.618 retracement level near $91.93 may serve as a key resistance in the short term. Volume Profile (Visible Range): The volume profile highlights substantial trading activity around the $84-$85 price range, indicating a potential pivot area where price might consolidate before making a more definitive move. RSI and SQZMOM Indicators: RSI (Relative Strength Index): The RSI is hovering around 58, suggesting that there is room for upward movement before the asset becomes technically overbought. SQZMOM (Squeeze Momentum Indicator): This indicator shows that the momentum is currently neutral, with no immediate signs of a market squeeze. Market Structure The market structure shows Litecoin trading within a descending triangle pattern, suggesting a consolidation phase. A breakout or breakdown from this triangle could dictate the trend for the coming weeks. Price Prediction and Trading Strategy Short-Term: Traders should watch the $91.93 resistance level closely. A breakout above this level could lead to a test of the higher Fibonacci levels at around $103.36. Medium-Term: If the price breaks below the support at $83.08, it could trigger a bearish trend towards the $77.85 support zone. Conclusion This analysis indicates that Litecoin is at a critical juncture. Traders should employ a strategy based on the breakout of the current price consolidation pattern, keeping an eye on key technical indicators and market reactions to these levels. Disclaimer: This analysis is for informational purposes only and should not be considered financial advice. Always conduct your own research and consult with a professional before making any investment decisions.
hello9dean
STXUSD BUYZONE
STXUSD BUYZONE GrayScale Stack Trust are Ready Bullish on Stack

hello9dean
SHORT POSITION ETH FOR DAYTRADING

Fibo test back to 0.5 first and then ETH will breaking descending channelNFA Good luck I just back from vacation
hello9dean
MKRUSDT LONG POSTION

DXY is down trend for a middle term Crypto going up MKR are lagging Long is gonna happens NFA good luck
Disclaimer
Any content and materials included in Sahmeto's website and official communication channels are a compilation of personal opinions and analyses and are not binding. They do not constitute any recommendation for buying, selling, entering or exiting the stock market and cryptocurrency market. Also, all news and analyses included in the website and channels are merely republished information from official and unofficial domestic and foreign sources, and it is obvious that users of the said content are responsible for following up and ensuring the authenticity and accuracy of the materials. Therefore, while disclaiming responsibility, it is declared that the responsibility for any decision-making, action, and potential profit and loss in the capital market and cryptocurrency market lies with the trader.