
godshieldufford
@t_godshieldufford

What symbols does the trader recommend buying?
Purchase History
پیام های تریدر
Filter
godshieldufford
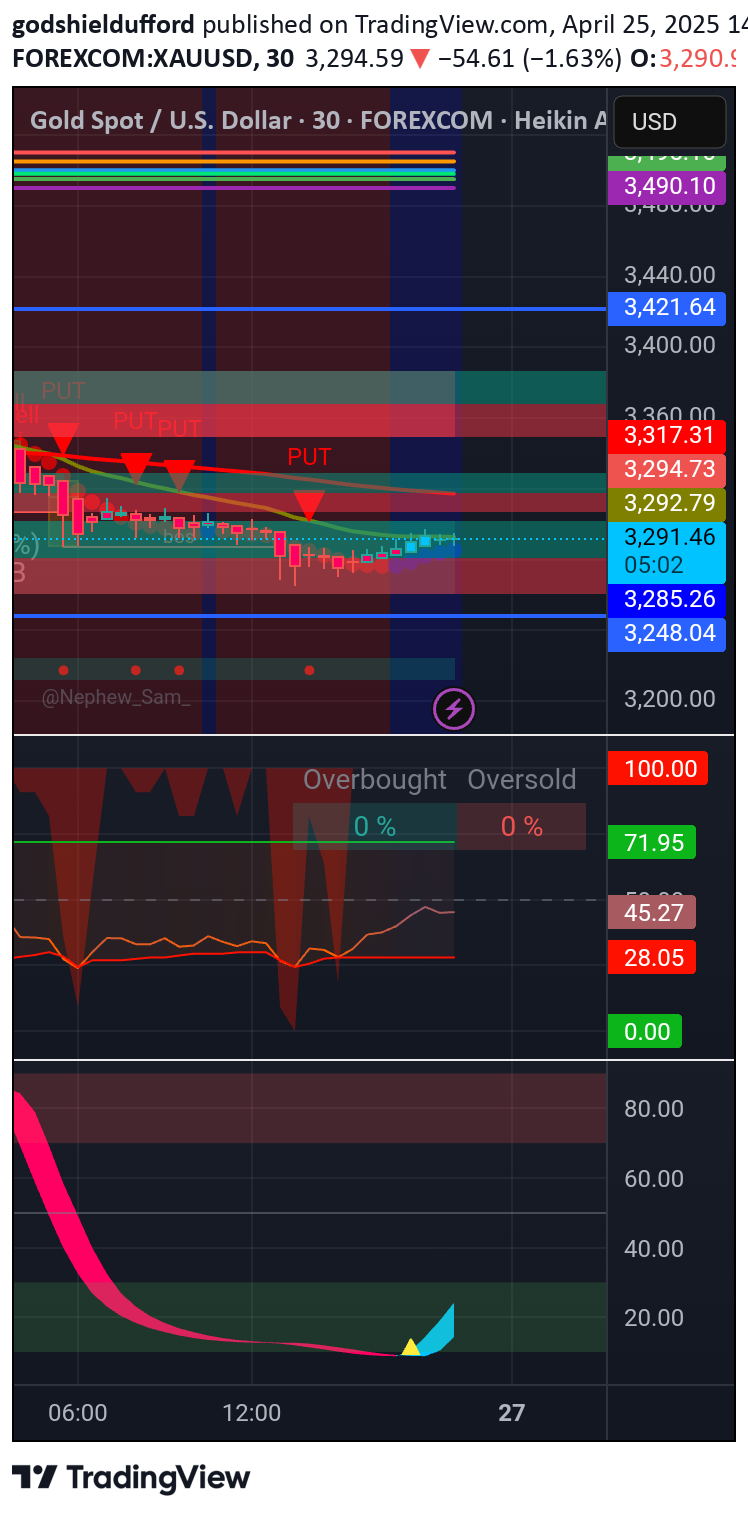
Next Steps and Market Outlook on Trading Gold

If buyers hold above $3,306.21 and break $3,306.98, I’ll look for $3,312.10 as my first take-profit, potentially extending to $3,319.05 if momentum builds. If price fails to break $3,306.98 and drops below $3,294.71, I’ll exit and flip back to a short, targeting $3,269.82, as I’ve noted in my earlier analyses this week. The market’s tricky with these liquidity grabsWhat do you think, fam? Was my buy at $3,308.16 a smart flip, or am I jumping the gun against the bearish trend? Drop your thoughts below—I’m curious to hear how you’d play this XAU/USD setup! If you’re one of the two ready to join me at Academia for Forex Trading, let’s talk—we’ll hunt these markets together. And while you’re at it, check out Icon Collections Store—does RiverSide, Desire, or Icoca vibe with your trading energy? Let me know!
godshieldufford
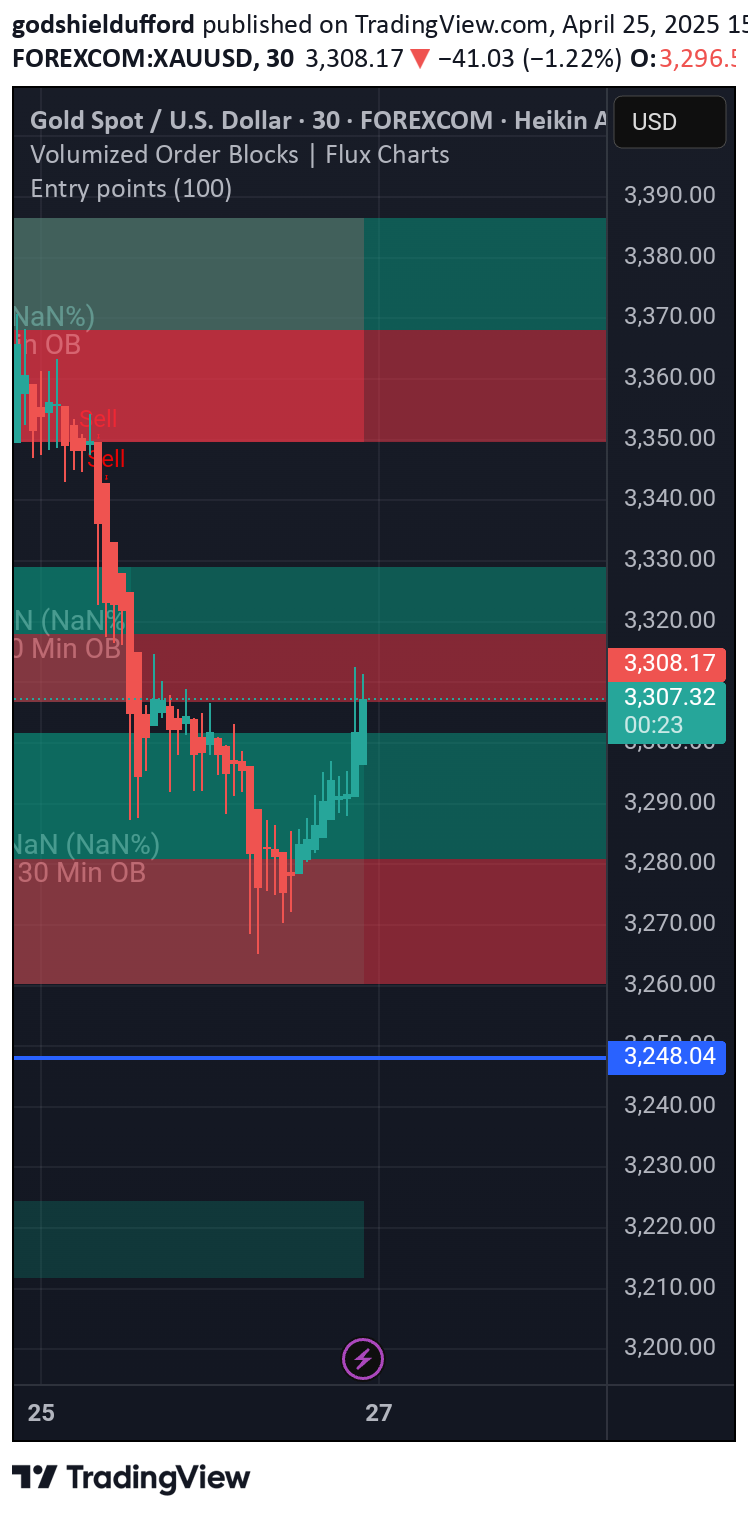
I Bought at $3,308.16, Gold Market
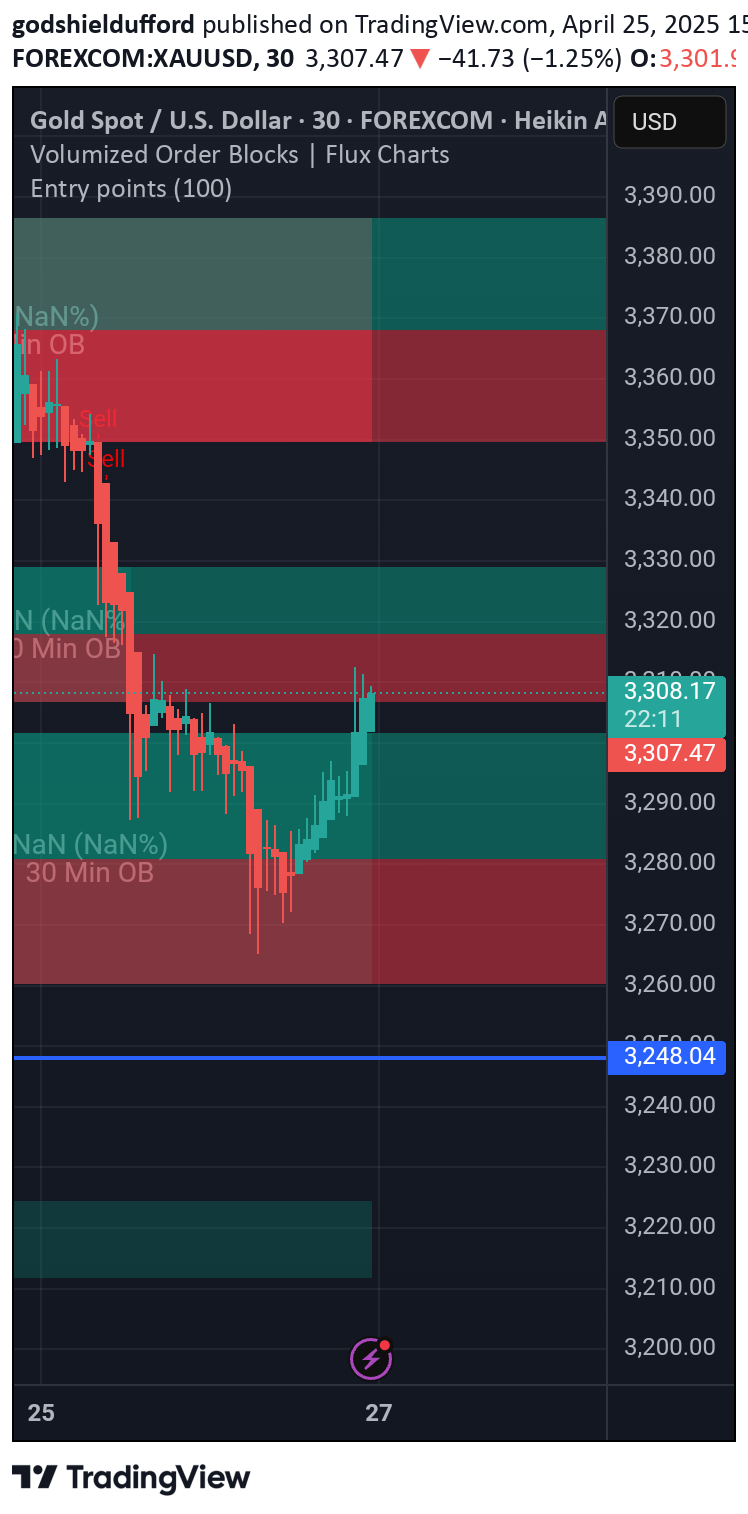
Hey fam, I’m back with an update on my XAU/USD M30 chart from April 25, 2025, at 09:19 PM WAT. I bought at $3,308.16 just now, after closing my earlier short at $3,305.69, and I’m here to break down my new trade setup for you. I’ve been hunting gold all week, balancing my trades with my passions like curating scents at Icon Collections Store, and I’m excited to share this move. Let’s analyze my buy, see how it aligns with my checklist, and make this interactive—grab a smoothie from Tastequest.com and let’s dive in!At 09:19 PM WAT, gold was at $3,306.52 (sell price) on the M30 chart, but I bought at $3,308.16, likely anticipating a bounce after the recent spike. Let’s recap the context: I had a short position at $3,305.69, targeting $3,294.71, with a stop-loss at $3,306.57. Gold spiked to $3,306.52, just 5 pips from my stop-loss, testing the bearish order block at $3,306.21. I suspected a liquidity grab by smart money, hunting stop-losses above the order block before resuming the downtrend. However, the spike to $3,306.52 and the failure to break above the previous high at $3,306.98 prompted me to close my short and flip to a buy at $3,308.16, expecting a potential reversal or short-term bounce.Let’s run through my checklist to see how this buy fits my criteria, which I’ve fine-tuned over six months:Harmonic Patterns: No clear XABCD structure is visible, but the spike to $3,306.52 and failure to break $3,306.98 suggest a potential reversal. This aligns with my past use of harmonic patterns, like the bearish shark I identified earlier this week, but now I’m looking for a bullish setup.Market Structure: The broader trend is still bearish—lower highs and lower lows since $3,499.99 on April 22. However, the spike to $3,306.52 and rejection at the $3,306.21 order block could indicate a short-term bullish move, possibly a liquidity grab setting up a bounce.Order Blocks: The bearish order block at $3,306.21 was retested, but the failure to drop immediately suggests buyers might be stepping in. I’m now looking for a bullish order block below, potentially around $3,294.71, where buyers defended earlier.Volume Profile: Not visible, but I’d expect high volume at $3,306.21, with a Fair Value Gap below near $3,294.71. A spike in volume on this bounce would confirm buying pressure.Top-Down Analysis: H4 and H1 are bearish, but M30 shows this spike as a potential reversal setup. M15 would confirm with a green Heikin Ashi candle if buyers take control.Heikin Ashi: Not visible, but I’d expect a green candle on M15 to confirm my buy. The green candle at $3,306.52 shows buying pressure, supporting my decision.Fibonacci: From the high at $3,306.98 to the low at $3,294.71, the 61.8% retracement is near $3,302.21, and the 78.6% is around $3,304.21. My buy at $3,308.16 is above the 100% Fib, suggesting I’m catching a potential breakout above the order block.Gann Theory: The descending trendline points to a target near $3,294.71 for bears, but a break above $3,306.98 could target $3,312.10, the next resistance on the chart.MACD and RSI: Not shown, but I’d expect MACD to show increasing momentum on this bounce, and RSI might be moving above 50, indicating a shift from bearish to neutral momentum.Risk Management: My buy at $3,308.16, stop-loss below the recent low at $3,294.71 (1345 pips risk), and take-profit at $3,312.10 (394 pips reward) gives a 1:0.3 reward ratio—lower than my usual 1:3, but I’m playing a short-term bounce. I might adjust this as the trade develops.Confirmation: I wait for all pieces to align. The failure to break $3,306.98, the retest of $3,306.21, and likely green Heikin Ashi on M15 are my signals for this buy.Trade Assessment: My buy at $3,308.16 is a bold move, as the broader trend remains bearish, but I’m playing a short-term bounce after the liquidity grab at $3,306.21. The failure to break above $3,306.98 and the buying pressure at $3,306.52 support my decision, but my risk-reward ratio is tight. I’ve flipped positions before—like when I targeted 20 pips on a 15-minute XAU/USD chart earlier this year—so I’m comfortable with quick adjustments. I’m targeting $3,312.10, the next resistance, but I’ll watch for a break above $3,306.98 to confirm this move. If price drops below $3,294.71, I’ll exit and reassess for a bearish setup. My system’s rated a ten out of ten, but I need to improve my timing, as I’ve entered early before, like on April 23 when I sold at $3,310 instead of $3,315.
godshieldufford
Saying No more stop losses

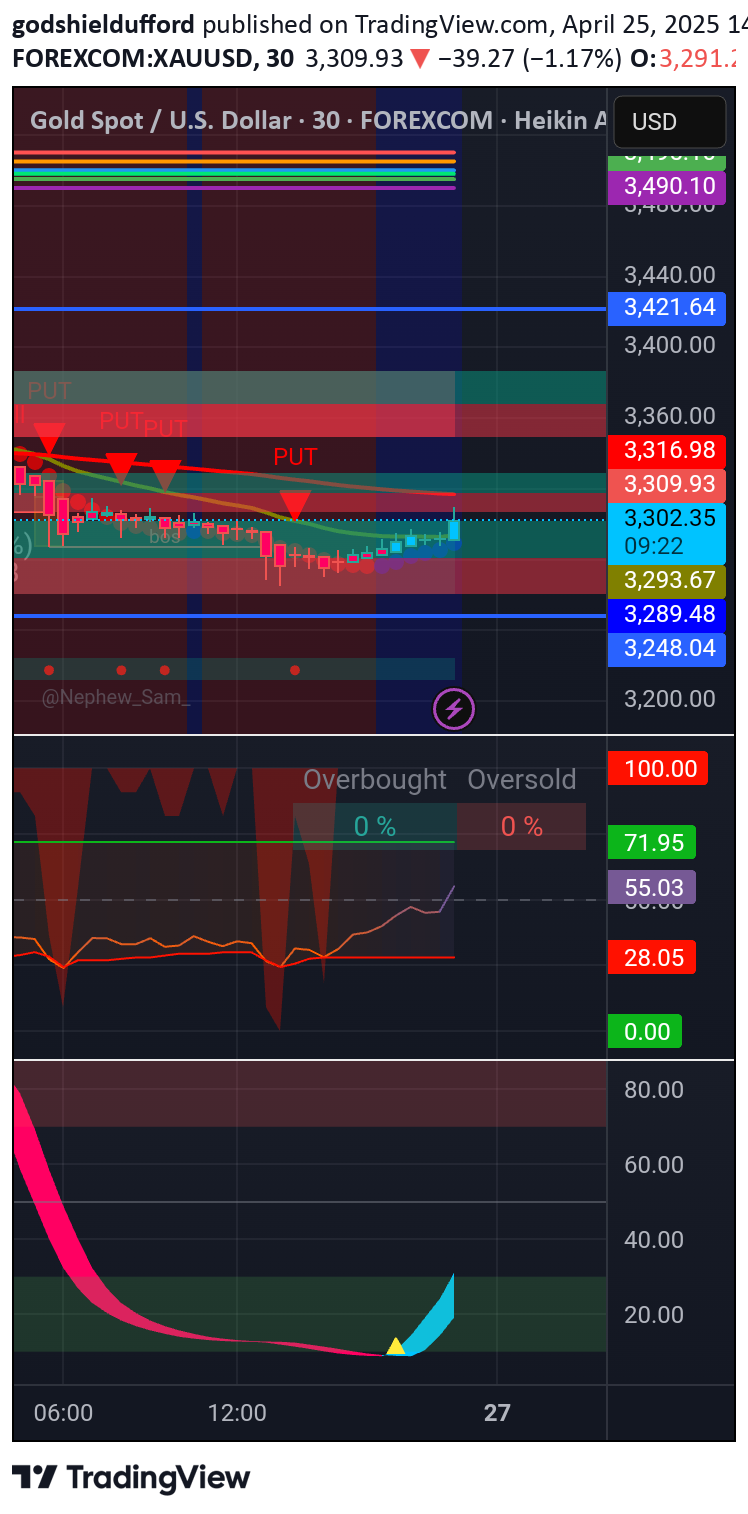
Trade Assessment: My short at $3,305.69 is under pressure with gold at $3,306.52, just 5 pips from my stop-loss. The spike to $3,306.52 looks like a liquidity grab, as smart money often hunts stop-losses above key levels like the $3,306.21 order block before resuming the downtrend. I’m holding the trade for now, as the broader bearish trend remains intact, and my target at $3,294.71 is still valid. However, if price breaks above $3,306.98 (the previous high), I’ll exit early to avoid a trend reversal. I’ve been refining this system for six months, and while it’s rated a ten out of ten, I’ve learned from past mistakes—like missing RSI signals on April 22 at $3,499.99—so I’m staying vigilant.
godshieldufford
Should I hold my short at $3,305.69, or exit now
Should I hold my short at $3,305.69, or exit nowWhat do you think, fam? Should I hold my short at $3,305.69, or exit now with gold so close to my stop-loss at $3,306.57? Drop your thoughts below—I’m curious to hear how you’d play this XAU/USD setup! If you’re one of the two ready to join me at Academia for Forex Trading, let’s talk—we’ll hunt these markets together. And while you’re at it, check out Icon Collections Store—does RiverSide, Desire, or Icoca vibe with your trading energy? Let me know!
godshieldufford
Godshield Icon Entries on Gold market
Hey fam, someone’s asking if I’m going short on the gold market right now or waiting for confirmation at $3,300, and I’m here to spill the tea on my XAU/USD M30 strategy. I’ve been hunting gold all week, balancing my trades with my passions like curating scents at Icon Collections Store, and I’m ready to dive into this setup. Let’s break it down with my checklist, share my thoughts, and make this interactive—grab a smoothie from Tastequest.com and let’s talk!
godshieldufford
Should I hold my short at $3,305.69, or exit now
What do you think, fam? Should I hold my short at $3,305.69, or exit now with gold so close to my stop-loss at $3,306.57? Drop your thoughts below—I’m curious to hear how you’d play this XAU/USD setup! If you’re one of the two ready to join me at Academia for Forex Trading, let’s talk—we’ll hunt these markets together. And while you’re at it, check out Icon Collections Store—does RiverSide, Desire, or Icoca vibe with your trading energy? Let me know!
godshieldufford
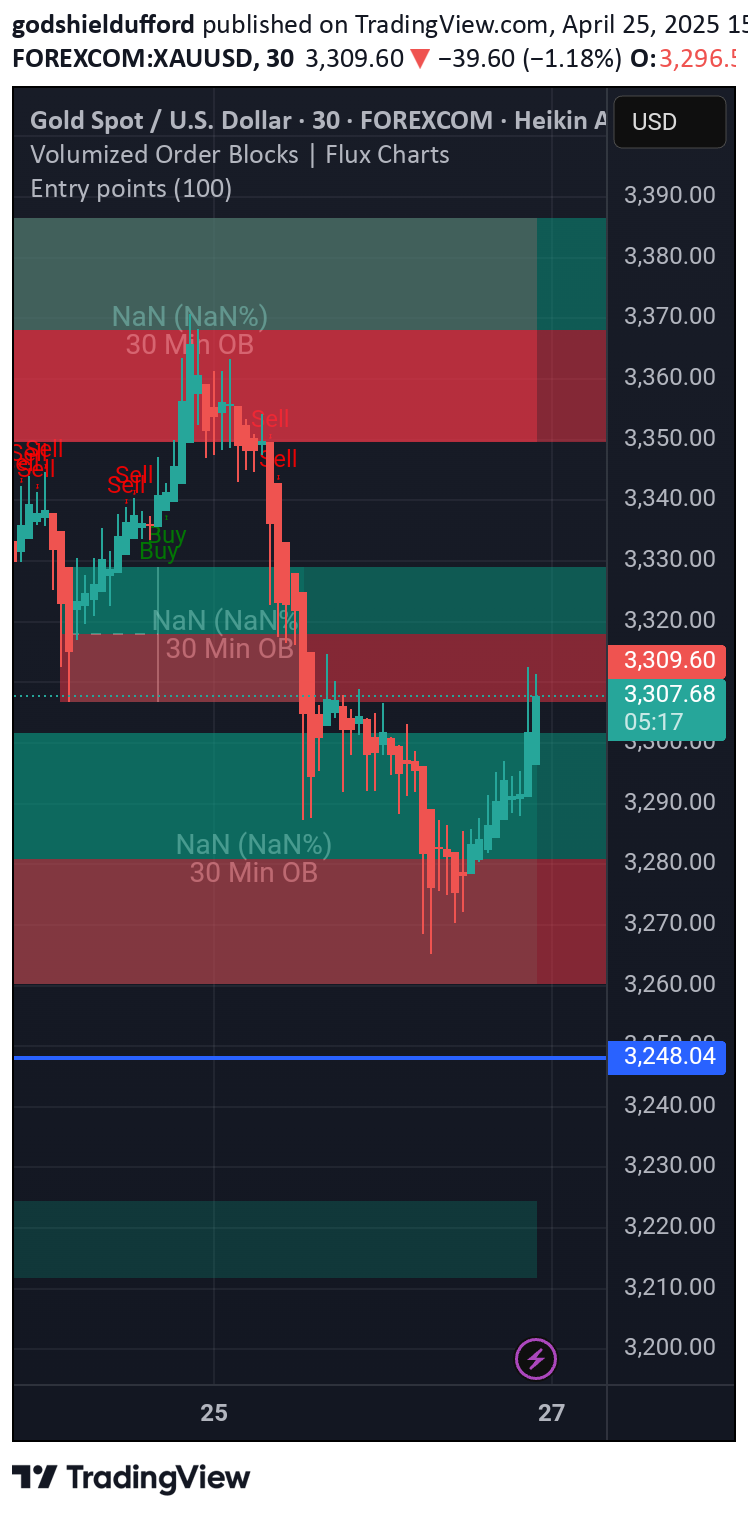
Gold and Chart Patterns
I’m dropping this XAU/USD M30 insight because my system’s a damn executioner, and you need to see how I hunt the market. This chart is a textbook of bearish patterns—first a bearish three drives showing smart money exhausting buyers with three weakening upward pushes, then a head and shoulders with the neckline break confirming the reversal, and now a bearish shark forming to seal the deal, all playing out within my descending trendlines. Smart money’s been in control from the start, distributing at the peaks, grabbing liquidity, and dumping price to hunt stop-losses below key levels. Supply and demand zones are my edge—supply at the right shoulder of the head and shoulders where sellers stacked orders before the break, demand near the lower trendline where buyers might step in, my target for this bearish move. My checklist operations are a predator’s playbook. I start with harmonic patterns, hunting XABCD structures like the bearish shark I’m seeing now, signaling smart money’s reversal zones. I confirm market structure, looking for breaks of structure to show trend shifts—here, the neckline break confirms bearish continuation. I identify order blocks, those consolidation zones where smart money stacks orders, like the bearish order block at the right shoulder where sellers distributed. Volume profile is key—I check for high volume nodes where price stalls, like the neckline where sellers defended, and low volume nodes that act as magnets, like gaps below the neckline. Top-down analysis keeps me sharp—four-hour timeframe sets the bearish trend, one-hour confirms the break, thirty-minute narrows the setup, fifteen-minute is my strike zone, waiting for a neckline retest. I use Heikin Ashi for confirmation—red candles mean sell, waiting for red on the fifteen-minute at the retest. Fibonacci levels mark my targets—I focus on key extensions to set exits, like targeting the lower trendline of the channel. Gann theory adds confluence—I look for angles or retracements to align with my setups, like a Gann angle pointing to the lower trendline. MACD and RSI measure momentum—MACD’s bearish crossover and negative histogram confirm the downtrend, RSI below fifty with bearish divergence at the right shoulder seals it. Risk management is my law—I risk small to win big, stop-loss above the right shoulder, take-profit at the lower trendline, aiming for a high reward ratio. I monitor news and liquidity traps—fake spikes above the neckline are smart money’s tricks, so I stay sharp. I wait for confirmation—every piece aligns, or I walk, then I document to keep my edge razor-sharp. I’m rating this system a ten out of ten—harmonic patterns, Smart Money Concepts, volume profile, top-down analysis, and now MACD and RSI for momentum make it untouchable. I’ve fine-tuned this over six months, backtesting until it’s a weapon. I need two of you to join me at Academia—let’s hunt together.DYORShieldsmine Diaries
godshieldufford
Shieldsmine Vlog

Alright, mate, let’s break down this EUR/USD H4 setup across these platforms—TradingView and MetaTrader—like we’re sittin’ at the desk, charts up, coffee in hand. We’ve got a solid uptrend from early April, but the pair’s hittin’ a wall around that 1.14200–1.14290 zone as of April 16-18, 2025. Let’s dive in.Price action’s been clean on both charts. We’ve rallied hard from 1.09480 on April 4, smashed through resistance levels like a hot knife through butter, and now we’re at 1.14039 on TradingView with a tight 0.03 pip spread—sell at 1.14039, buy at 1.14172. MetaTrader’s showin’ a similar story, sell at 1.14039, buy at 1.14204. That 1.14200 area’s a proper battleground—price peaked at 1.14216 on TradingView and 1.14204 on MetaTrader, but the bulls couldn’t hold it. Now we’re consolidating with those tight, choppy candles. Classic indecision.Lookin’ at the levels, that 1.14290 on TradingView and 1.14204 on MetaTrader is the key resistance to watch. MetaTrader’s got some extra juice with those 30-minute order blocks marked—there’s a supply zone right at that 1.14204 high, where sellers are likely steppin’ in, and a demand zone down at 1.13800–1.13900 where buyers might pile in if we drop. They’re also flaggin’ a 65% probability on a move—could be a breakout or a reversal, but the market’s coiled up tight for somethin’ big.Trend-wise, we’re still bullish overall, but this consolidation’s got me on edge. If we break above 1.14290, I’m lookin’ at 1.14660 as the next target—plenty of room to run. But if we get rejected here, I wouldn’t be surprised to see a pullback to that 1.13800 demand zone, maybe even 1.13550 if things get ugly. MetaTrader’s showin’ a small open position on EUR/USD, up 0.175 pips—nice little profit, but it’s a tiny lot size, so not much conviction there yet.Bottom line: we’re at a proper inflection point. I’d be watchin’ for a clean break above 1.14290 with volume to confirm the bulls are back in control, or a hard rejection with a bearish candle to signal a drop. Either way, keep your stops tight—this market’s about to make a move, and I don’t wanna be caught on the wrong side of it. What’s your next play?
Disclaimer
Any content and materials included in Sahmeto's website and official communication channels are a compilation of personal opinions and analyses and are not binding. They do not constitute any recommendation for buying, selling, entering or exiting the stock market and cryptocurrency market. Also, all news and analyses included in the website and channels are merely republished information from official and unofficial domestic and foreign sources, and it is obvious that users of the said content are responsible for following up and ensuring the authenticity and accuracy of the materials. Therefore, while disclaiming responsibility, it is declared that the responsibility for any decision-making, action, and potential profit and loss in the capital market and cryptocurrency market lies with the trader.