
globuscapitas
@t_globuscapitas

What symbols does the trader recommend buying?
Purchase History
پیام های تریدر
Filter
پیشبینی شگفتانگیز بیت کوین برای دسامبر ۲۰۲۵: سطوح کلیدی حمایت و مقاومت!
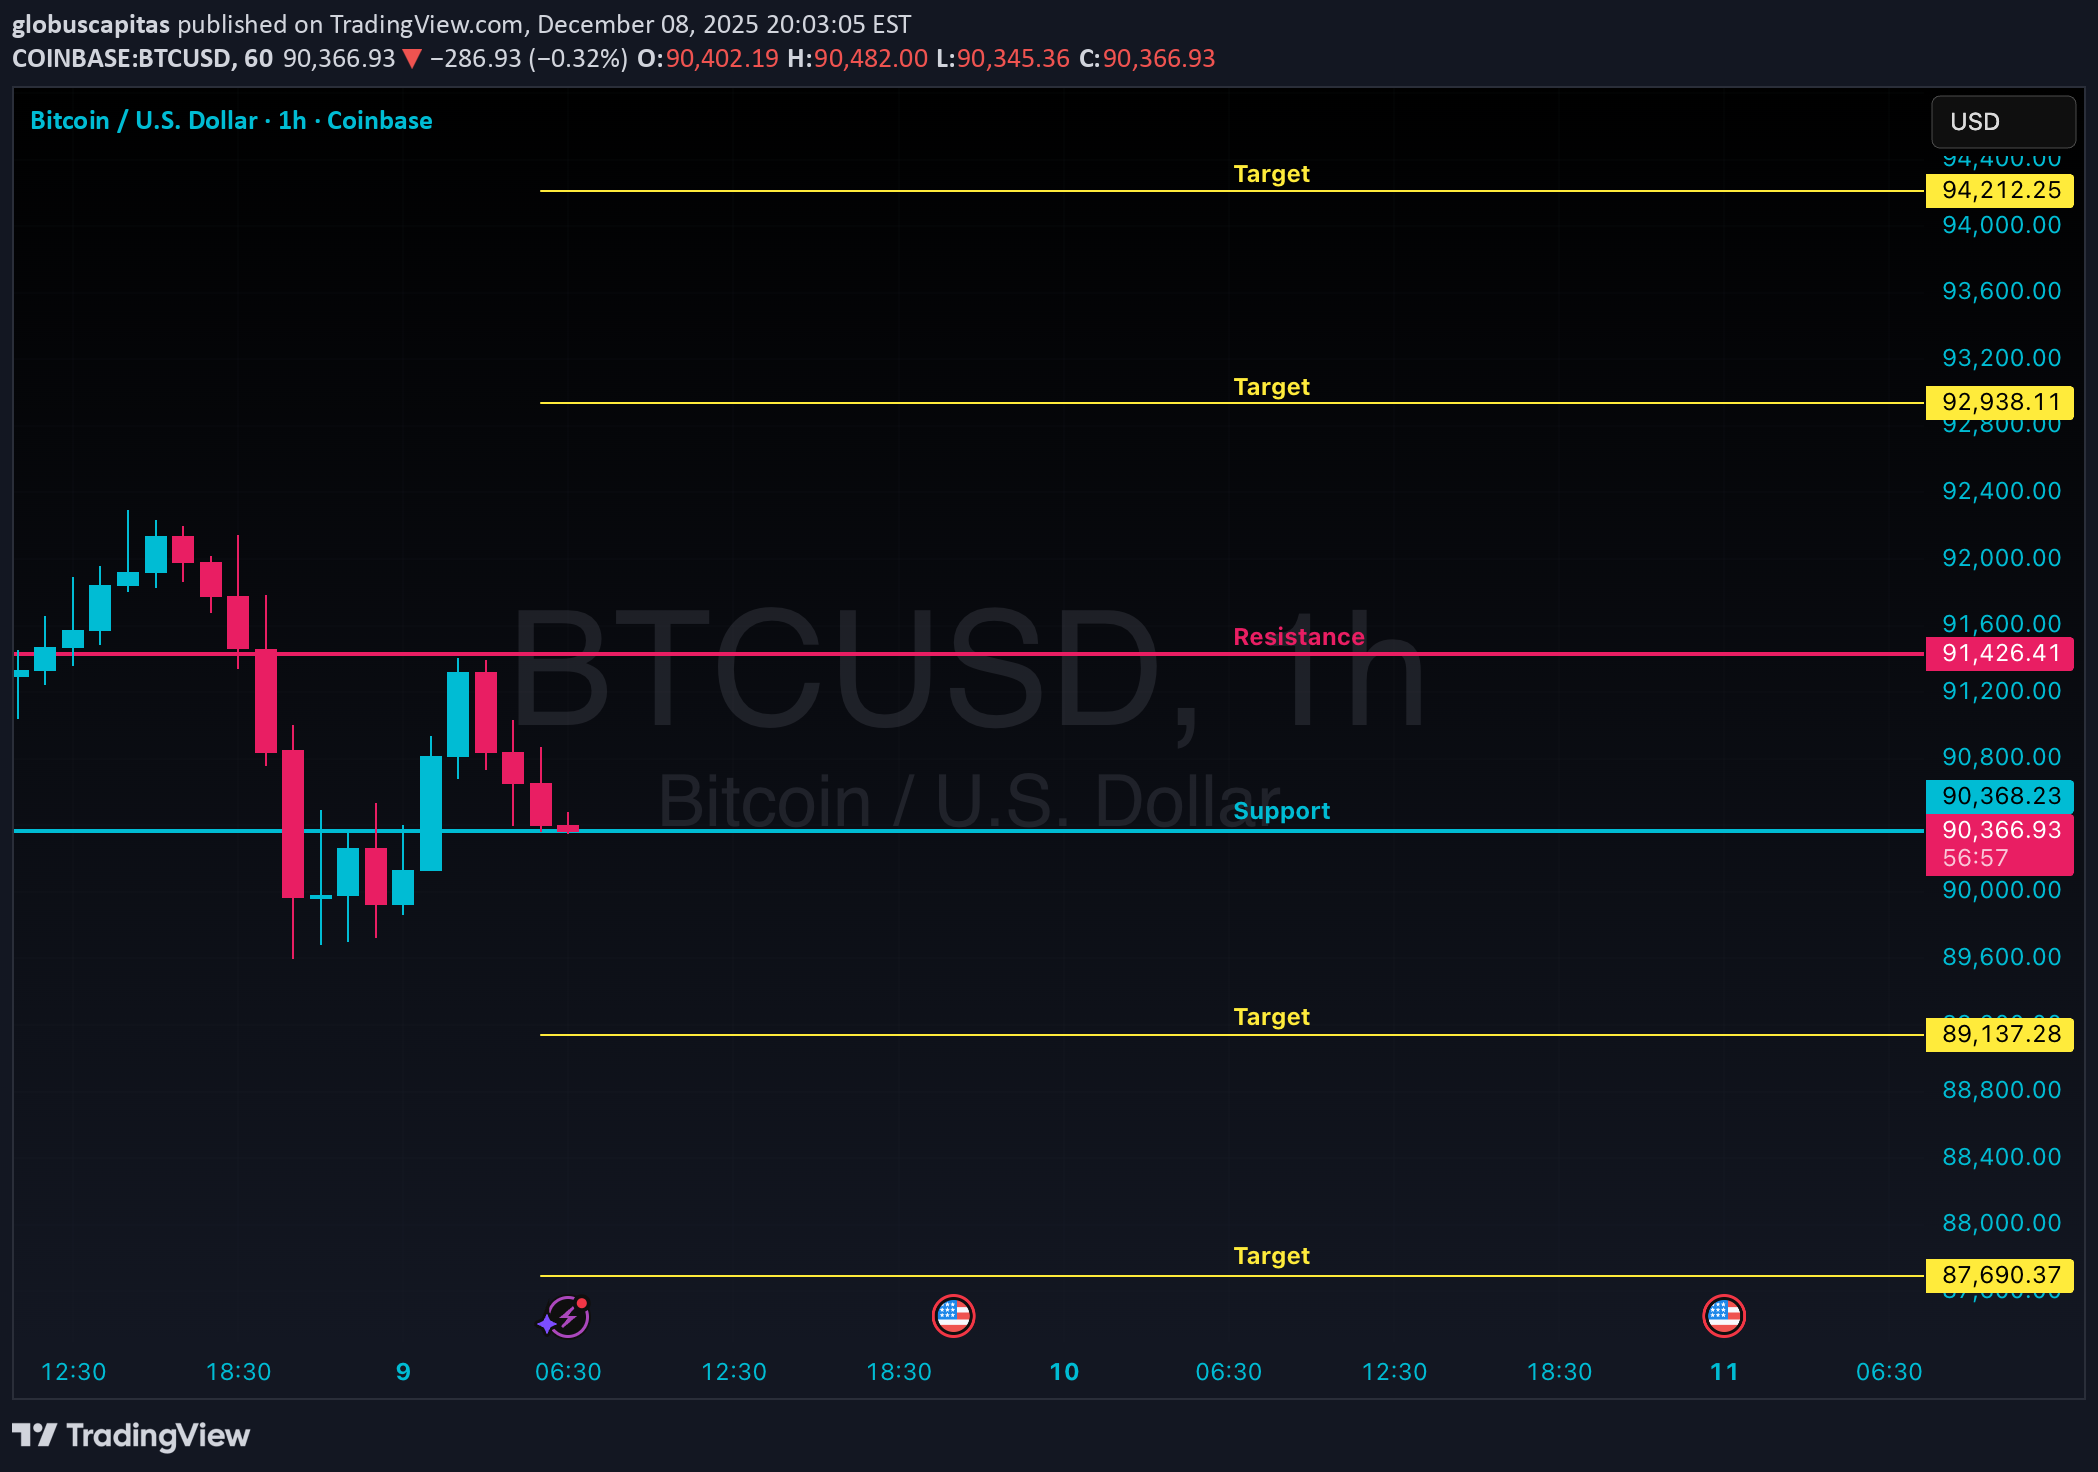
🔴 Resistance: 91,426 🚀 Upside Targets: 92,938 – 94,212 🟢 Support: 90,367 🚀 Downside Targets: 89,137 – 87,690 ⚠️ Risk Management is Key — Always Trade with Proper Risk-Reward Strategy ⚠️ 🔥 These Levels Work Best on 5 to 15-Minute Timeframes 🔥 ❤️ Market Wisdom to Remember: ❤️ ⭐ Trade what you see, not what you assume ⭐ Follow the trend — it's your only true friend ⭐ The chart tells the real story — trust it ⭐ Emotions & assumptions have no place in trading ⭐ Capital protection comes first — always At Globus Capitas, our mission is to empower individuals globally with the knowledge and skills needed to navigate financial markets confidently and work towards achieving their financial goals. 💪 Please Note: Levels shared are for DayTrading only. 🚫 Disclaimer: The information provided is purely educational. No buy/sell recommendations. Always do your own research, assess your risk tolerance, and consult a financial advisor before making any investment decisions. We are not responsible for any profit or loss. 💡 Your support matters! Like, comment, and follow to stay updated and motivated. Cheers & Trade Smart! 🚀All Targets Done, Happy Trading
Ethereum Forecast – December 9, 2025
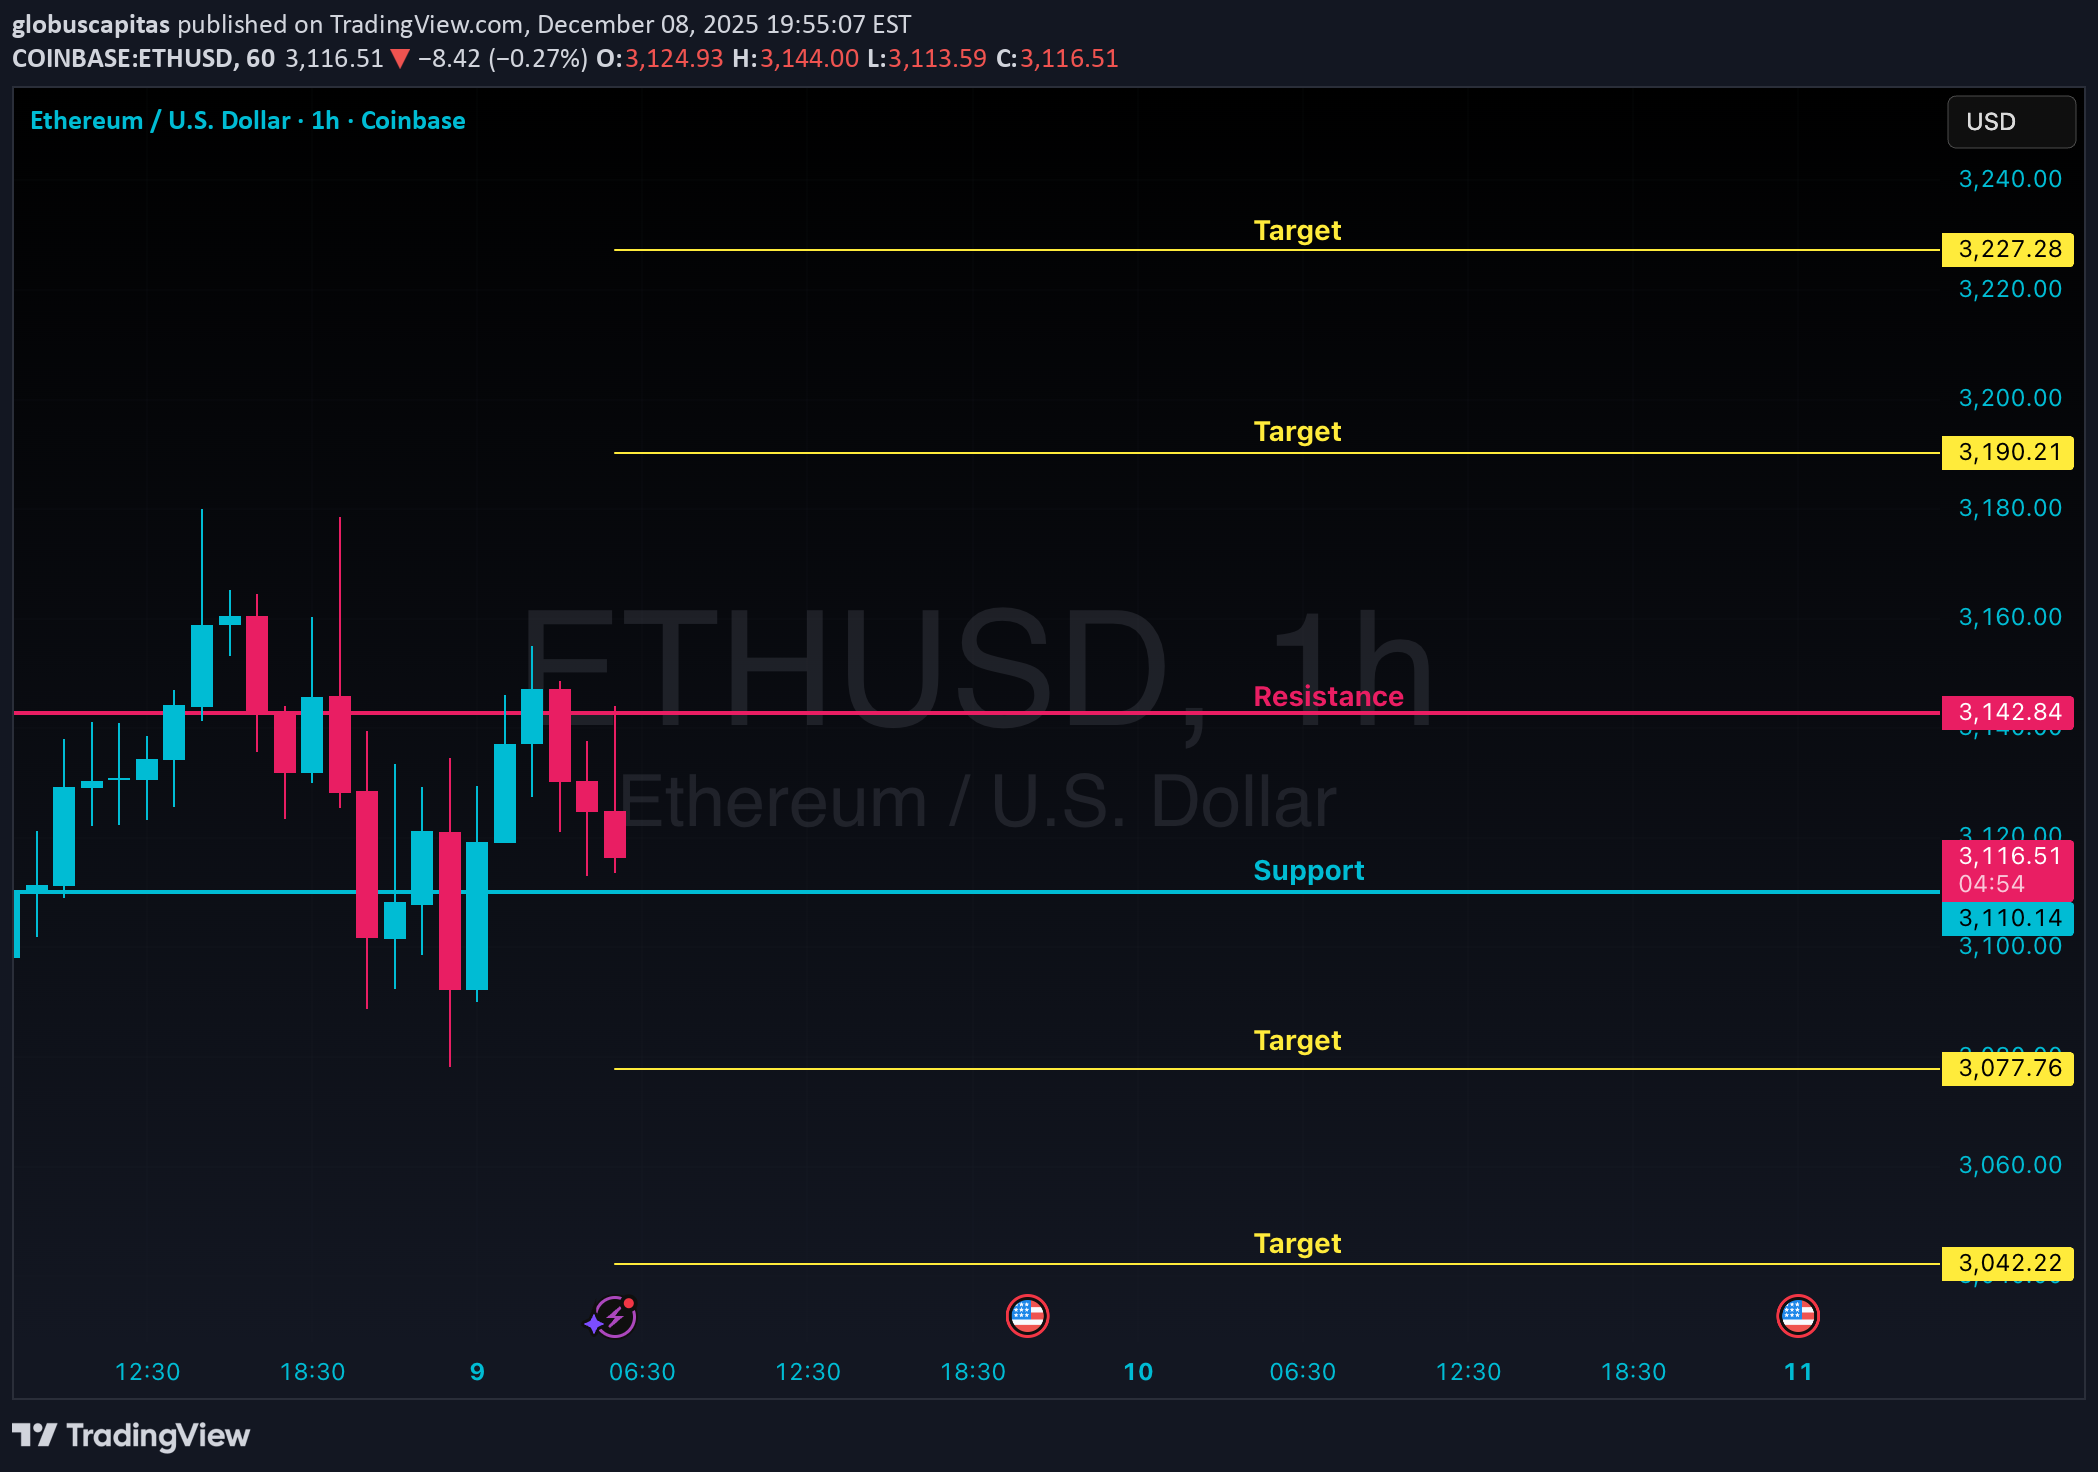
🔴 Resistance: 3,142 🚀 Upside Targets: 3,190 – 3,227 🟢 Support: 3,110 🚀 Downside Targets: 3,077 – 3,042 ⚠️ Risk Management is Key — Always Trade with Proper Risk-Reward Strategy ⚠️ 🔥 These Levels Work Best on 5 to 15-Minute Timeframes 🔥 ❤️ Market Wisdom to Remember: ❤️ ⭐ Trade what you see, not what you assume ⭐ Follow the trend — it's your only true friend ⭐ The chart tells the real story — trust it ⭐ Emotions & assumptions have no place in trading ⭐ Capital protection comes first — always At Globus Capitas, our mission is to empower individuals globally with the knowledge and skills needed to navigate financial markets confidently and work towards achieving their financial goals. 💪 Please Note: Levels shared are for DayTrading only. 🚫 Disclaimer: The information provided is purely educational. No buy/sell recommendations. Always do your own research, assess your risk tolerance, and consult a financial advisor before making any investment decisions. We are not responsible for any profit or loss. 💡 Your support matters! Like, comment, and follow to stay updated and motivated. Cheers & Trade Smart! 🚀All Targets Done, Happy Trading
پیشبینی سرنوشت بیت کوین تا پایان سال ۲۰۲۵: سطوح کلیدی حمایت و مقاومت!
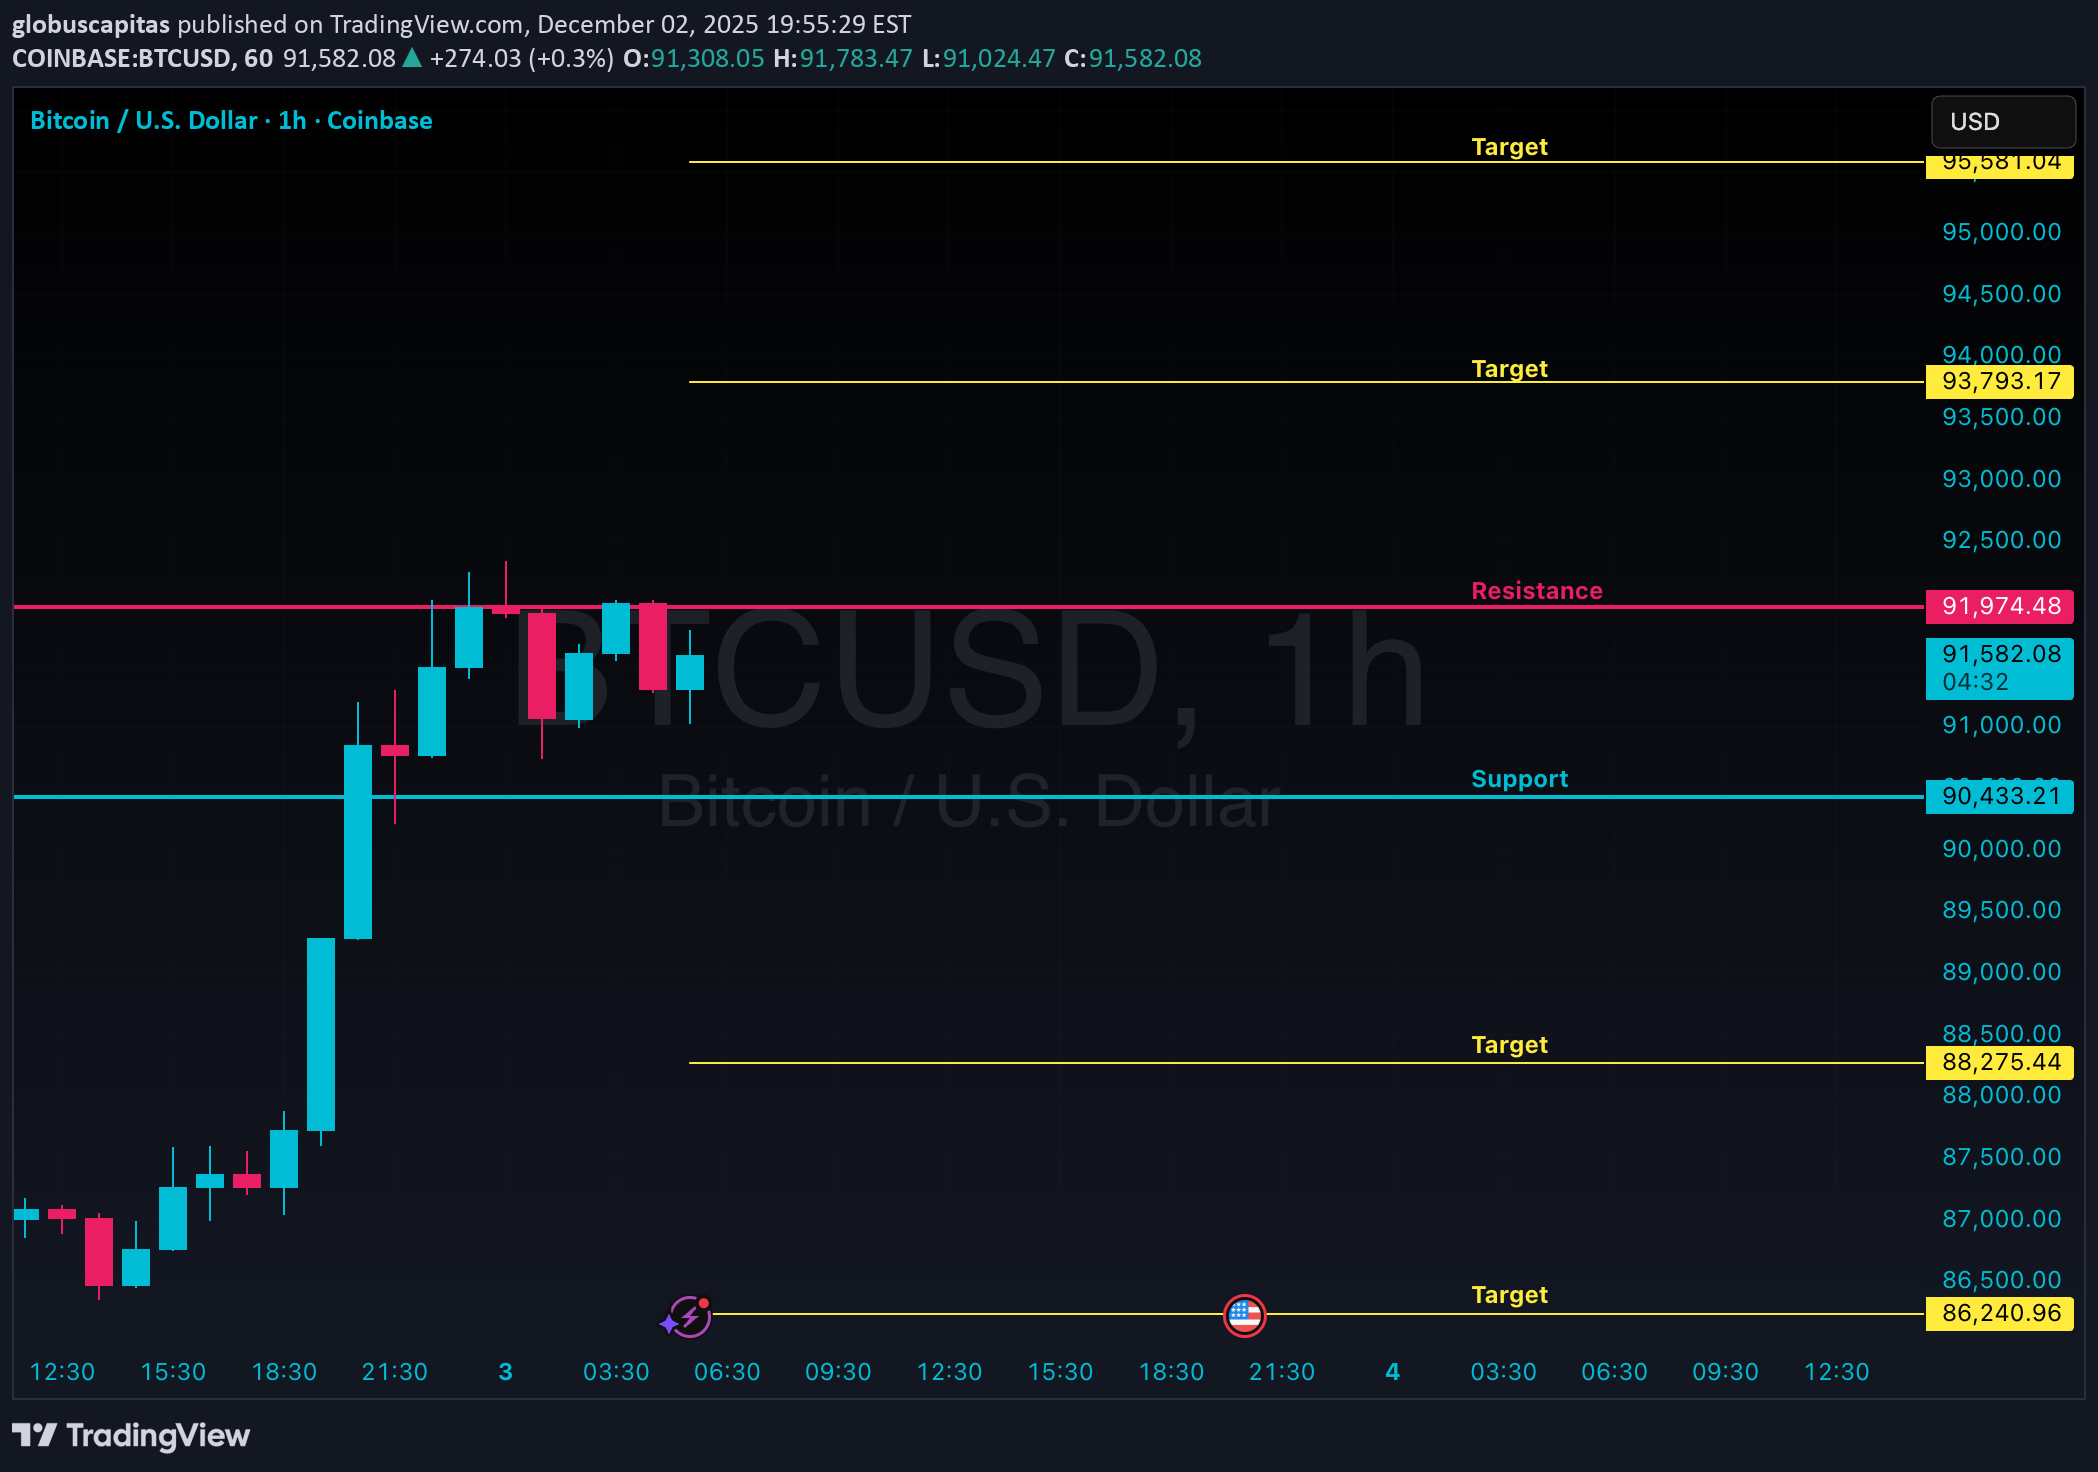
🔴 Resistance: 91.974 🚀 Upside Targets: 93,793 – 95,581 🟢 Support: 90,433 🚀 Downside Targets: 88,275 – 86,240 ⚠️ Risk Management is Key — Always Trade with Proper Risk-Reward Strategy ⚠️ 🔥 These Levels Work Best on 5 to 15-Minute Timeframes 🔥 ❤️ Market Wisdom to Remember: ❤️ ⭐ Trade what you see, not what you assume ⭐ Follow the trend — it's your only true friend ⭐ The chart tells the real story — trust it ⭐ Emotions & assumptions have no place in trading ⭐ Capital protection comes first — always At Globus Capitas, our mission is to empower individuals globally with the knowledge and skills needed to navigate financial markets confidently and work towards achieving their financial goals. 💪 Please Note: Levels shared are for DayTrading only. 🚫 Disclaimer: The information provided is purely educational. No buy/sell recommendations. Always do your own research, assess your risk tolerance, and consult a financial advisor before making any investment decisions. We are not responsible for any profit or loss. 💡 Your support matters! Like, comment, and follow to stay updated and motivated. Cheers & Trade Smart! 🚀
پیشبینی قیمت ریپل (XRP): سطوح کلیدی و اهداف معاملاتی 3 دسامبر 2025
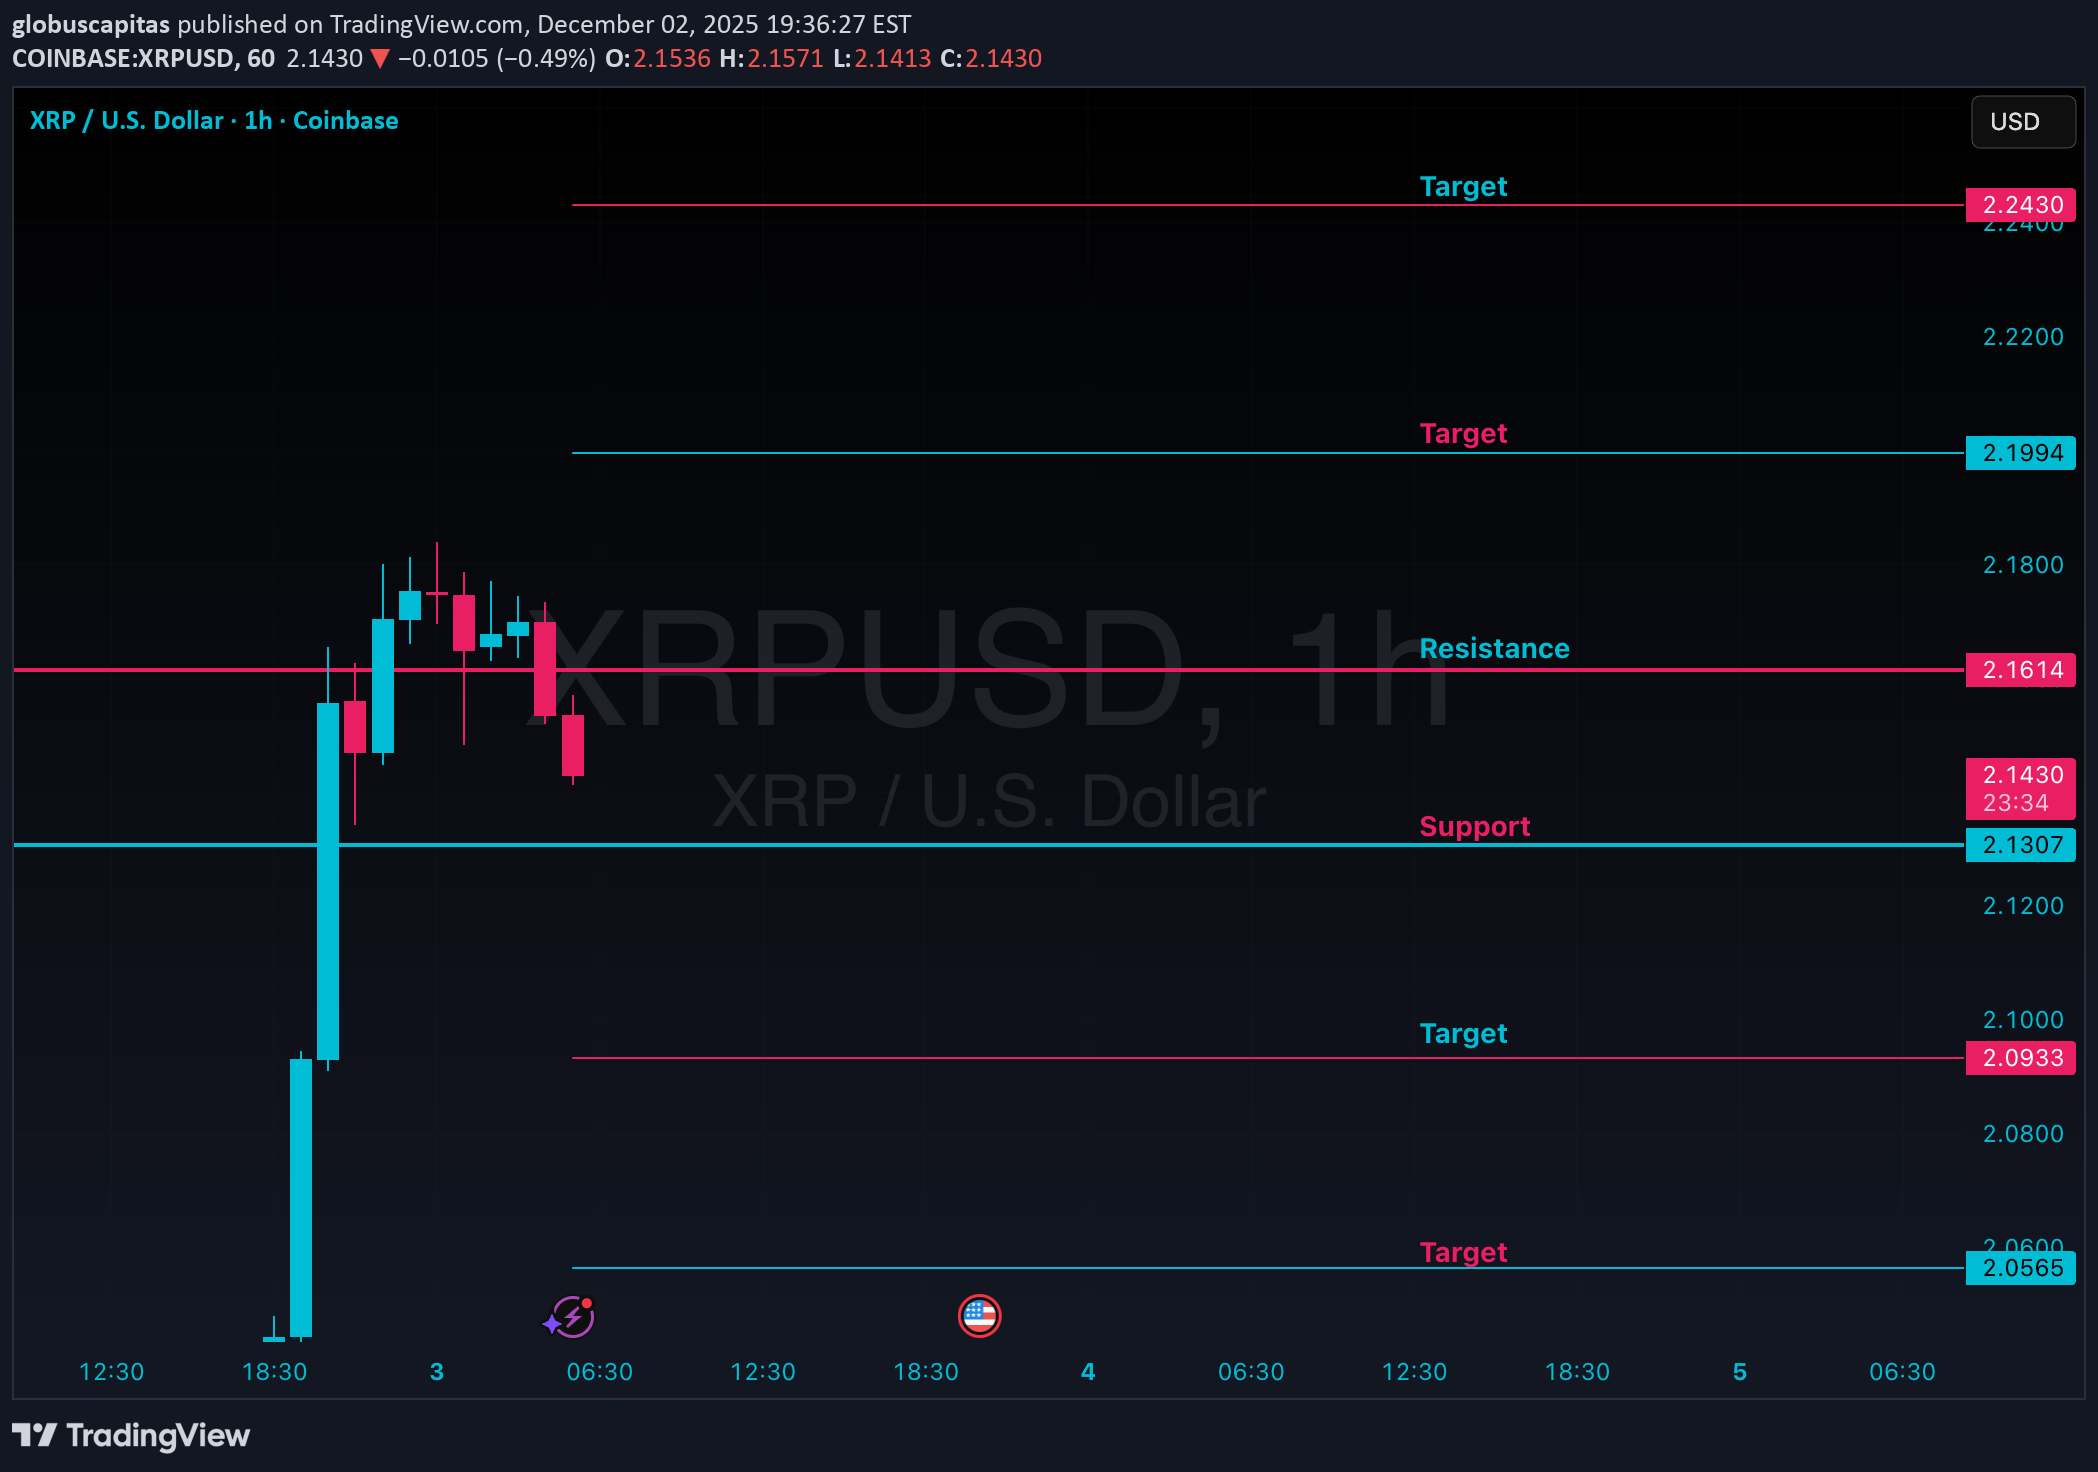
🔴 Resistance: 2.1614 🚀 Upside Targets: 2.1994 – 2.2430 🟢 Support: 2.1307 🚀 Downside Targets: 2.0933 – 2.0565 ⚠️ Risk Management is Key — Always Trade with Proper Risk-Reward Strategy ⚠️ 🔥 These Levels Work Best on 5 to 15-Minute Timeframes 🔥 ❤️ Market Wisdom to Remember: ❤️ ⭐ Trade what you see, not what you assume ⭐ Follow the trend — it's your only true friend ⭐ The chart tells the real story — trust it ⭐ Emotions & assumptions have no place in trading ⭐ Capital protection comes first — always At Globus Capitas, our mission is to empower individuals globally with the knowledge and skills needed to navigate financial markets confidently and work towards achieving their financial goals. 💪 Please Note: Levels shared are for DayTrading only. 🚫 Disclaimer: The information provided is purely educational. No buy/sell recommendations. Always do your own research, assess your risk tolerance, and consult a financial advisor before making any investment decisions. We are not responsible for any profit or loss. 💡 Your support matters! Like, comment, and follow to stay updated and motivated. Cheers & Trade Smart! 🚀
پیشبینی قیمت اتریوم تا پایان ۲۰۲۵: سطوح کلیدی حمایت و مقاومت برای تریدرها
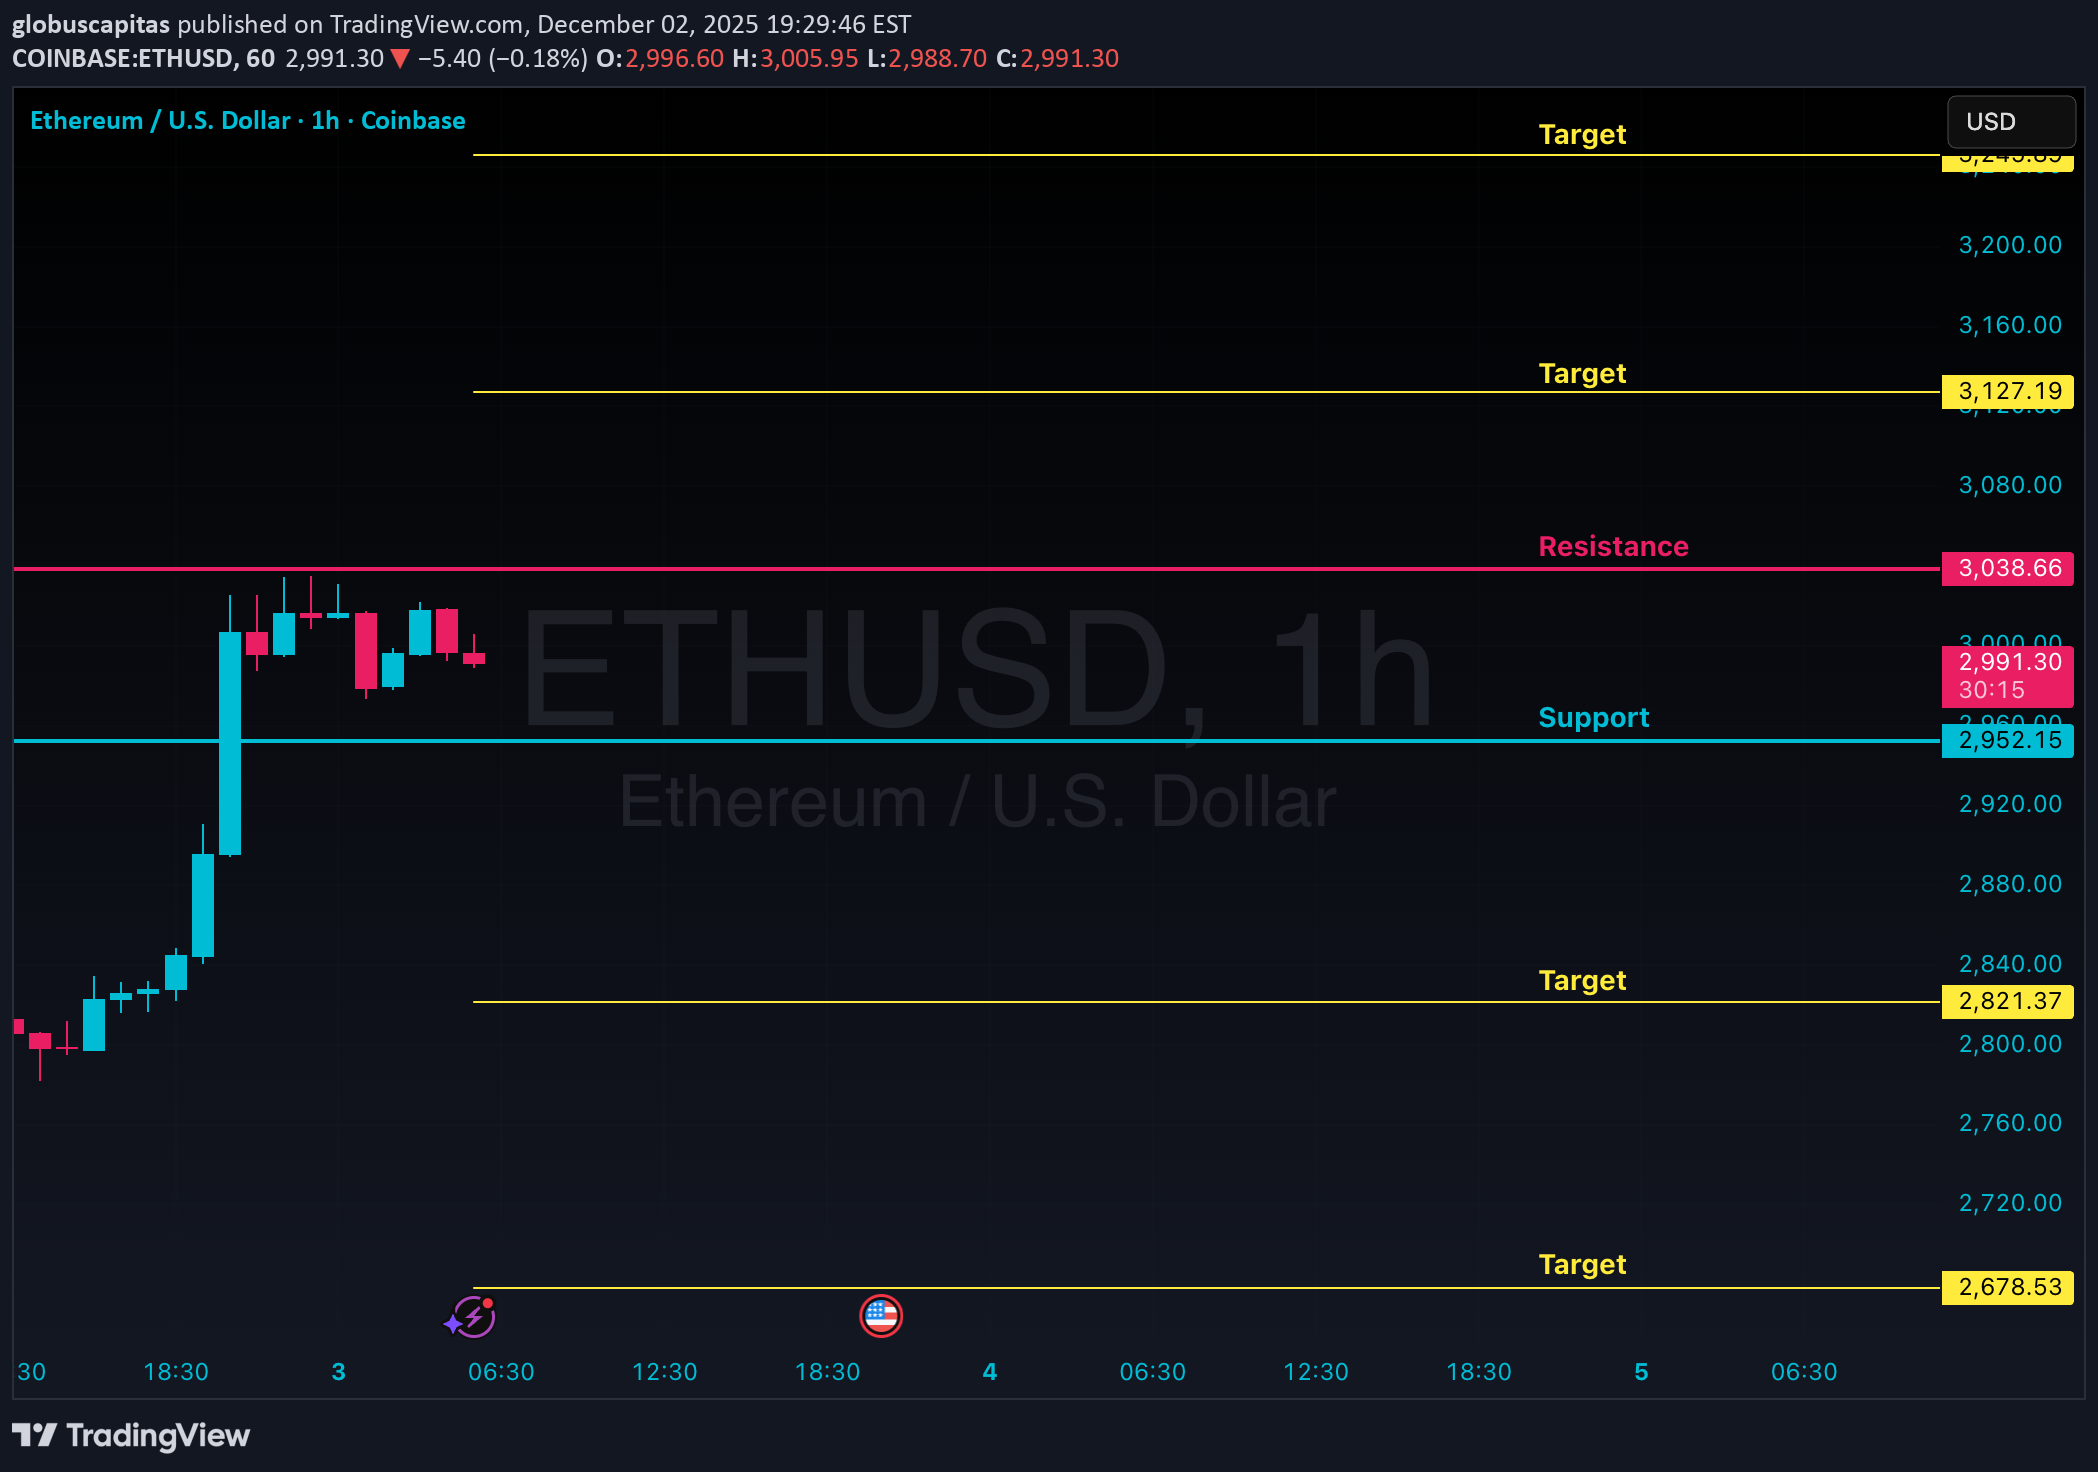
🔴 Resistance: 3,038 🚀 Upside Targets: 3,127 – 3,245 🟢 Support: 2,952 🚀 Downside Targets: 2,821 – 2,678 ⚠️ Risk Management is Key — Always Trade with Proper Risk-Reward Strategy ⚠️ 🔥 These Levels Work Best on 5 to 15-Minute Timeframes 🔥 ❤️ Market Wisdom to Remember: ❤️ ⭐ Trade what you see, not what you assume ⭐ Follow the trend — it's your only true friend ⭐ The chart tells the real story — trust it ⭐ Emotions & assumptions have no place in trading ⭐ Capital protection comes first — always At Globus Capitas, our mission is to empower individuals globally with the knowledge and skills needed to navigate financial markets confidently and work towards achieving their financial goals. 💪 Please Note: Levels shared are for DayTrading only. 🚫 Disclaimer: The information provided is purely educational. No buy/sell recommendations. Always do your own research, assess your risk tolerance, and consult a financial advisor before making any investment decisions. We are not responsible for any profit or loss. 💡 Your support matters! Like, comment, and follow to stay updated and motivated. Cheers & Trade Smart! 🚀
پیشبینی قیمت اتریوم (ETH) تا پایان ۲۰۲۵: سطوح کلیدی حمایت و مقاومت برای تریدرها
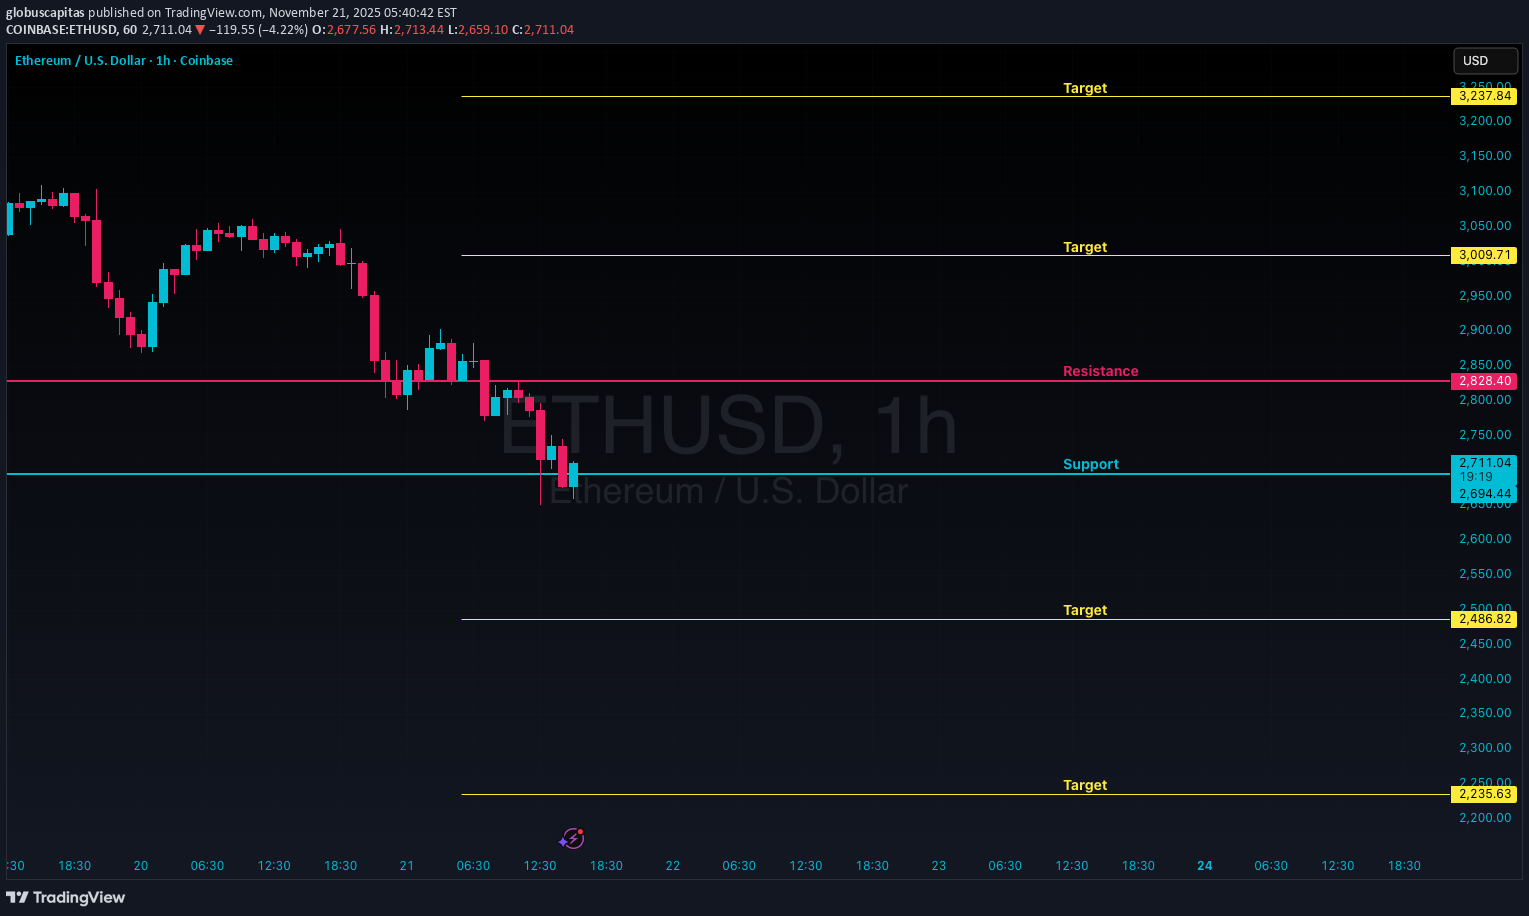
🔴 Resistance: 2,828 🚀 Upside Targets: 3,009 – 3,237 🟢 Support: 2,694 🚀 Downside Targets: 2,486 – 2,235 ⚠️ Risk Management is Key — Always Trade with Proper Risk-Reward Strategy ⚠️ 🔥 These Levels Work Best on 5 to 15-Minute Timeframes 🔥 ❤️ Market Wisdom to Remember: ❤️ ⭐ Trade what you see, not what you assume ⭐ Follow the trend — it's your only true friend ⭐ The chart tells the real story — trust it ⭐ Emotions & assumptions have no place in trading ⭐ Capital protection comes first — always At Globus Capitas, our mission is to empower individuals globally with the knowledge and skills needed to navigate financial markets confidently and work towards achieving their financial goals. 💪 Please Note: Levels shared are for DayTrading only. 🚫 Disclaimer: The information provided is purely educational. No buy/sell recommendations. Always do your own research, assess your risk tolerance, and consult a financial advisor before making any investment decisions. We are not responsible for any profit or loss. 💡 Your support matters! Like, comment, and follow to stay updated and motivated. Cheers & Trade Smart! 🚀
پیشبینی قیمت XRP تا نوامبر ۲۰۲۵: سطوح کلیدی حمایت و مقاومت برای ترید روزانه
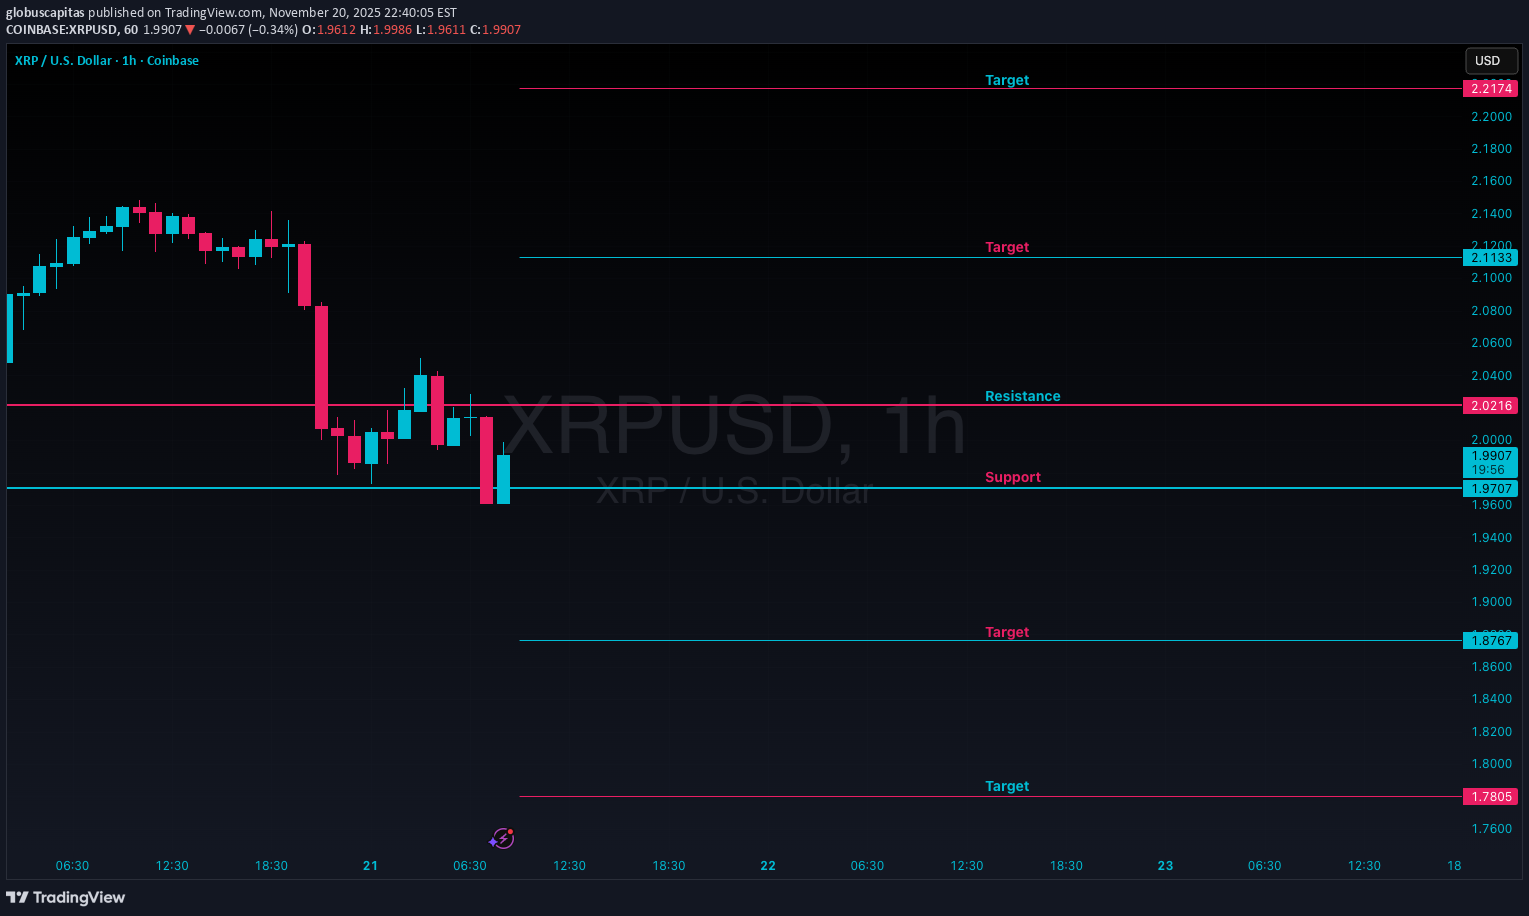
🔴 Resistance: 2.0216 🚀 Upside Targets: 2.1133 – 2.2174 🟢 Support: 1.9707 🚀 Downside Targets: 1.8767 – 1.7805 ⚠️ Risk Management is Key — Always Trade with Proper Risk-Reward Strategy ⚠️ 🔥 These Levels Work Best on 5 to 15-Minute Timeframes 🔥 ❤️ Market Wisdom to Remember: ❤️ ⭐ Trade what you see, not what you assume ⭐ Follow the trend — it's your only true friend ⭐ The chart tells the real story — trust it ⭐ Emotions & assumptions have no place in trading ⭐ Capital protection comes first — always At Globus Capitas, our mission is to empower individuals globally with the knowledge and skills needed to navigate financial markets confidently and work towards achieving their financial goals. 💪 Please Note: Levels shared are for DayTrading only. 🚫 Disclaimer: The information provided is purely educational. No buy/sell recommendations. Always do your own research, assess your risk tolerance, and consult a financial advisor before making any investment decisions. We are not responsible for any profit or loss. 💡 Your support matters! Like, comment, and follow to stay updated and motivated. Cheers & Trade Smart! 🚀
پیشبینی شگفتانگیز تسلا (TSLA) برای 17 نوامبر 2025: سطوح دقیق خرید و فروش!

🔴 Resistance: 406 🚀 Upside Targets: 410 – 414 🟢 Support: 403 🚀 Downside Targets: 398 – 394 ⚠️ Risk Management is Key — Always Trade with Proper Risk-Reward Strategy ⚠️ 🔥 These Levels Work Best on 5 to 15-Minute Timeframes 🔥 ❤️ Market Wisdom to Remember: ❤️ ⭐ Trade what you see, not what you assume ⭐ Follow the trend — it's your only true friend ⭐ The chart tells the real story — trust it ⭐ Emotions & assumptions have no place in trading ⭐ Capital protection comes first — always At Globus Capitas, our mission is to empower individuals globally with the knowledge and skills needed to navigate financial markets confidently and work towards achieving their financial goals. 💪 Please Note: Levels shared are for DayTrading only. 🚫 Disclaimer: The information provided is purely educational. No buy/sell recommendations. Always do your own research, assess your risk tolerance, and consult a financial advisor before making any investment decisions. We are not responsible for any profit or loss. 💡 Your support matters! Like, comment, and follow to stay updated and motivated. Cheers & Trade Smart! 🚀All Targets Done, Happy Trading 🍻⭐️ Done & Dusted ⭐️
پیشبینی قیمت سولانا (SOL) تا نوامبر ۲۰۲۵: سطوح کلیدی حمایت و مقاومت برای ترید روزانه
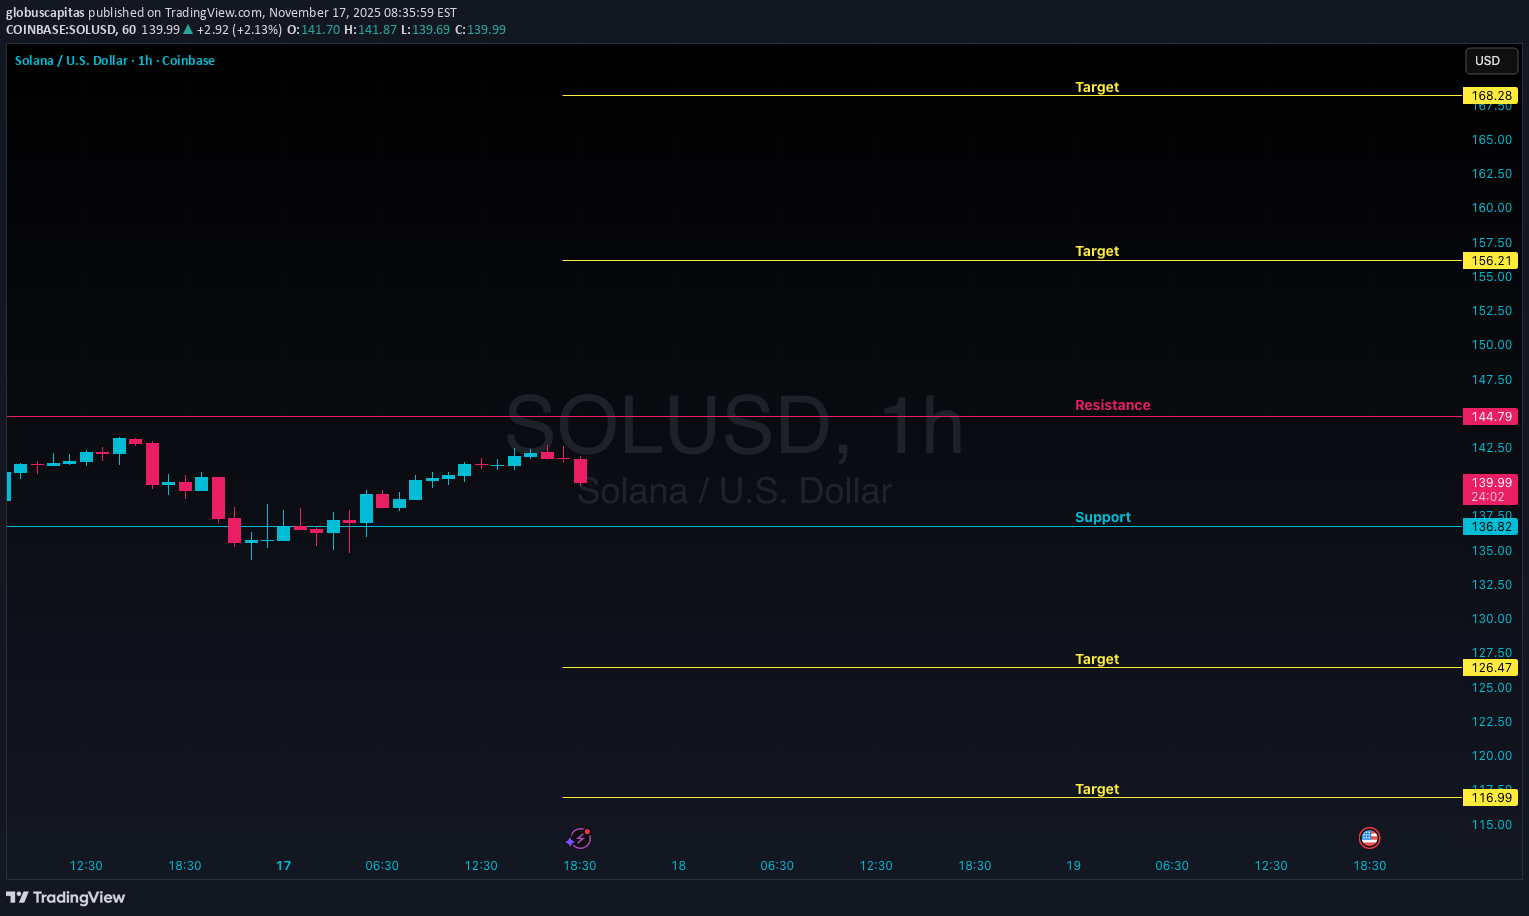
🔴 Resistance: 144 🚀 Upside Targets: 156 – 168 🟢 Support: 136 🚀 Downside Targets: 126 – 116 ⚠️ Risk Management is Key — Always Trade with Proper Risk-Reward Strategy ⚠️ 🔥 These Levels Work Best on 5 to 15-Minute Timeframes 🔥 ❤️ Market Wisdom to Remember: ❤️ ⭐ Trade what you see, not what you assume ⭐ Follow the trend — it's your only true friend ⭐ The chart tells the real story — trust it ⭐ Emotions & assumptions have no place in trading ⭐ Capital protection comes first — always At Globus Capitas, our mission is to empower individuals globally with the knowledge and skills needed to navigate financial markets confidently and work towards achieving their financial goals. 💪 Please Note: Levels shared are for DayTrading only. 🚫 Disclaimer: The information provided is purely educational. No buy/sell recommendations. Always do your own research, assess your risk tolerance, and consult a financial advisor before making any investment decisions. We are not responsible for any profit or loss. 💡 Your support matters! Like, comment, and follow to stay updated and motivated. Cheers & Trade Smart! 🚀
پیشبینی قیمت XRP: سطوح کلیدی حمایت و مقاومت تا 17 نوامبر 2025
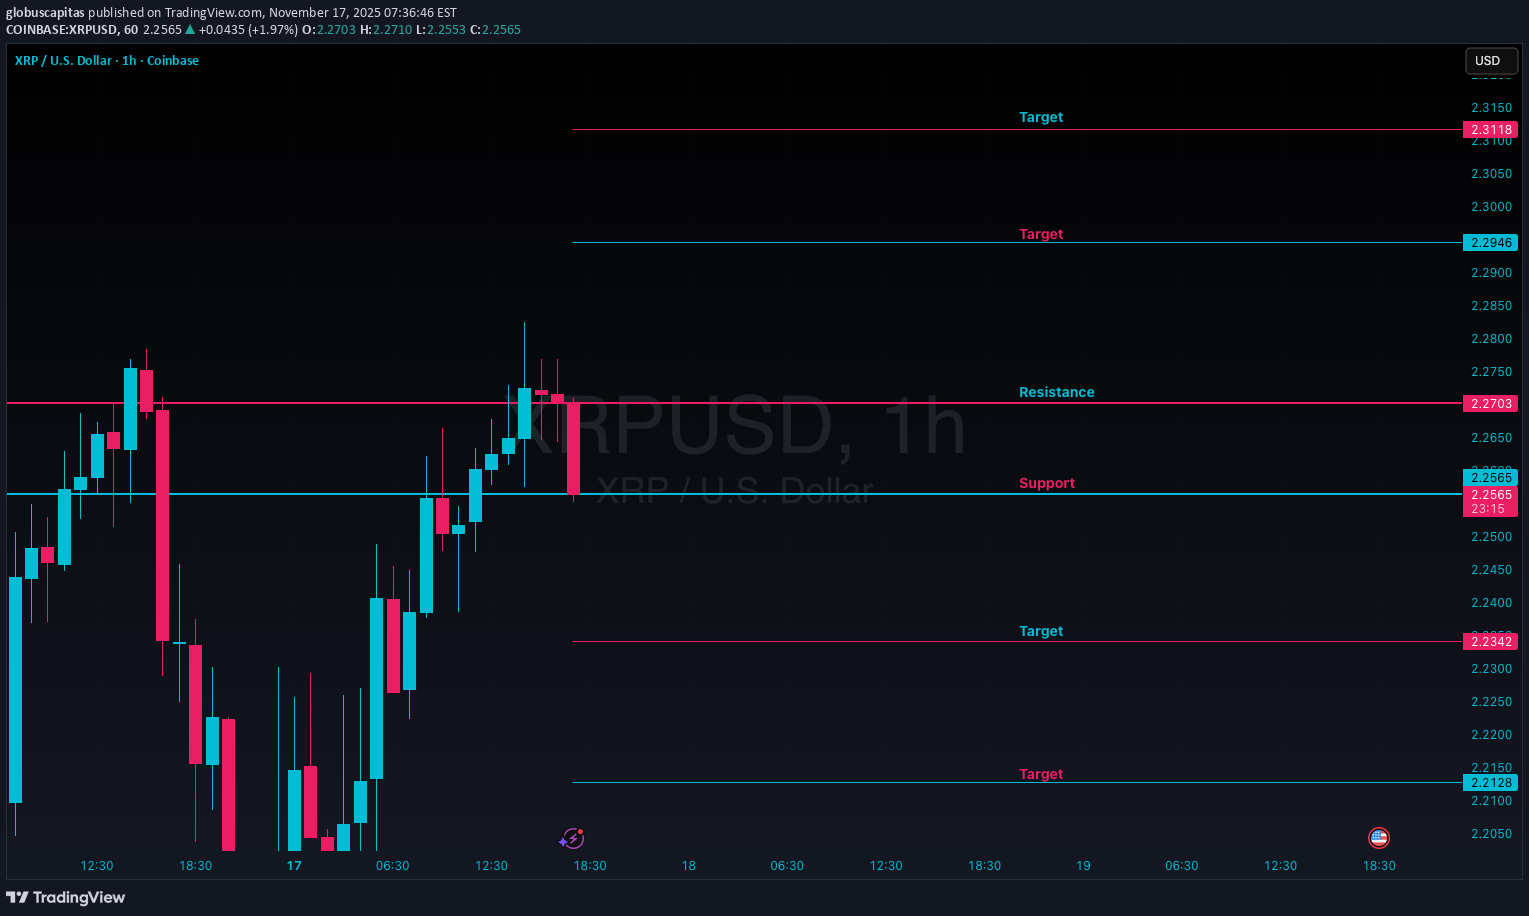
🔴 Resistance: 2.2703 🚀 Upside Targets: 2.2946 – 2.3118 🟢 Support: 2.2565 🚀 Downside Targets: 2.2342 – 2.2128 ⚠️ Risk Management is Key — Always Trade with Proper Risk-Reward Strategy ⚠️ 🔥 These Levels Work Best on 5 to 15-Minute Timeframes 🔥 ❤️ Market Wisdom to Remember: ❤️ ⭐ Trade what you see, not what you assume ⭐ Follow the trend — it's your only true friend ⭐ The chart tells the real story — trust it ⭐ Emotions & assumptions have no place in trading ⭐ Capital protection comes first — always At Globus Capitas, our mission is to empower individuals globally with the knowledge and skills needed to navigate financial markets confidently and work towards achieving their financial goals. 💪 Please Note: Levels shared are for DayTrading only. 🚫 Disclaimer: The information provided is purely educational. No buy/sell recommendations. Always do your own research, assess your risk tolerance, and consult a financial advisor before making any investment decisions. We are not responsible for any profit or loss. 💡 Your support matters! Like, comment, and follow to stay updated and motivated. Cheers & Trade Smart! 🚀
Disclaimer
Any content and materials included in Sahmeto's website and official communication channels are a compilation of personal opinions and analyses and are not binding. They do not constitute any recommendation for buying, selling, entering or exiting the stock market and cryptocurrency market. Also, all news and analyses included in the website and channels are merely republished information from official and unofficial domestic and foreign sources, and it is obvious that users of the said content are responsible for following up and ensuring the authenticity and accuracy of the materials. Therefore, while disclaiming responsibility, it is declared that the responsibility for any decision-making, action, and potential profit and loss in the capital market and cryptocurrency market lies with the trader.