
gimferati
@t_gimferati

What symbols does the trader recommend buying?
Purchase History
پیام های تریدر
Filter
AAVE
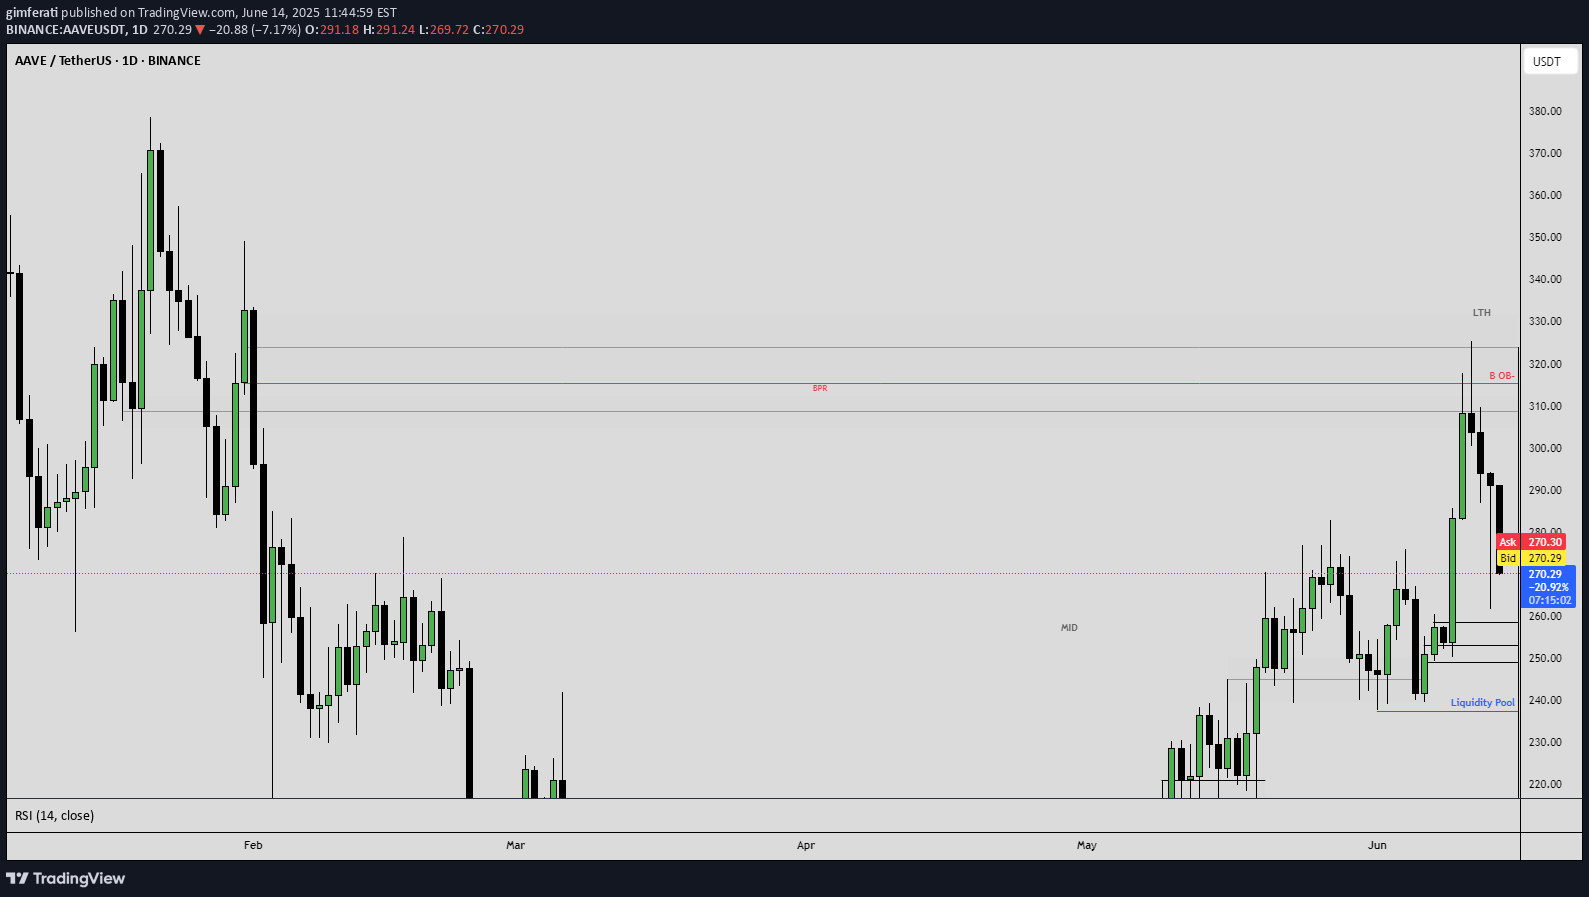
Conclusion (How the Post-MSS Demand Zone connects to structure):The Post-MSS demand zone has served as the foundation for the current bullish reversal and represents the base of this new uptrend.As long as this zone isn't broken clearly and with high volume, the higher time frame bias remains bullish.Any move lower from here should be viewed as a retracement to collect liquidity, not necessarily a trend reversal.
AAVE 4H
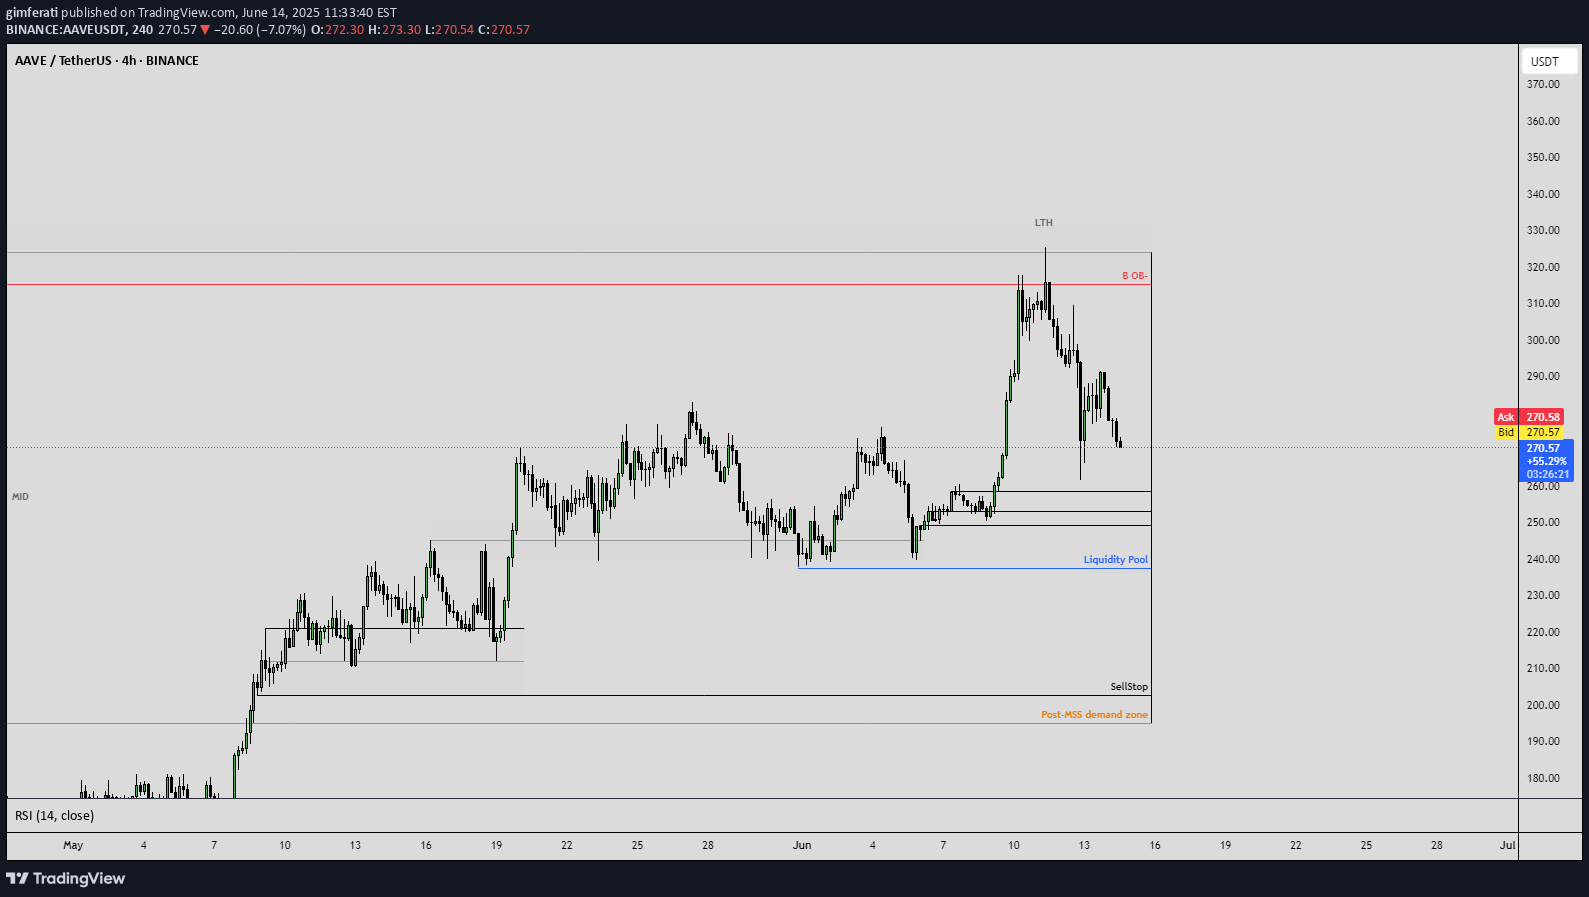
Conclusion (How the Post-MSS Demand Zone connects to structure):The Post-MSS demand zone has served as the foundation for the current bullish reversal and represents the base of this new uptrend.As long as this zone isn't broken clearly and with high volume, the higher time frame bias remains bullish.Any move lower from here should be viewed as a retracement to collect liquidity, not necessarily a trend reversal.
AAVE
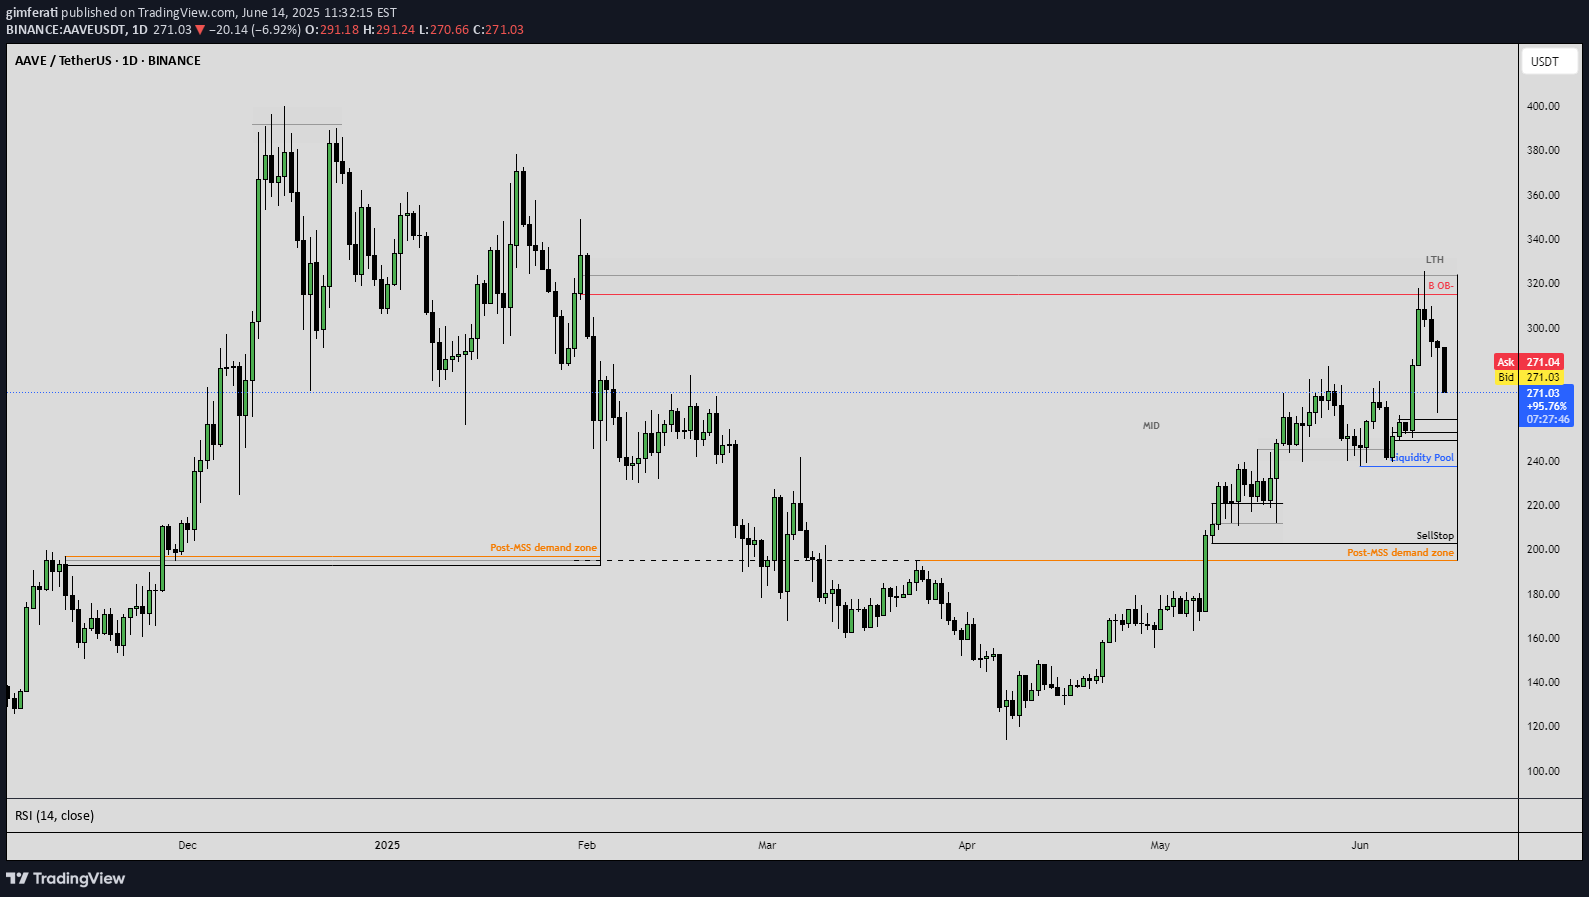
Conclusion (How the Post-MSS Demand Zone connects to structure):The Post-MSS demand zone has served as the foundation for the current bullish reversal and represents the base of this new uptrend.As long as this zone isn't broken clearly and with high volume, the higher time frame bias remains bullish.Any move lower from here should be viewed as a retracement to collect liquidity, not necessarily a trend reversal.

Ethereum is currently forming a Falling Wedge, leaving room for the realization of the Inverse Head and Shoulders (IHS) pattern. At the moment, there is space for two more weekly candles within the Falling Wedge, with the potential for price to find support in the red box below. From that point, a bounce is expected, leading to a breakout from the wedge and confirming the IHS pattern.If the price manages to break through the key $4,105 zone, the first rally is likely to reach the flag positioned in the psychological zone of Fib 0.618. Beyond that, it will depend on market conditions to determine whether we enter a new bullish season, which could push Ethereum toward new all-time highs (ATHs).
Fio

"Analysis of FIOUSDT: Key focus on maintaining support at MA 89 and the 0.0375 zone. A false breakout above the ascending bearish channel followed by a pullback highlights the importance of confirming support before targeting higher levels."
FIO

"FIO/USDT Analysis: On the daily chart, support has been established at the 0.0375 zone, aligned with the MA 89. As long as the price maintains this support, we anticipate a potential move towards the target of 0.046.However, there is a key mid-range resistance at 0.04196, corresponding to the convergence of MA 10 and MA 21. A breakout above this resistance could accelerate the move to the target, while rejection at this level may lead to retesting the support zones.RSI is currently at 40.24, indicating room for growth before reaching overbought levels. Monitoring volume will be crucial to confirm the momentum of the price action."
HOOK

HOOK/USDT Technical AnalysisThe chart shows an important support zone (box) between $0.388 - $0.358. This level is critical for maintaining the bullish structure. If the price holds above this zone, there is potential for a rebound toward the $0.45 resistance, aligning with key moving averages (SMA 55 and SMA 89).The recent breakdown below the trendline indicates short-term bearish pressure, but the oversold RSI at 36.21 suggests a possible recovery.Key Scenarios:Bullish:If the price holds the support zone and RSI moves upward, a test of $0.45 is likely.A breakout above $0.45 could extend the rally toward $0.48 - $0.50.Bearish:A breakdown below $0.358 may lead to further downside, targeting $0.32 or lower.Recommendation:Watch the volume closely to confirm a move, and consider placing a stop-loss below the support box to manage risk effectively.
ONDO

Technical Analysis for ONDO/USDT - Key Retest ZonesThe ONDO/USDT chart highlights two critical zones for potential retests that could play a significant role in determining the next price movement:Support Zone at $1.37: This level represents a crucial area to test the strength of the current trend and may serve as a support for a potential reversal.21 Moving Average (MA) at $1.47: A retest of this zone emphasizes its importance as a technical checkpoint within the trend. The 21 MA is often used to gauge short-term momentum.These retests are key areas to monitor for understanding trend dynamics and the strength of support at these levels.💡 This description is for informational purposes only and encourages individuals to follow trends and other technical factors based on their personal analysis.
ADA

Technical Analysis of Cardano (ADA) against Tether (USDT) on a 3-day timeframe on Binance.Price Analysis:- Current price: 1.0848 USDTKey Support and Resistance Zones:- Blue horizontal zone around 1.00 USDT- Yellow horizontal zone around 1.50 USDT- Purple horizontal zone around 2.00 USDTTrend Lines:- White lines indicating possible support and resistance levelsProjected Price Movement:- Dashed white line suggesting a bullish trend towards 3.00 USDTCandlestick Patterns:- Historical price movements with candlestick patternsThis analysis visually represents potential future price movements for ADA, highlighting key support and resistance levels and suggesting a positive outlook.
THETA

THETA is breaking out of a long-term descending triangle, with key support levels at $1.50 and $2.00. If momentum continues, targets of $5, $8, and $12+ could be reached by 2025. Watch for a sustained move above $3 to confirm further upside.
Disclaimer
Any content and materials included in Sahmeto's website and official communication channels are a compilation of personal opinions and analyses and are not binding. They do not constitute any recommendation for buying, selling, entering or exiting the stock market and cryptocurrency market. Also, all news and analyses included in the website and channels are merely republished information from official and unofficial domestic and foreign sources, and it is obvious that users of the said content are responsible for following up and ensuring the authenticity and accuracy of the materials. Therefore, while disclaiming responsibility, it is declared that the responsibility for any decision-making, action, and potential profit and loss in the capital market and cryptocurrency market lies with the trader.