fxt8
@t_fxt8

What symbols does the trader recommend buying?
Purchase History
پیام های تریدر
Filter
Signal Type
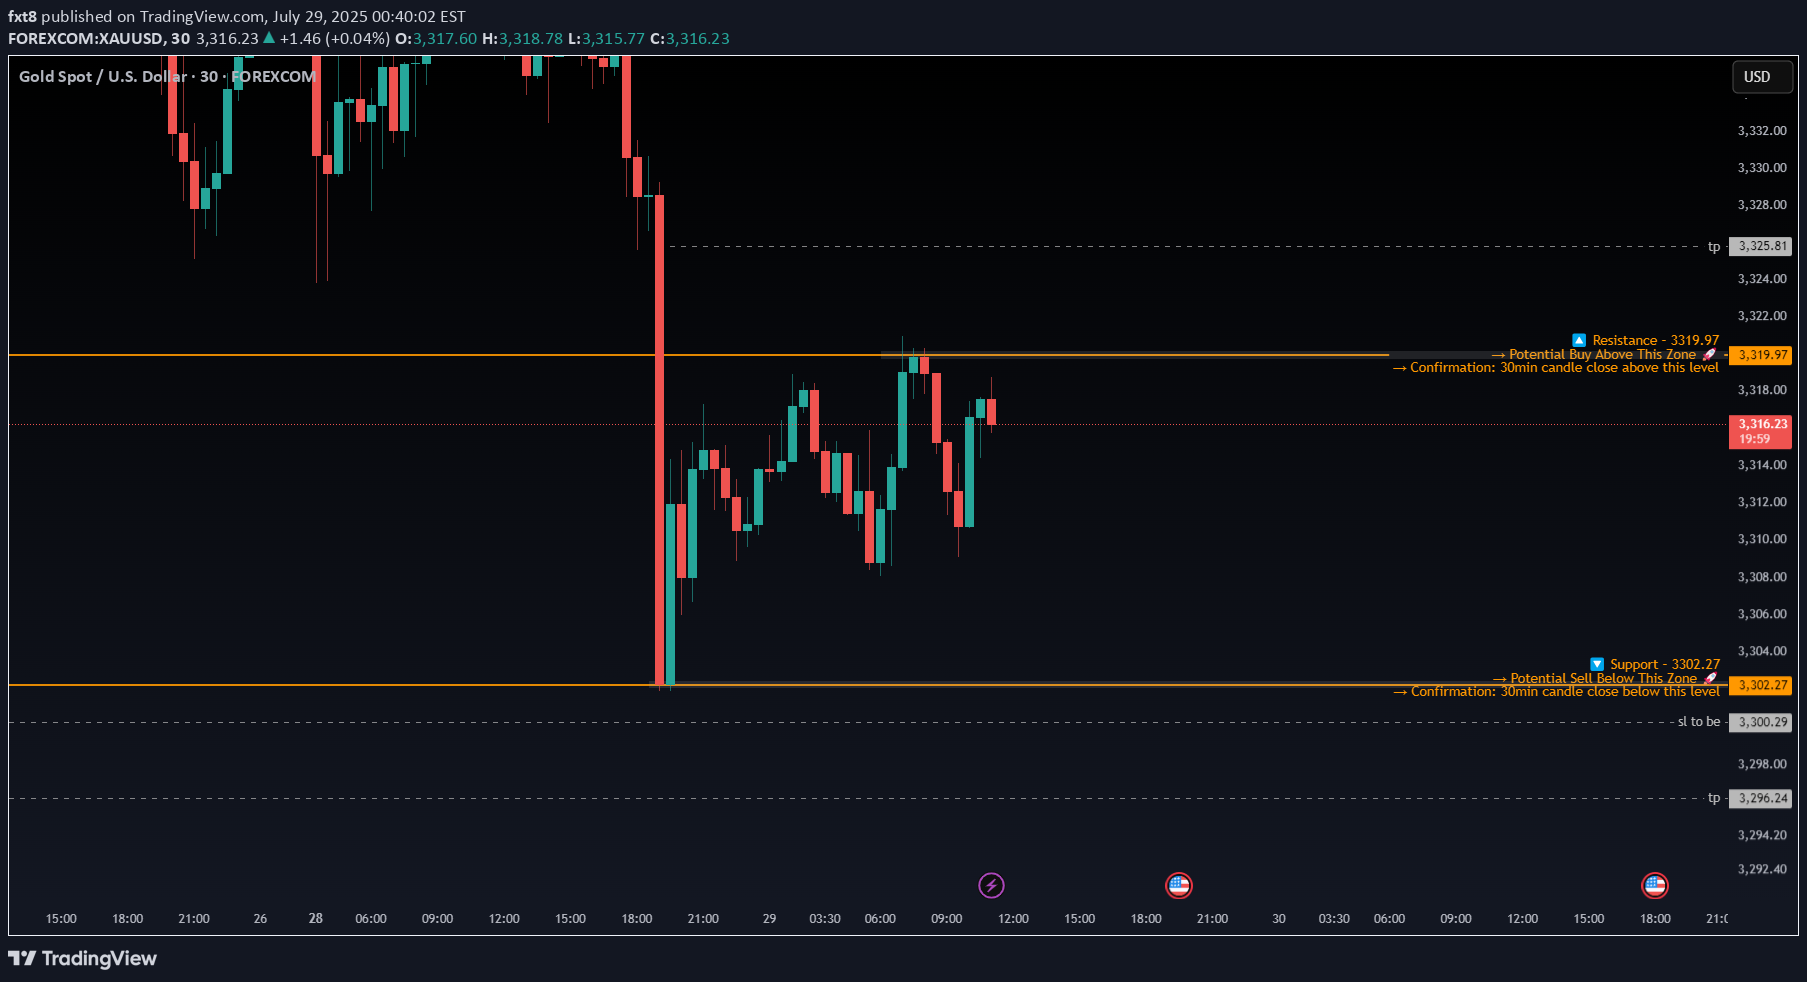
🧠 Clean Price Action Outlook – Patience Until the Range Breaks Currently, price is consolidating between 3319.97 (resistance) and 3302.27 (support) a well defined short-term range that’s been respected multiple times. Both levels are holding firmly, with wicks and reactions showing that buyers and sellers are actively defending these zones. Right now, I'm not interested in trading inside this chop zone there's too much noise and no clear directional conviction. My focus is on waiting for price to break cleanly out of the range with confirmation. 📈 Bullish Scenario (Buy Plan): If price breaks and closes above 3319.97 on the 30-minute timeframe, that would be the first sign of bullish strength. Ideally, I want to see: A strong bullish candle close above 3319.97 Follow-through in the next candle (not a fakeout or wick trap) Volume pickup or price holding above the level during retest 📍 If this happens, I’ll look to enter long trades on confirmation, with a potential target around 3325.81, which is the next minor resistance. SL would ideally be placed just below the breakout candle or the breakout zone itself depending on the price structure at the time. 📉 Bearish Scenario (Sell Plan): On the flip side, if price breaks down below 3302.27 and closes below it on the 30-minute chart, that opens the door for shorts. Here’s what I want to see: A full candle body close below the level (not just a wick spike) Possibly a retest + rejection of 3302.27 from below Weak price action around the level confirming sellers are in control If that plays out, I’ll consider short entries with an SL above the structure (around 3304+), and a first target around 3296.00, where there’s minor demand. ⚠️ Until Then – No Trade Zone Until we get a confirmed breakout, I’m staying out. No point guessing which side will win the market will show us.
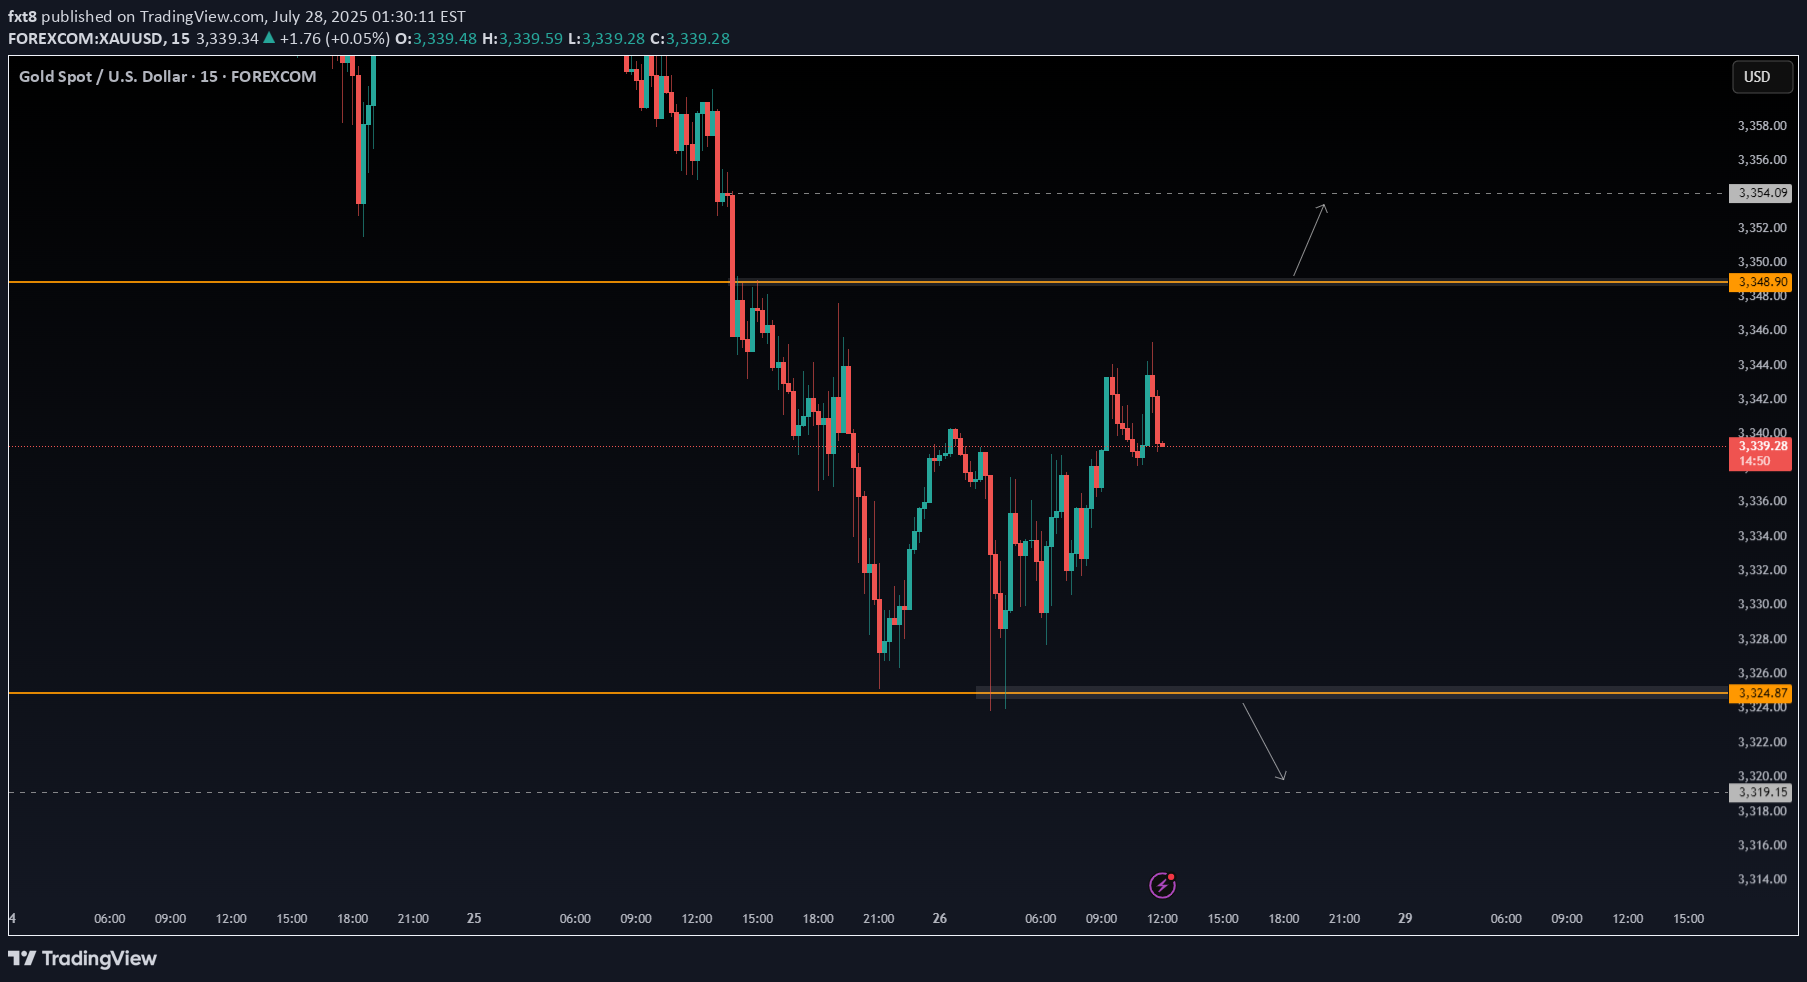
Price is stuck in a range between 3348.90 and 3324.87. 📌 Looking for a clean breakout to take action: Buy above 3348.90 → Targeting 3354.09 Sell below 3324.87 → Targeting 3319.15 Not interested in any trades inside the range only jumping in once we break out and close outside either level. Waiting for confirmation to avoid getting chopped up. Let’s see where it goes. 📉📈 No rush, just reacting.
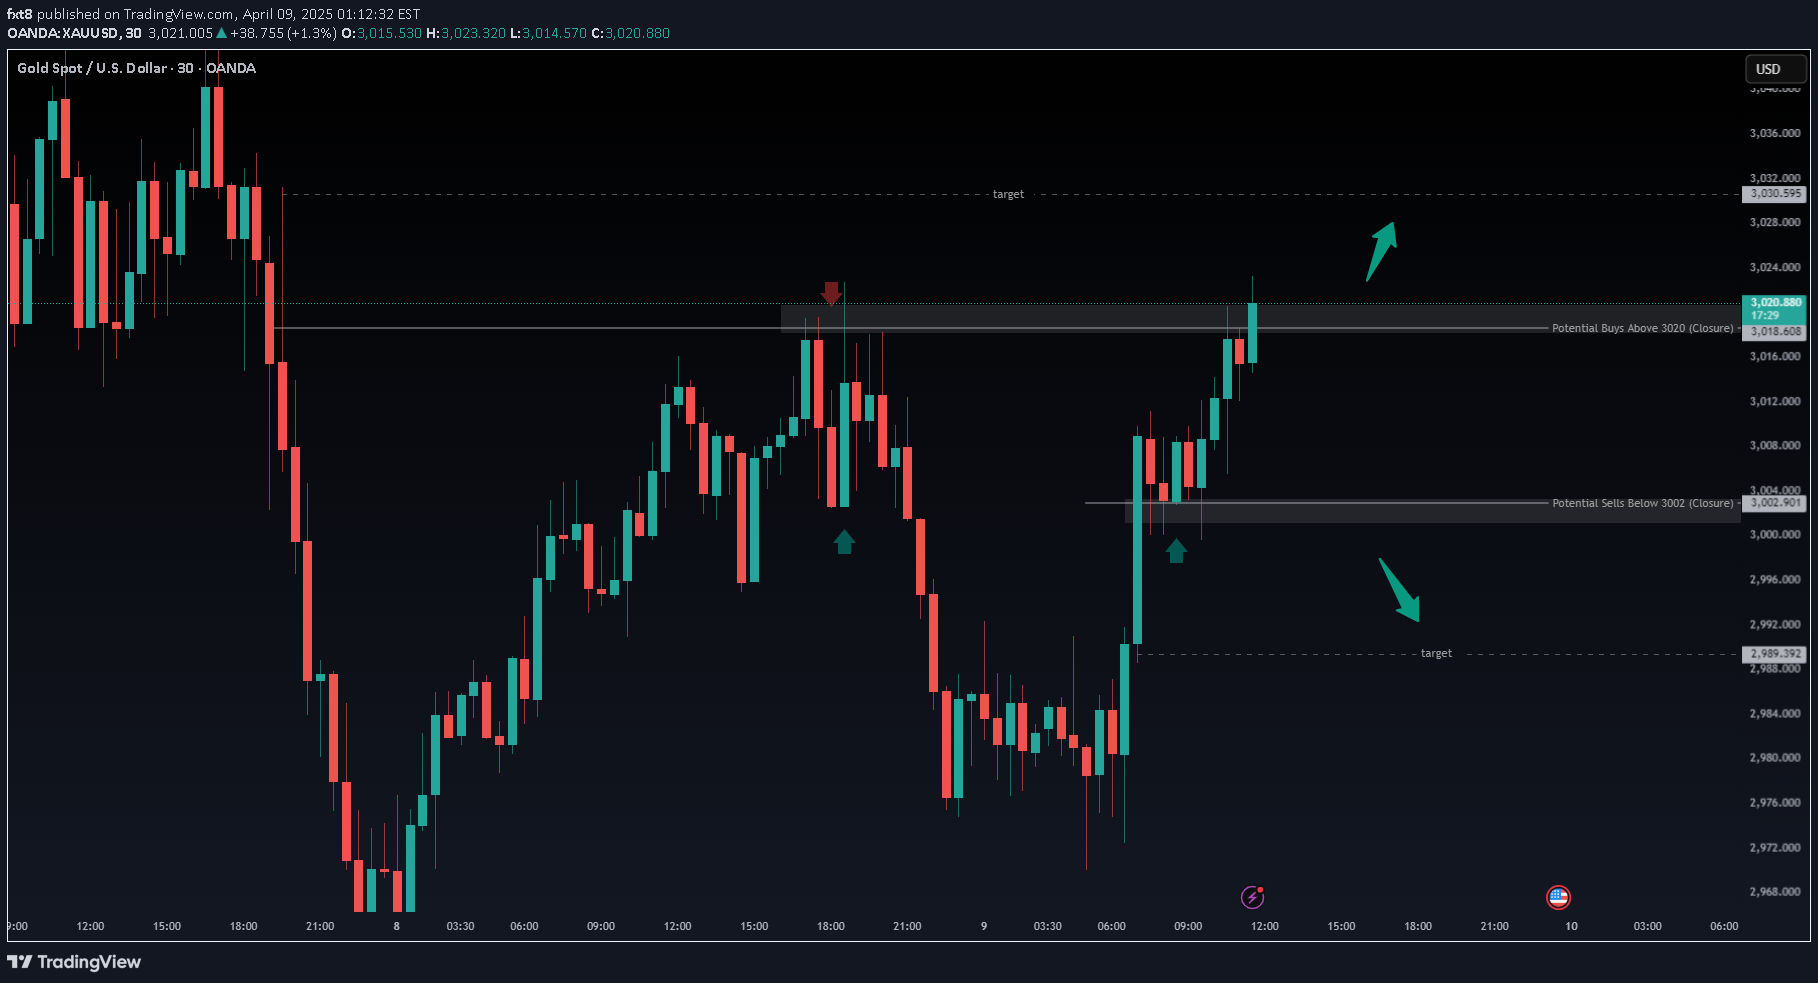
Price is currently breaking above the key resistance zone around 3020, which has acted as a strong supply area in the past. A clean close above this level could open up bullish momentum towards the next target zone around 3030-3031. However, failure to hold above 3020 could trigger a pullback or a potential sell-off back towards the 3002-2989 demand area. Plan: Potential Buys: Above 3020 closure confirmation Potential Sells: Below 3002 closure confirmation Watch price action closely around these levels for confirmation.
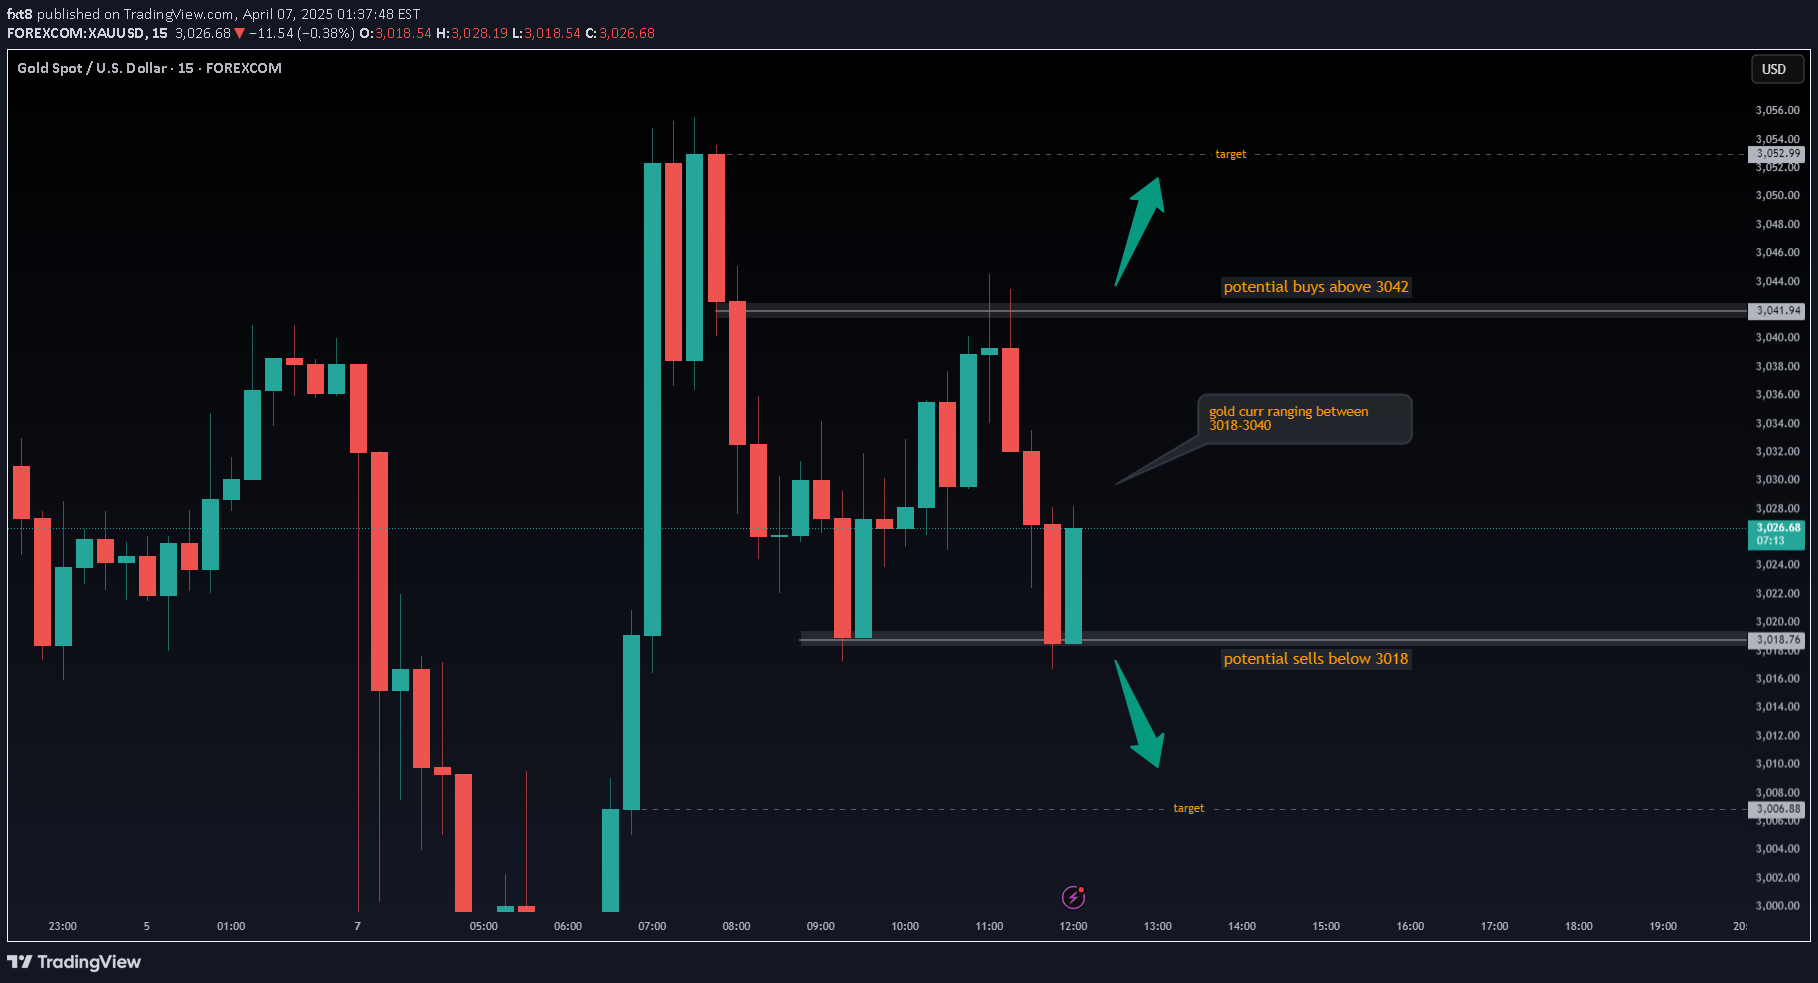
Gold is currently trading within a narrow range between 3018 and 3040, reflecting clear indecision in the market. This sideways consolidation suggests neither buyers nor sellers are fully in control, with price temporarily caught in a holding pattern. Key levels to watch: •Potential buys above 3042: A confirmed break and hold above this level could open the door toward 3052 and beyond, especially if momentum kicks in. This area may attract breakout traders eyeing continuation toward previous highs. •Potential sells below 3018: A clean breakdown under this support could trigger sharp downside, targeting levels around 3010 or even 3000 depending on follow-through volume and sentiment. For now, price is respecting both edges of the range. Be cautious of fakeouts near the boundaries—wait for confirmation and clean structure before jumping in. Ranging conditions like this often precede significant moves, so staying patient could pay off big.
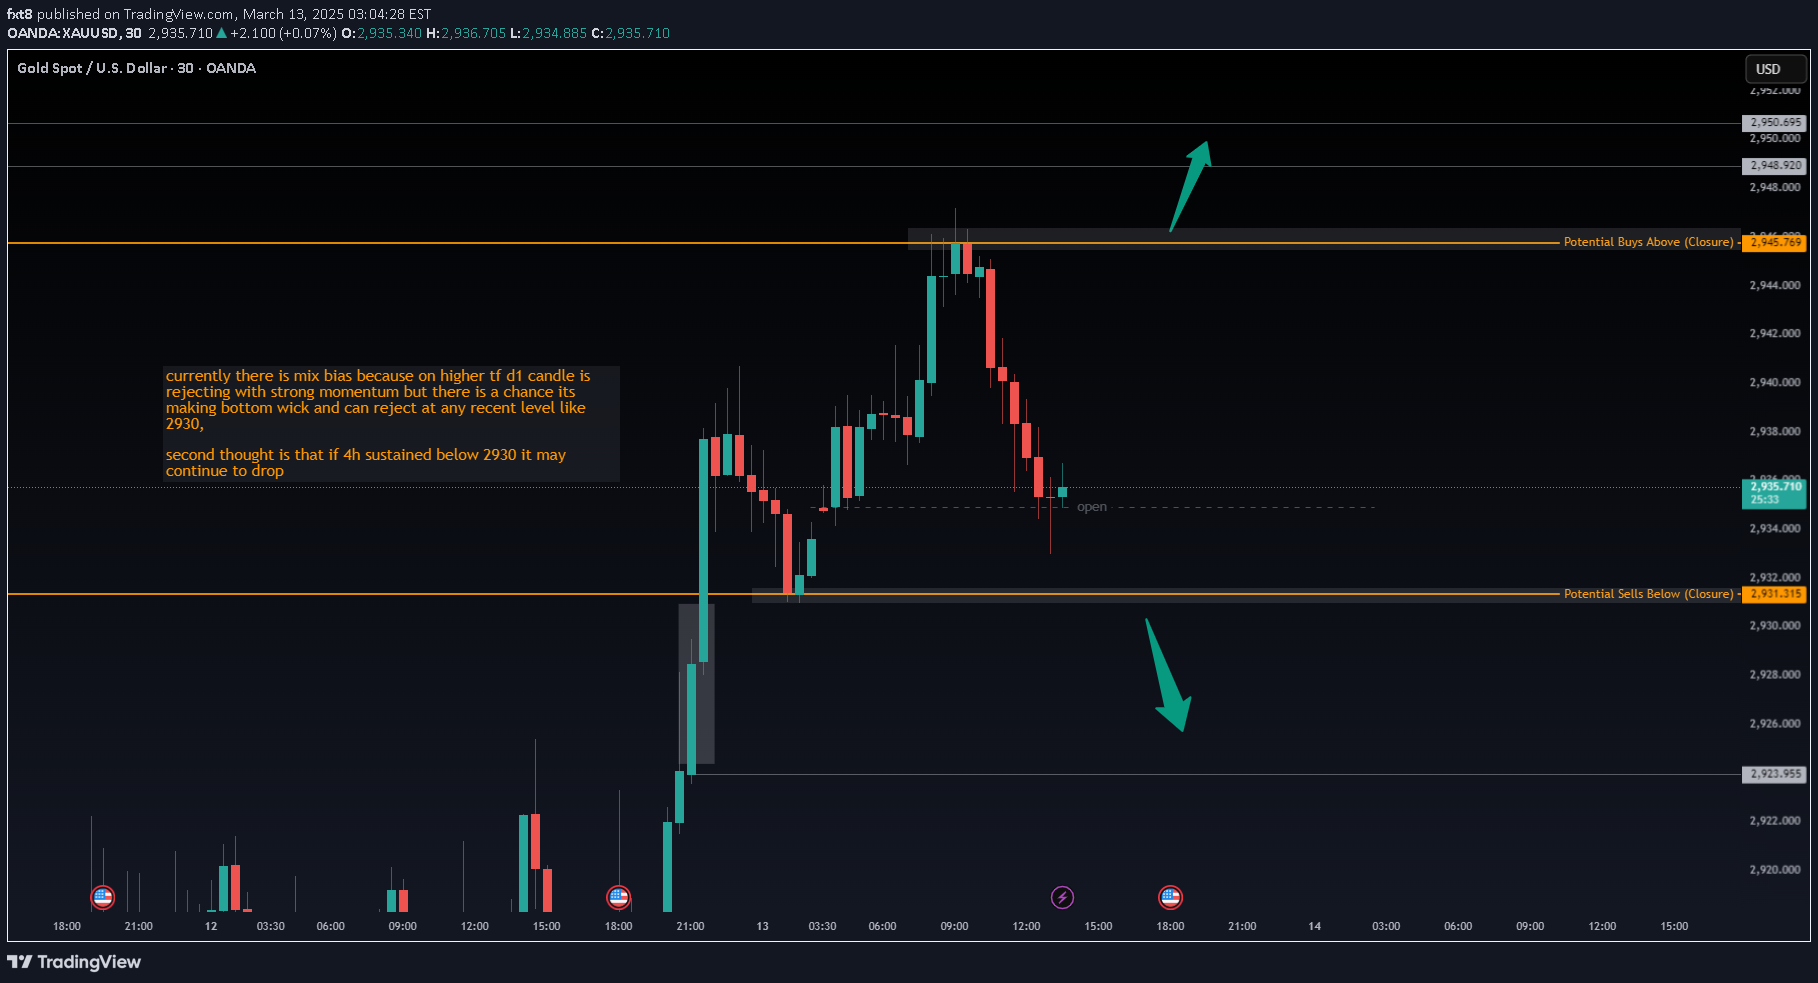
Currently, there is mixed bias in the market. On the higher timeframe (D1), the candle is rejecting with strong momentum, indicating selling pressure. However, there is also a possibility that it is forming a bottom wick, which could lead to a rejection from key levels like 2930. Key Observations: If 2930 acts as support, we may see a bounce, leading to a potential upside move. If 4H sustains below 2930, it could indicate further downside continuation. Trade Setup: 30m 🔹 Buy above 2045 if price shows bullish confirmation. 🔹 Sell below 2030 if price sustains under this level. 📊 Waiting for price action confirmation before entering a trade.
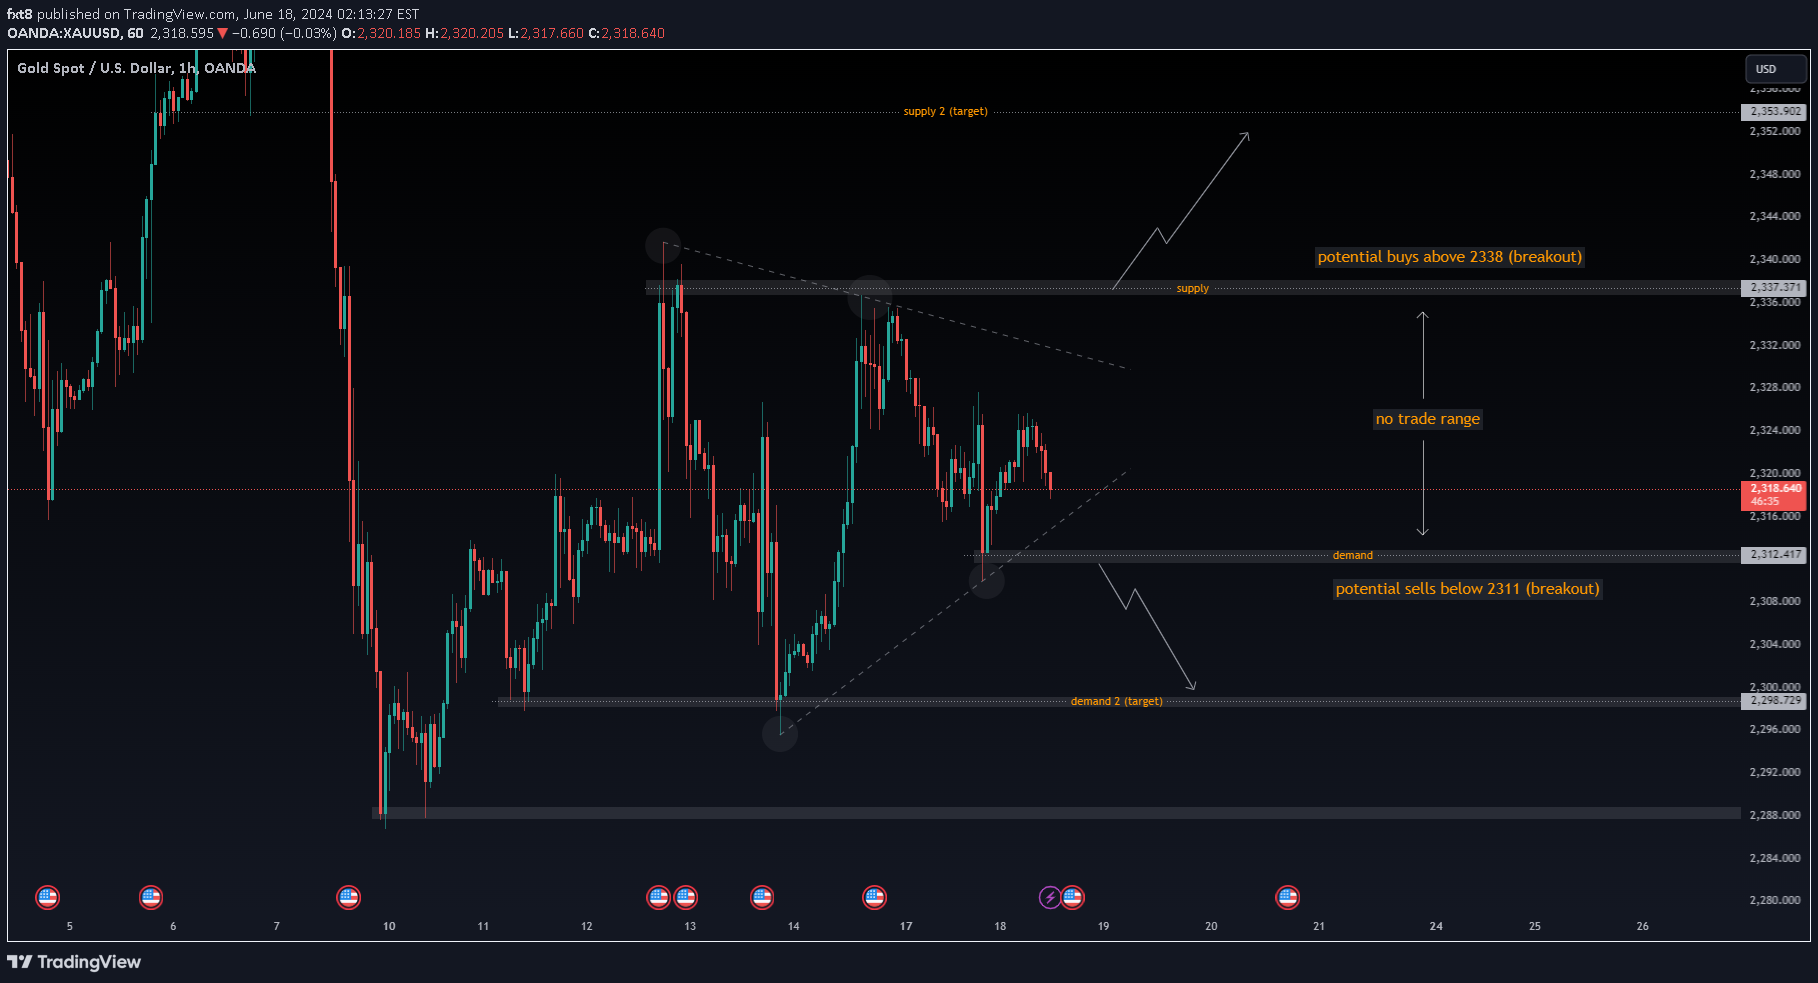
Xauusd is making triangle pattern on 1 hour timeframe, if price breaks above the supply level (2338) the target will be 2353, if it breaks below the demand level (2311) target will be 2298, always wait for a clean breakout and wait for candle to close outside the range or the levels marked on the chart.
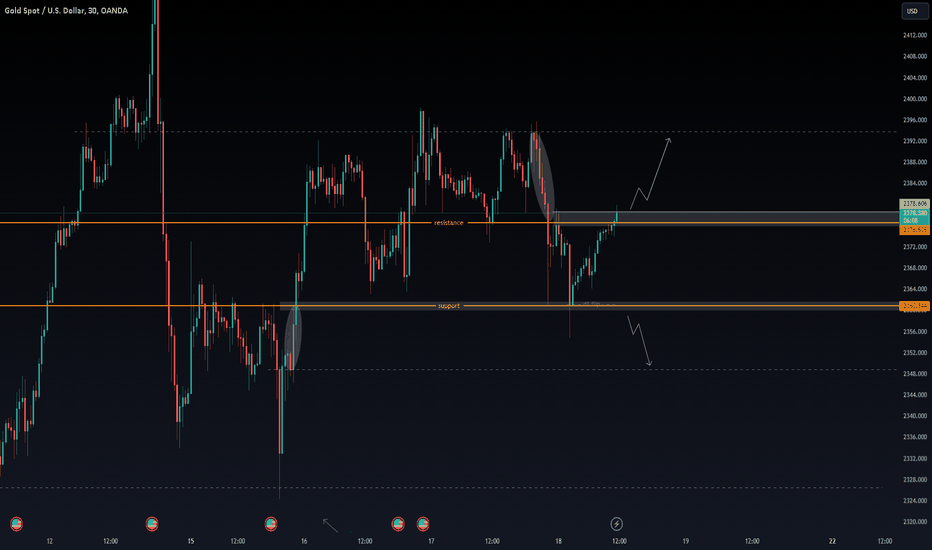
currently gold is in a strong range consolidating between support and resistance, on higher timeframe gold is in uptrend, the analysis is for intraday/scalping, if price breaks above the resistance the target will be 2393.50, it it breaks below support target will be 2349, always wait for a clean breakout and wait for candle to close outside the range.
Disclaimer
Any content and materials included in Sahmeto's website and official communication channels are a compilation of personal opinions and analyses and are not binding. They do not constitute any recommendation for buying, selling, entering or exiting the stock market and cryptocurrency market. Also, all news and analyses included in the website and channels are merely republished information from official and unofficial domestic and foreign sources, and it is obvious that users of the said content are responsible for following up and ensuring the authenticity and accuracy of the materials. Therefore, while disclaiming responsibility, it is declared that the responsibility for any decision-making, action, and potential profit and loss in the capital market and cryptocurrency market lies with the trader.