
fsanalysis6
@t_fsanalysis6

What symbols does the trader recommend buying?
Purchase History
پیام های تریدر
Filter
fsanalysis6
fsanalysis6
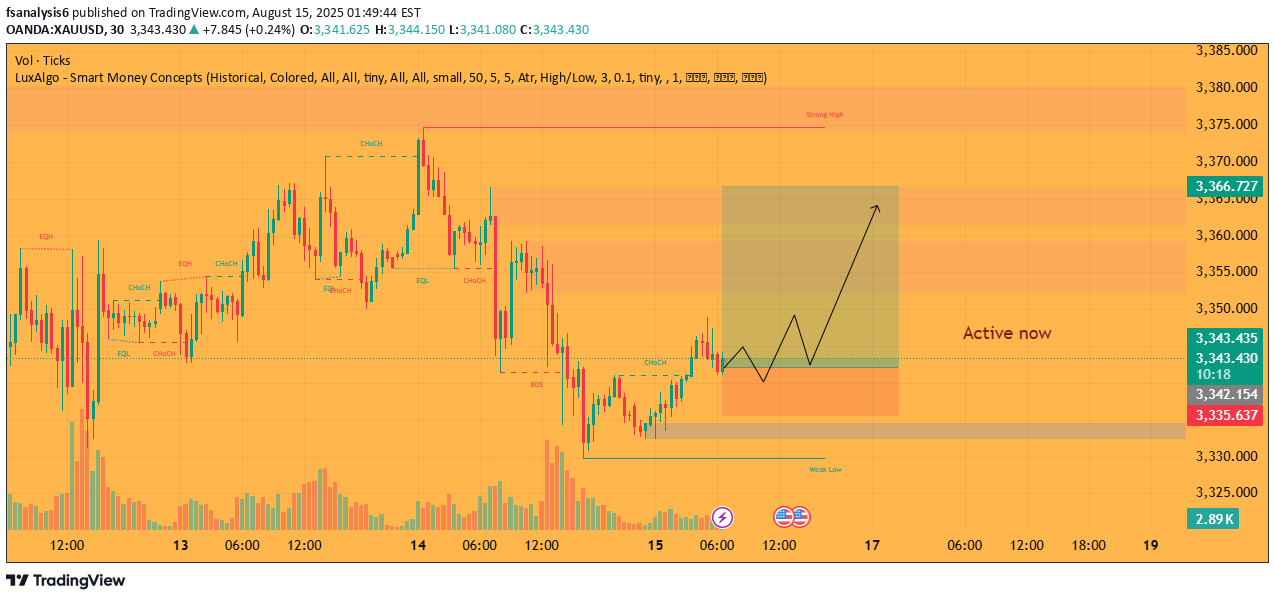
Gold Price Approaching Key Upside Zone
The current setup shows bullish momentum forming after a consolidation phase. Price is moving towards the next resistance zone, with potential for further gains if momentum sustains. Monitor closely and manage exposure to maintain a balanced approach."40% target done, partial exit taken, SL moved to secure trade, rest position running."
fsanalysis6
BTC – Possible Downside Setup with Key Levels
Price action suggests a potential short-term decline, with around a 50% probability for this move. If considering a position, limit exposure to 25% of usual size and monitor reaction at highlighted zones. Watching for confirmation before continuation."Our first move went well, now observing if the market holds this area."
fsanalysis6
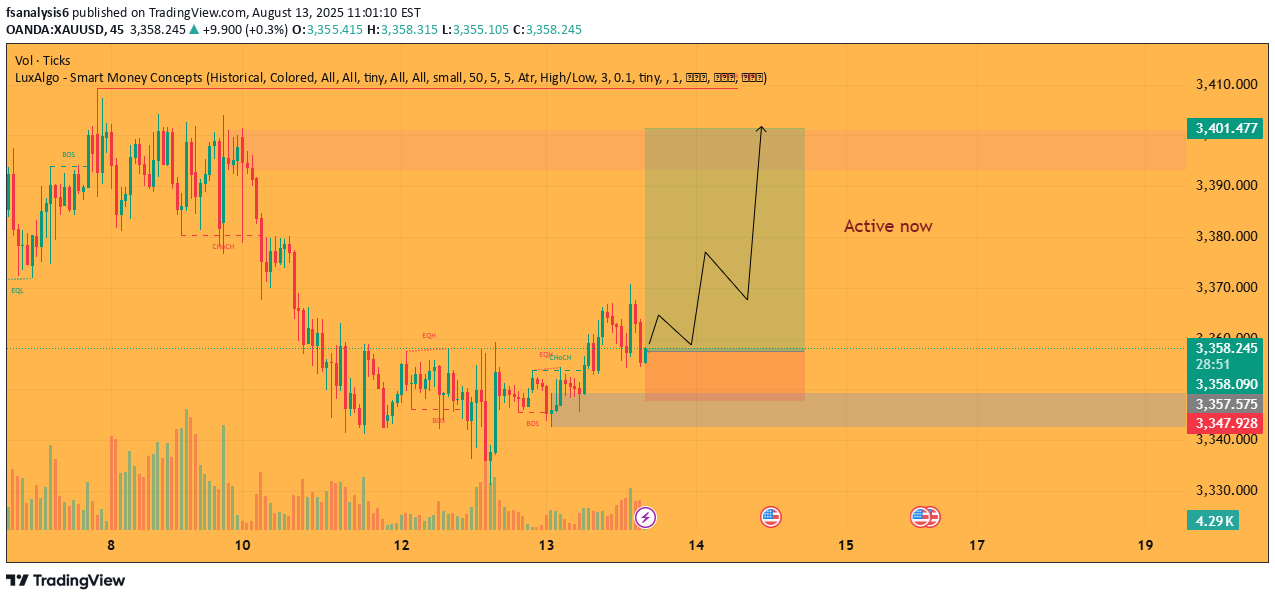
Potential Upside Momentum with Controlled Risk
Price is reacting from the demand zone and showing signs of upward momentum. Projection targets the next resistance area, while keeping exposure limited by minimizing risk to around 35%."Market touched our SL and then moved upward. As mentioned earlier, reducing risk was suggested. Analysis direction was correct, but SL placement was the issue."
fsanalysis6
Key Support Levels in Focus
Price is approaching important support areas. If the highlighted zone holds, a potential upward move can be expected. In case of a deeper test, the lower support area offers another opportunity. Monitoring closely and managing position size can help reduce exposure during high market pressure.Price may test our highlighted zone. Risk is set at 30% as current market conditions show selling pressure. This makes it a strong area of interest that should be monitored closely."📊 35% target completed. 🔄 Stop moved closer to entry for reduced exposure. ⏳ Monitoring for further progress."
fsanalysis6
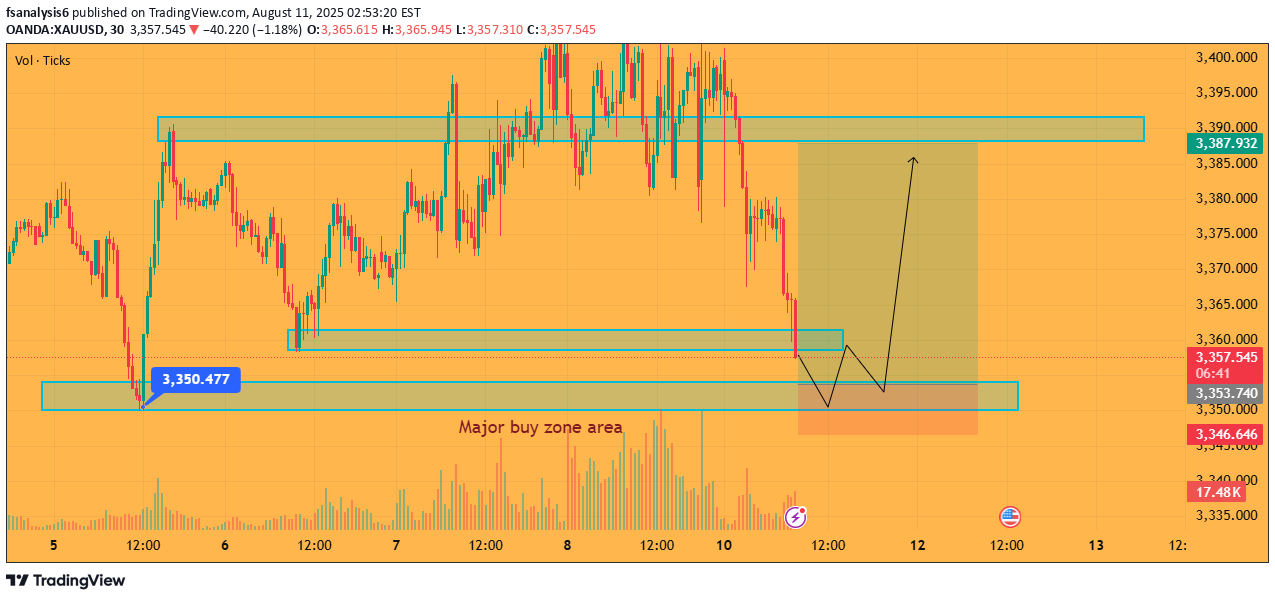
XAUUSD Intraday Bullish Setup – Risk Managed
fsanalysis6
Gold Price Outlook – Key Zones for Next Week
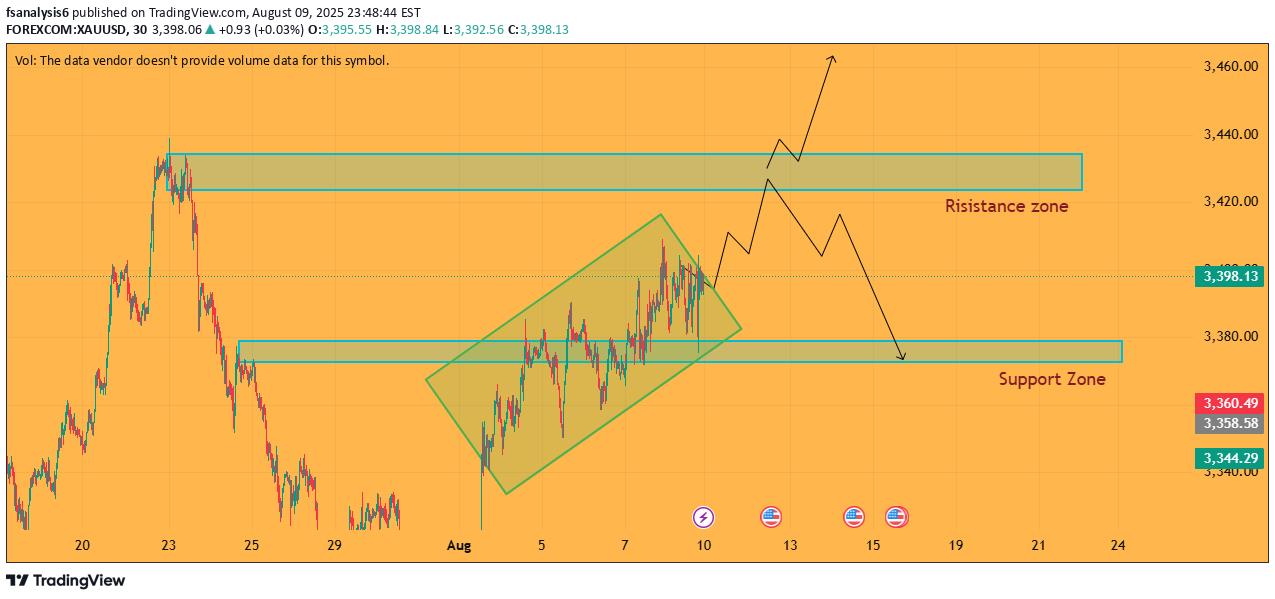
The market is currently moving within a rising channel. Next week, price action may test the highlighted resistance zone near 3,420–3,440 or revisit the support zone around 3,380–3,360. We will observe for additional confirmation before taking any position, aiming for better entry levels and improved probability setups.
fsanalysis6
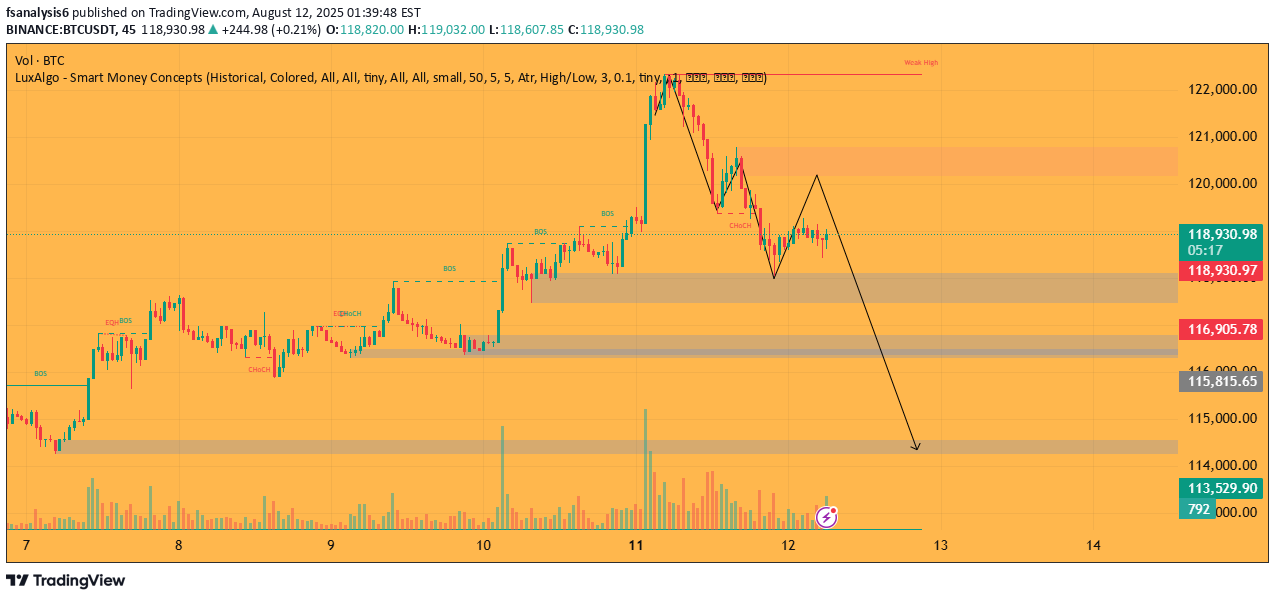
BTC Potential Downside Setup
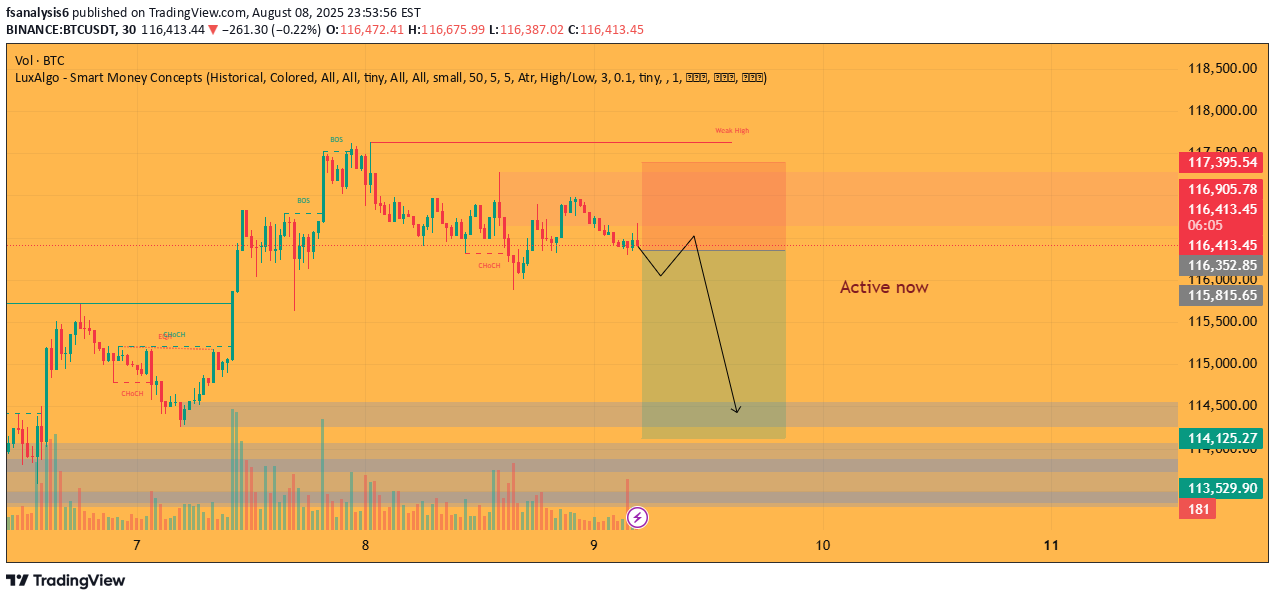
Price is moving within a marked zone with signs of weakness near the recent high. Structure suggests a possible continuation toward lower support areas. Monitoring closely with reduced position size to limit exposure.Stop loss triggered as the 50% zone was confirmed. That’s why I mentioned earlier to keep the risk very low. No problem — we will find a better zone and aim for gains.
fsanalysis6
BTC Potential Downside Move from Current Zone
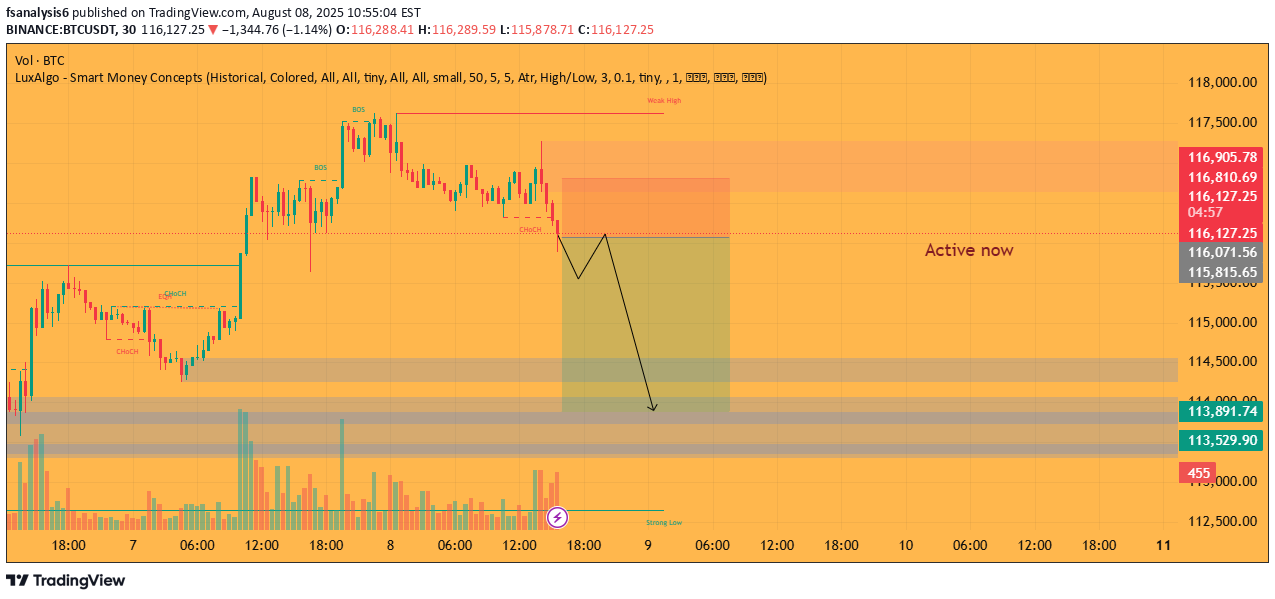
Price is showing a break in structure with a possible short-term pullback before continuation toward the lower demand area. Risk parameters adjusted for a safer entry. Monitoring volume and reaction near the highlighted zones for confirmation.
fsanalysis6
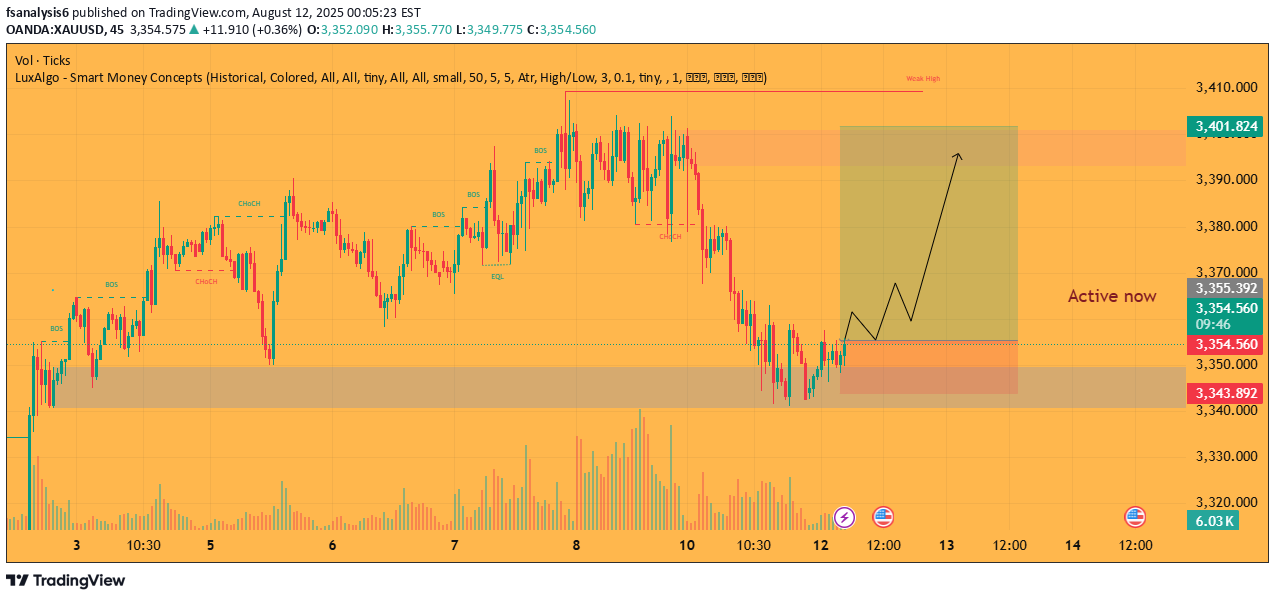
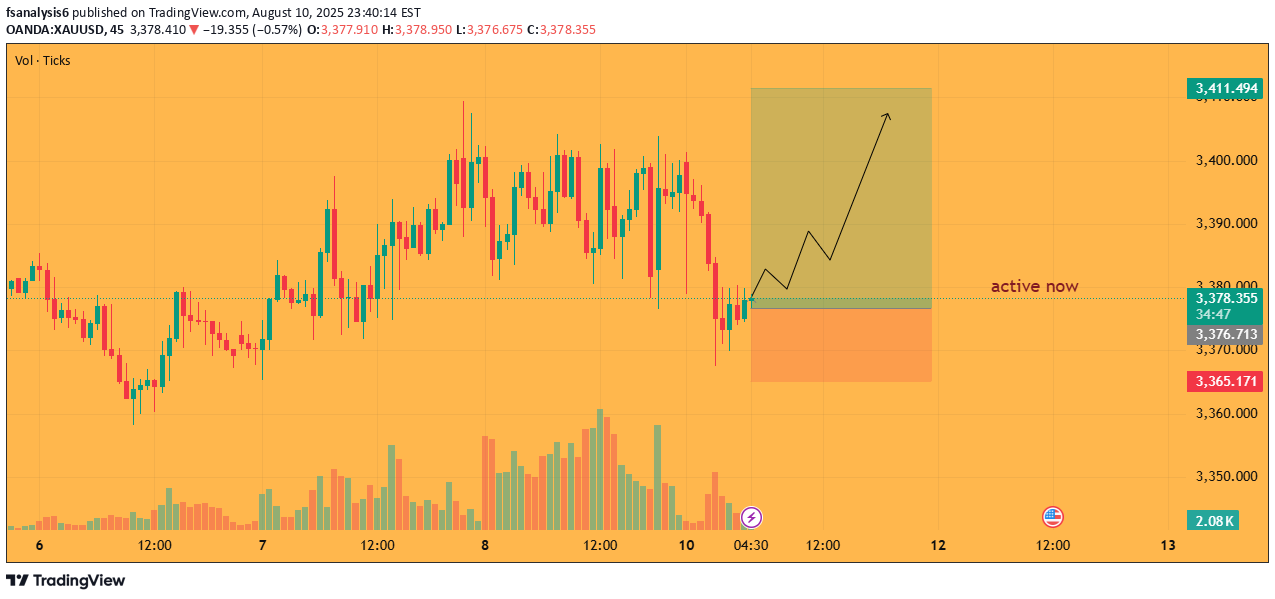
XAUUSD – Bullish Setup from Demand Zone
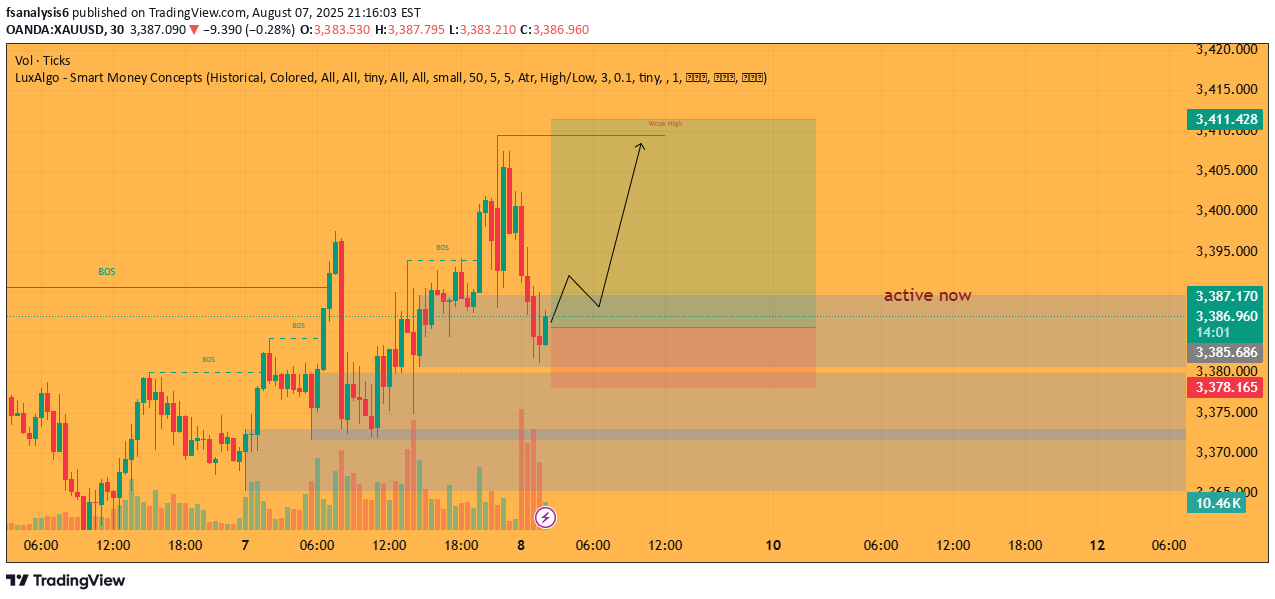
Price is reacting within the highlighted demand area after a clean structure break. If momentum holds, a potential move toward the recent high is in play. Monitoring price behavior for continuation toward upper levels.📊 Target almost 40% completed. 🔄 Stop moved closer to reduce risk. ⏳ Monitoring momentum for further progress.Price has moved close to the projected buy zone target, reaching around 80% of the expected move. Monitoring for final completion.
Disclaimer
Any content and materials included in Sahmeto's website and official communication channels are a compilation of personal opinions and analyses and are not binding. They do not constitute any recommendation for buying, selling, entering or exiting the stock market and cryptocurrency market. Also, all news and analyses included in the website and channels are merely republished information from official and unofficial domestic and foreign sources, and it is obvious that users of the said content are responsible for following up and ensuring the authenticity and accuracy of the materials. Therefore, while disclaiming responsibility, it is declared that the responsibility for any decision-making, action, and potential profit and loss in the capital market and cryptocurrency market lies with the trader.