
fract
@t_fract

What symbols does the trader recommend buying?
Purchase History
پیام های تریدر
Filter
Signal Type
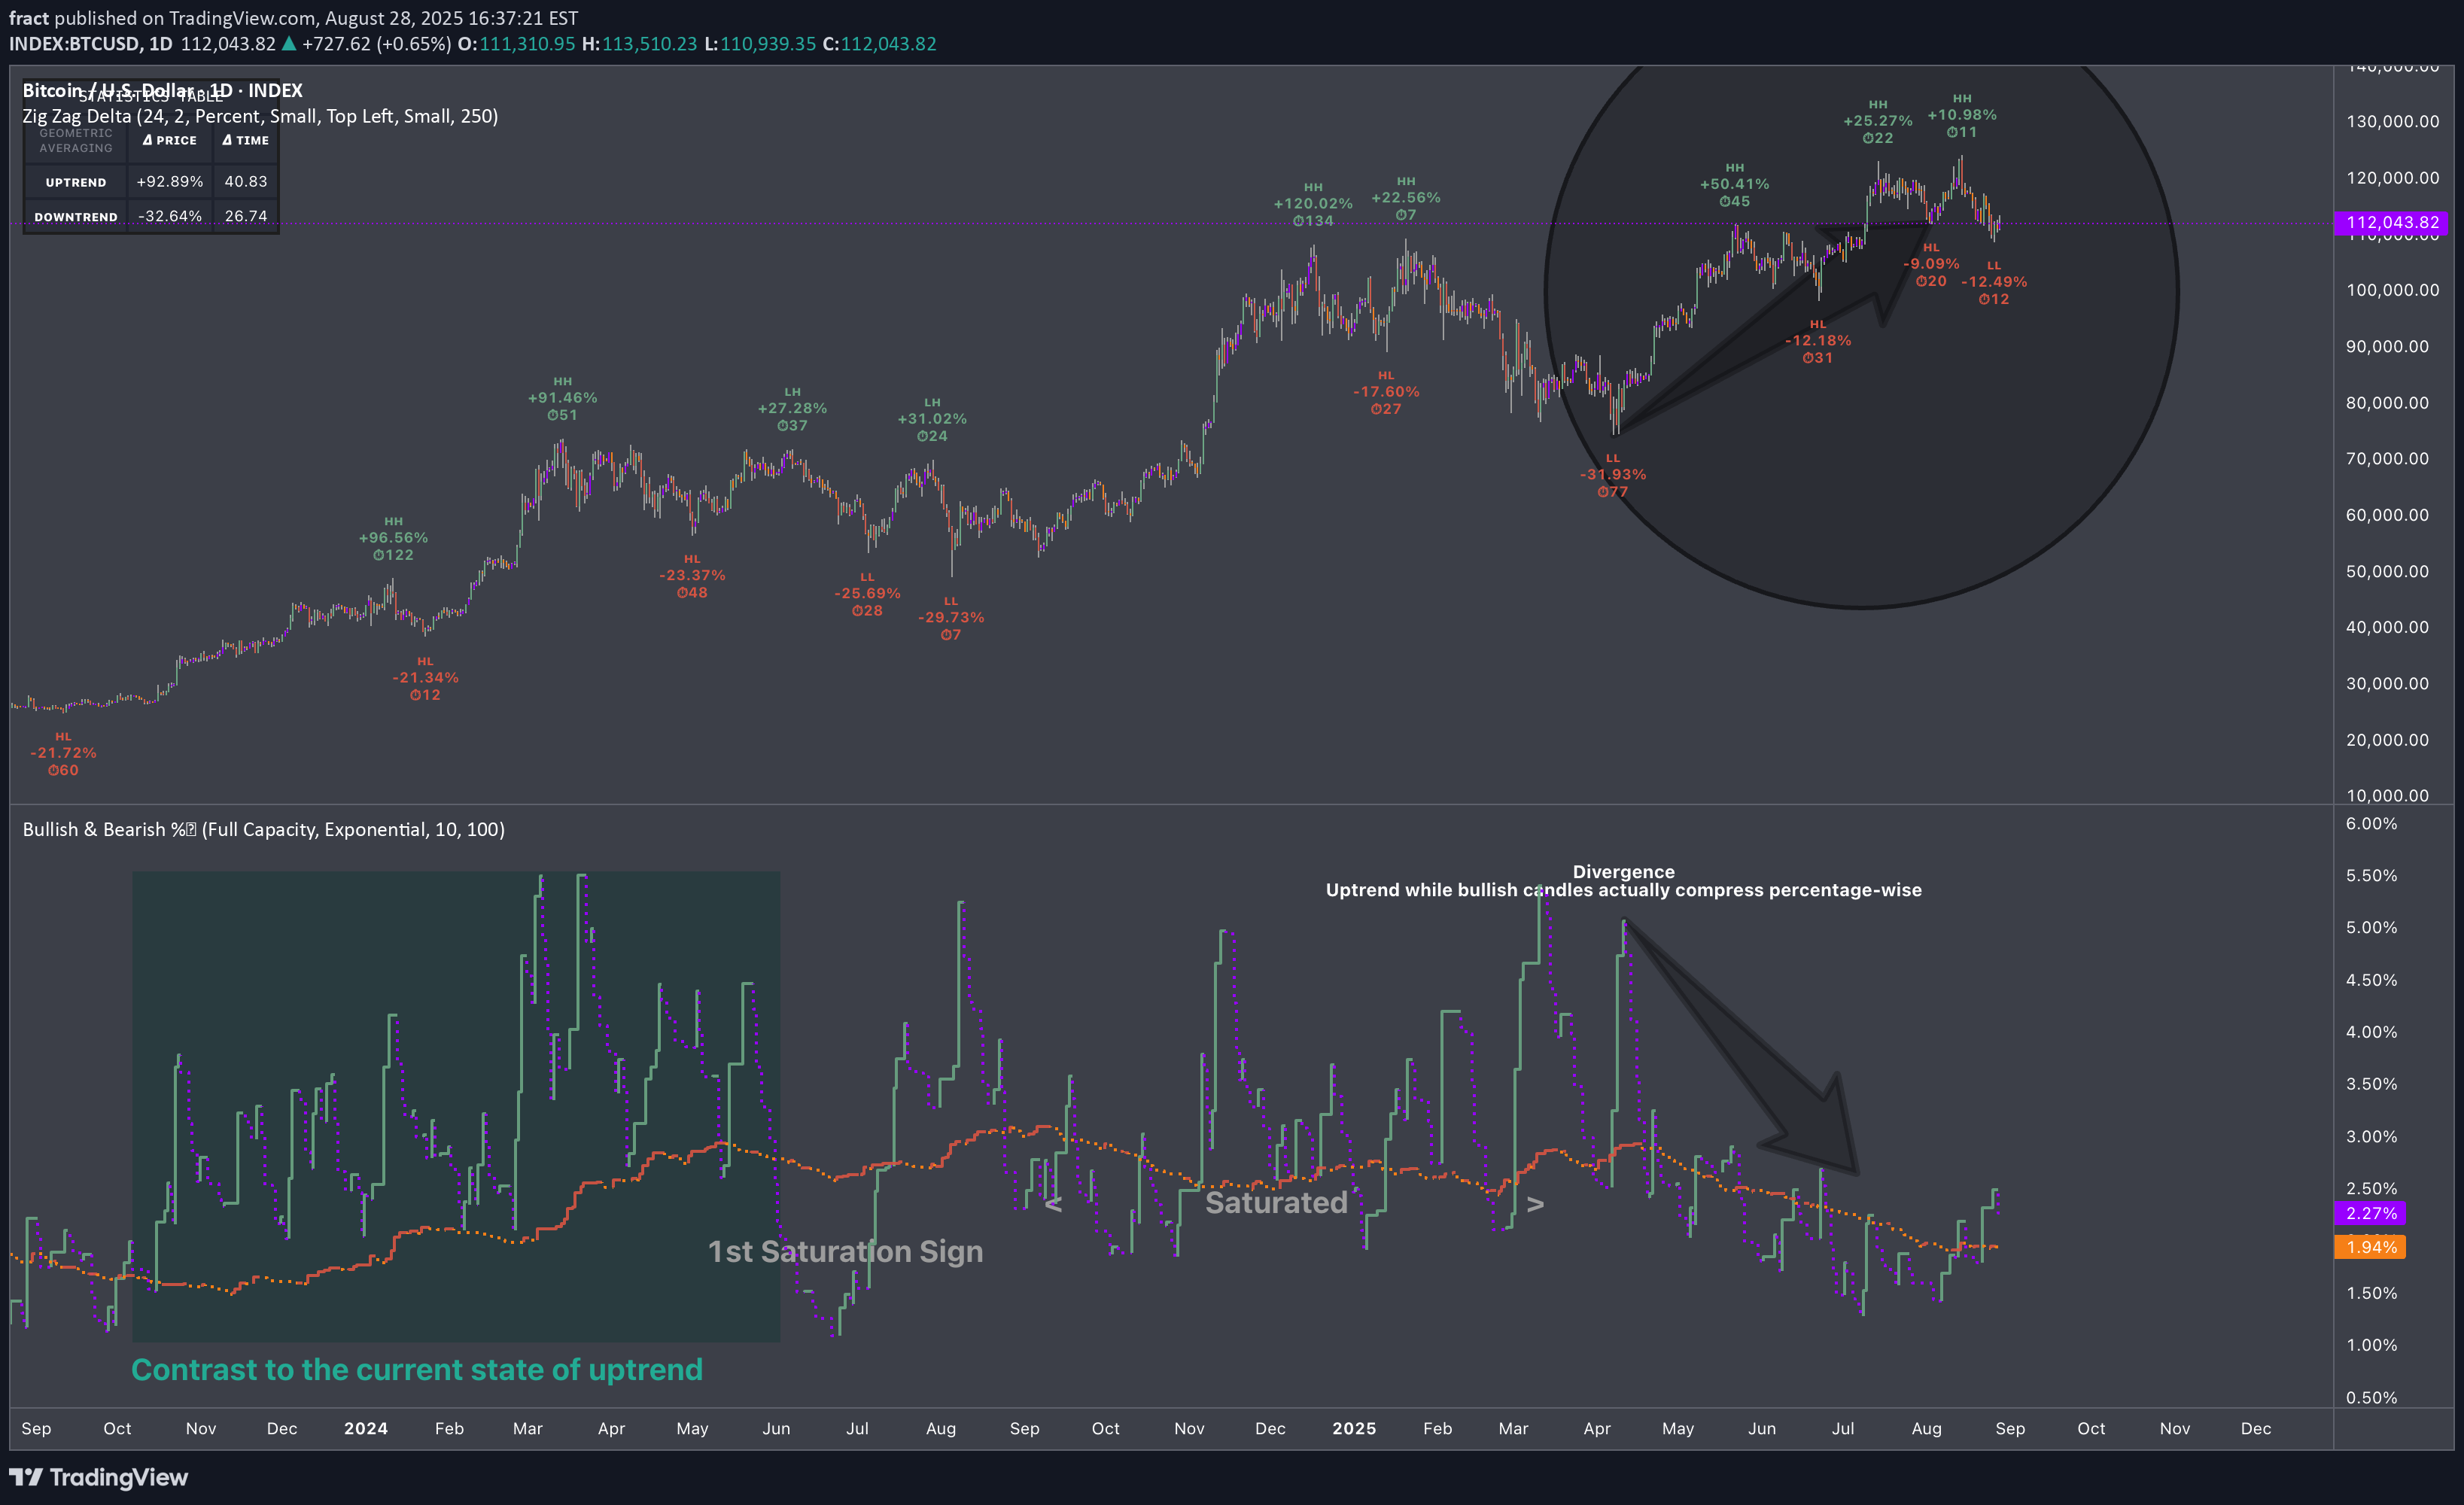
⚖️ Research Notes Documenting other features of "Average Bullish & Bearish Percentage Change" indicator where Bar Metrics is set to Full Capacity. Asymmetric Conditional Averaging For a quick example, I'll leave bulls at default 10 and change number of past bearish candles to 100. Since the indicator targets candles by classification which is divided by the previous price (to work out the change) before averaging, that makes the data scalable. (So no matter how high we increase the averaging number, it still will preserve the scaling laws of that historic range that comes with output) When opposite market force is averaged at higher number of past candles, it becomes a threshold, giving a unique perspective when comparing phases of uptrend at bigger scales.
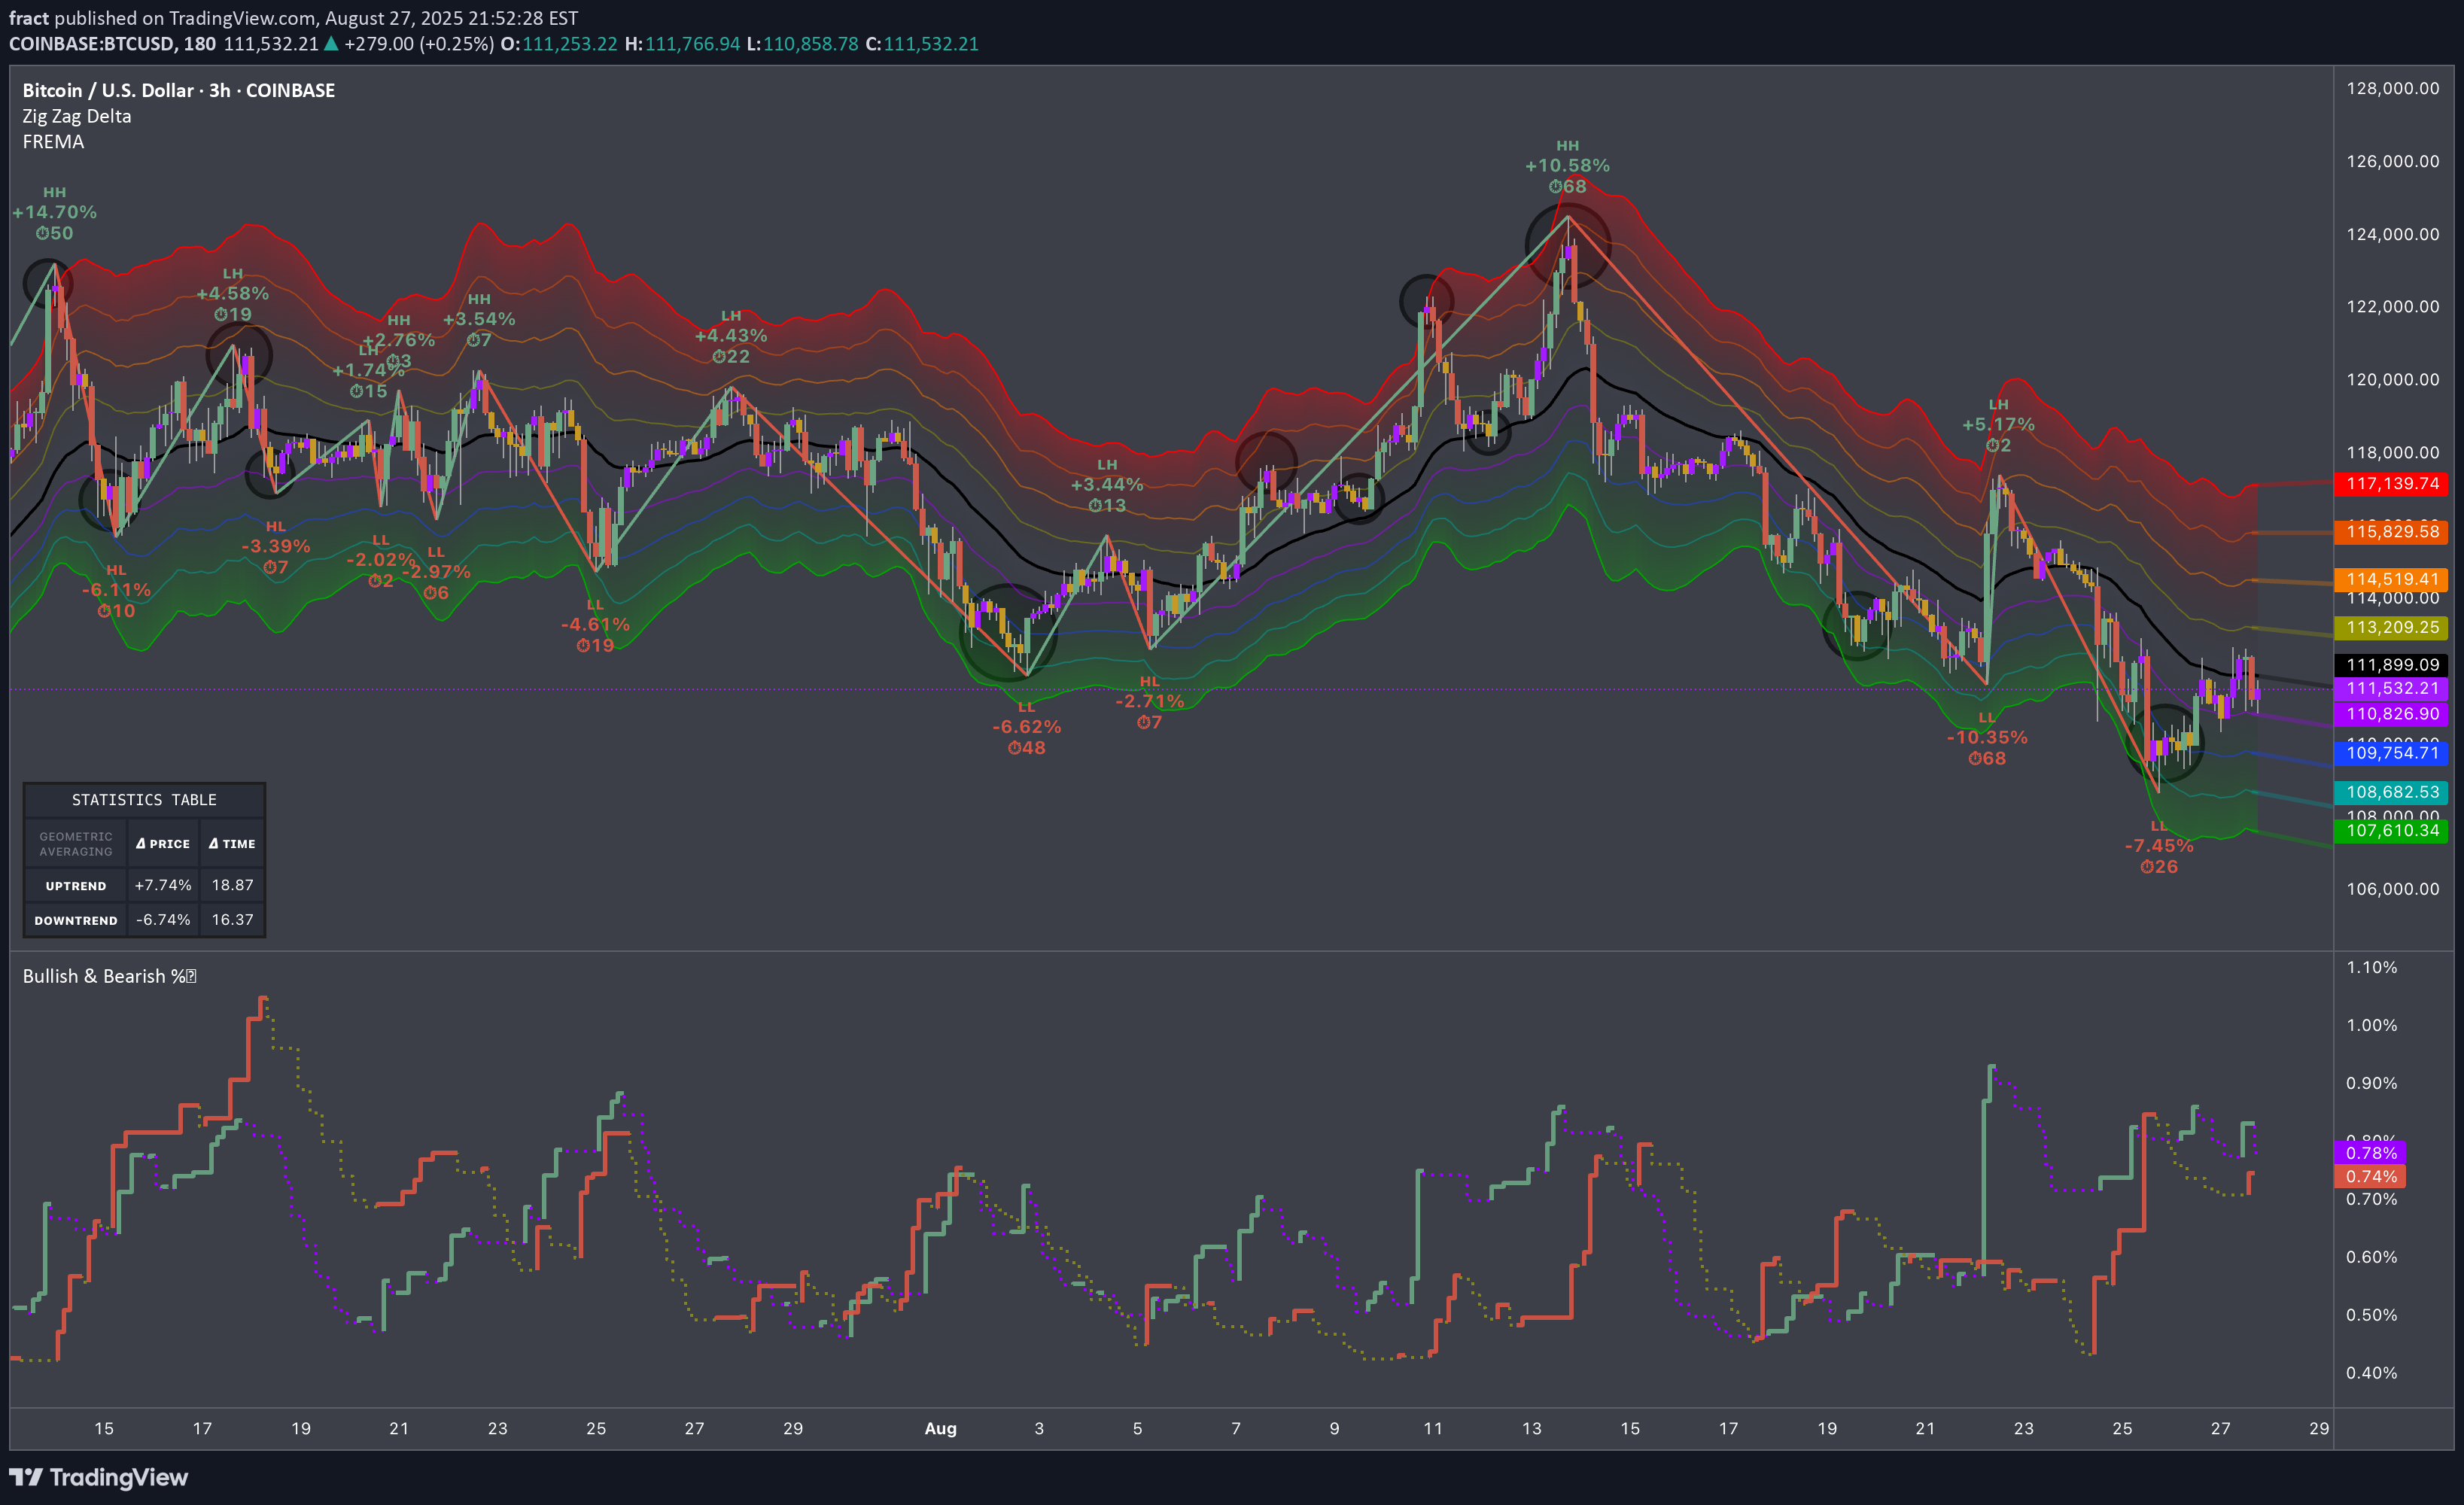
🏛️ Research Notes Average Bullish & Bearish Percentage Change colors bullish candles violet when avg % change falls, respectfully bearish candles are colored yellow when they shrink. It's important to be aware of these transitions ahead of reversals. They can be filtered into signals by FREMA . I'd pay attention to bullish decay while there is liquidity at upper half, and bearish decay at lower half.
🏛️ Research Notes Continuation of the research on role of historically inherited angles and structure memory Original Structure BG Surgery ResonationStats show average of all historic swings
🏛️ Research Notes Exploring non-linear dynamics Original Structure After witnessing the outcome I was intrigued to see how extended narrative would look like. Logical Continuation
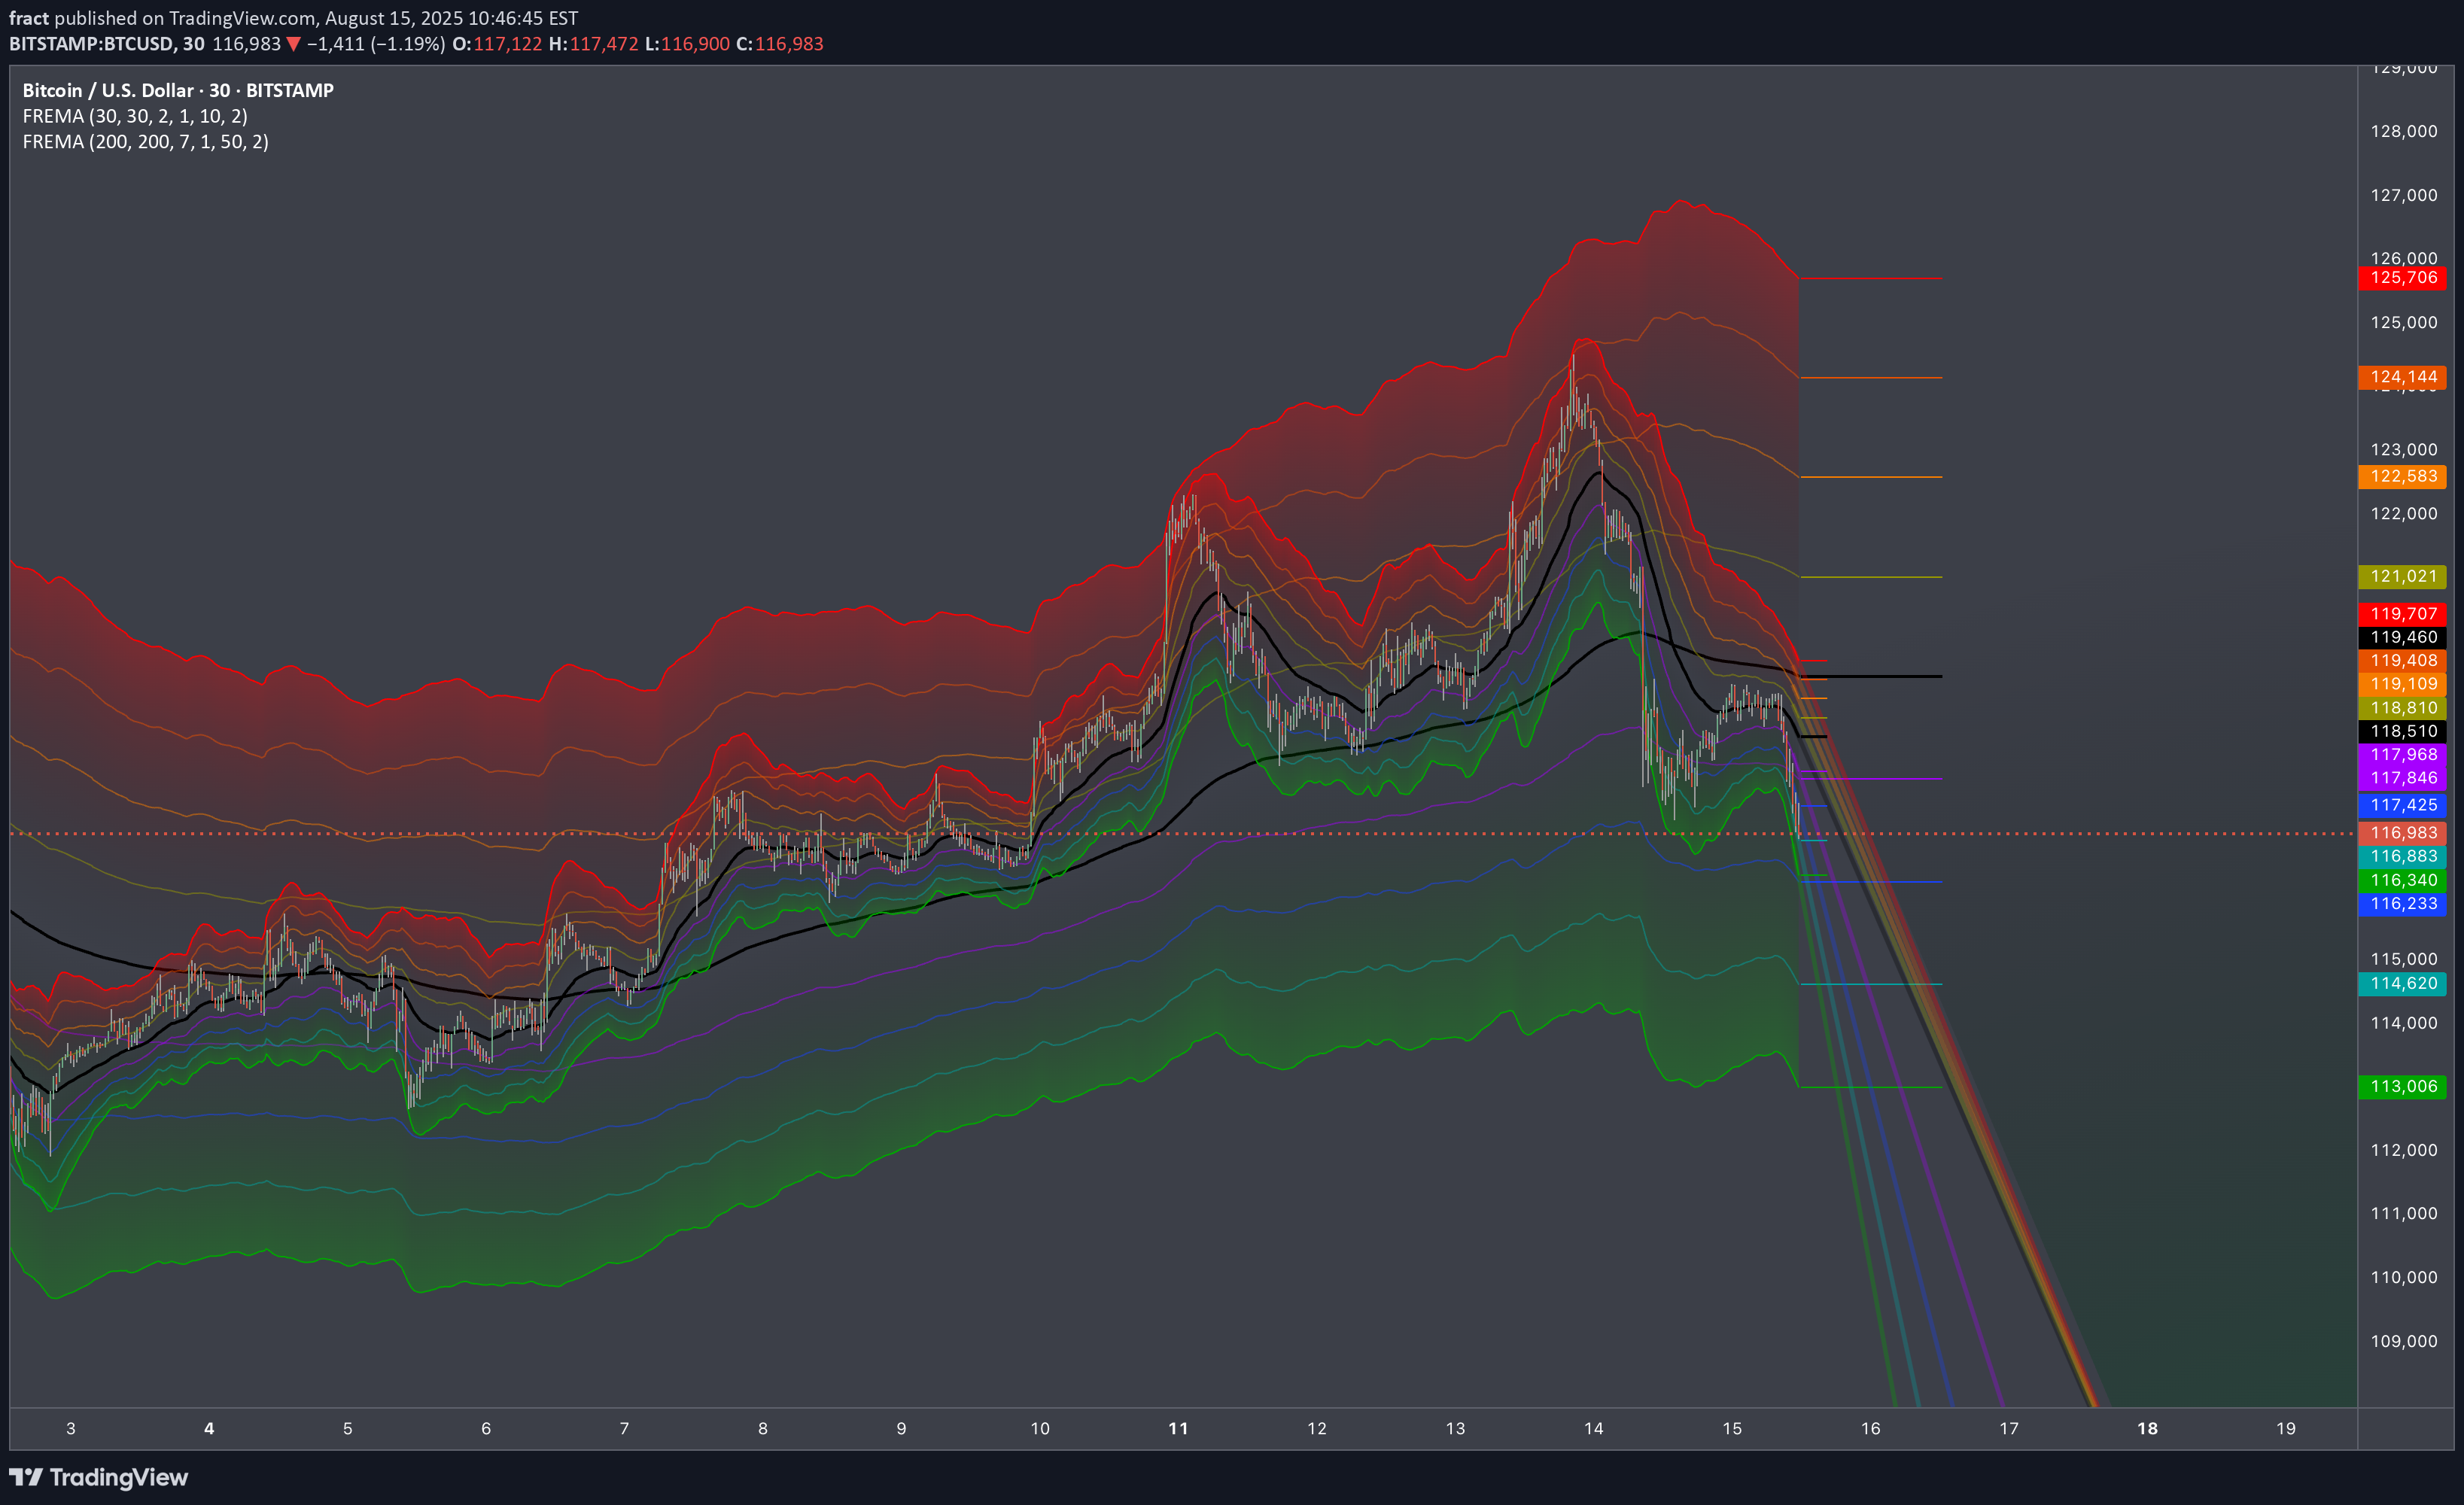
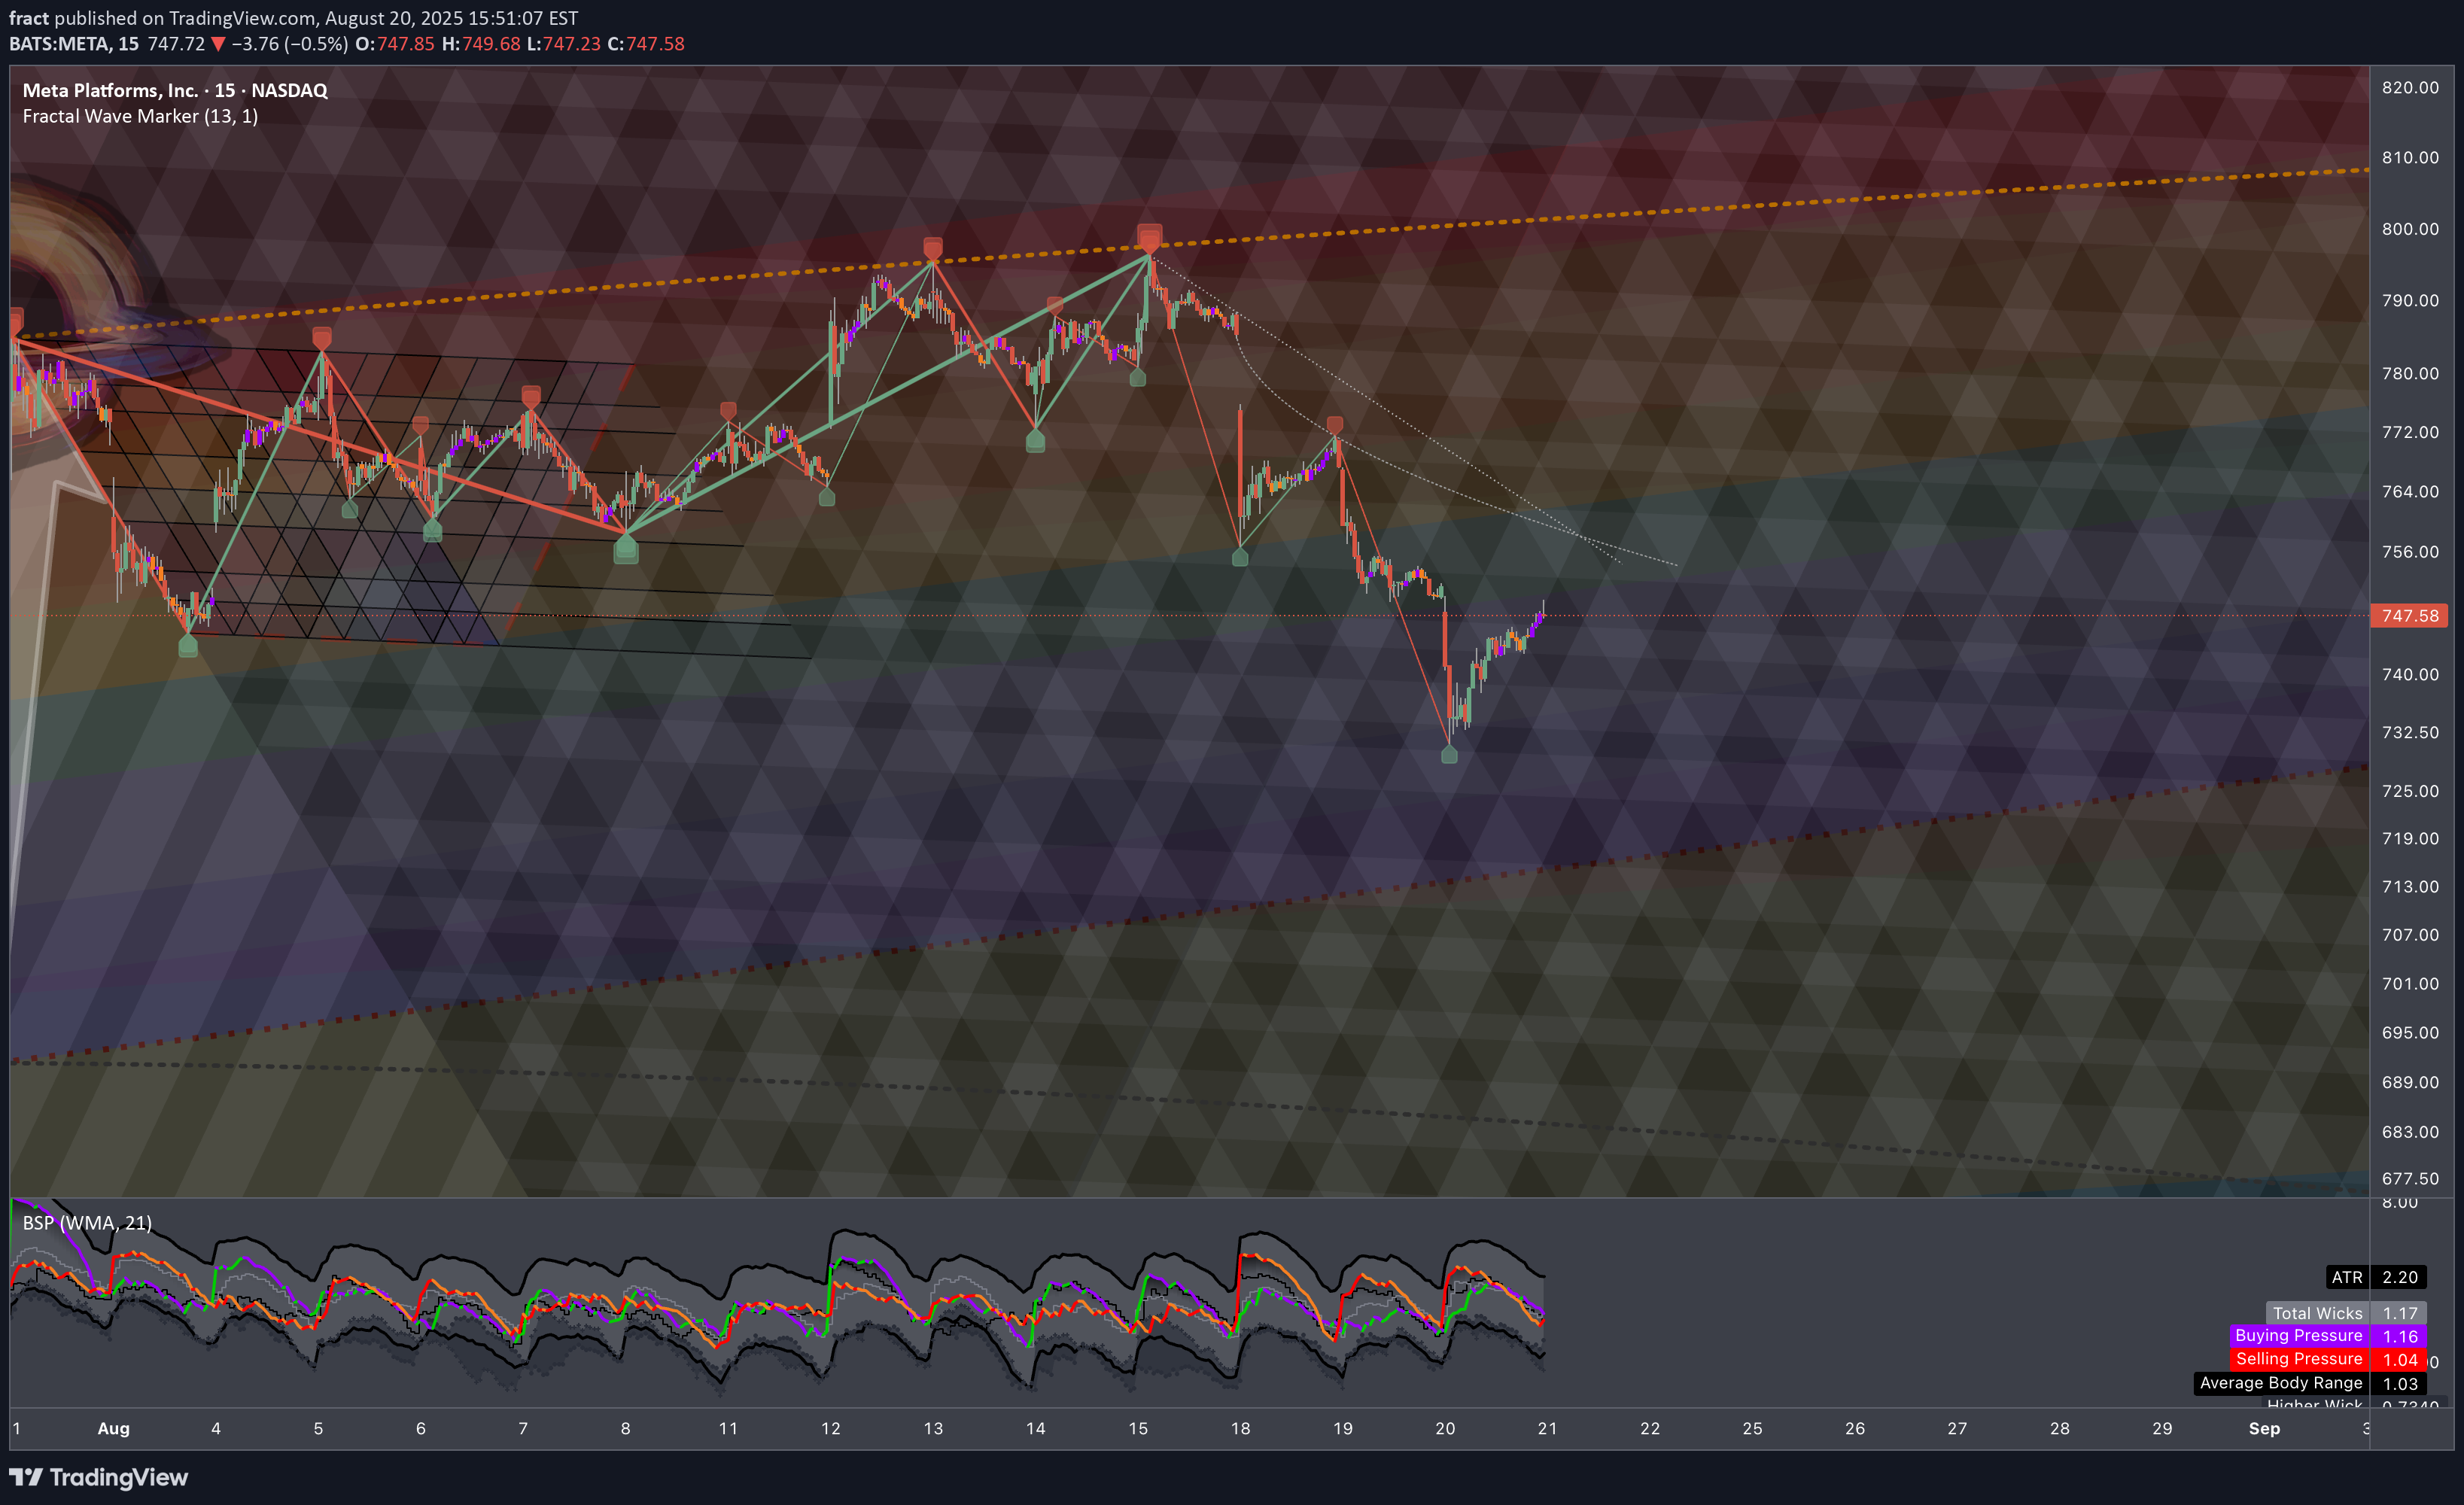
🏛️ Research Notes Experiment with two BSP-powered volatility bands to produce multi-scale levels. To cover the local scope I'd use 30 for averaging both price and volatility with multiplier 2: For broader scale I'd pick 200 with factor 7 Monitoring behavior of price near horizontal and extended angular bands.

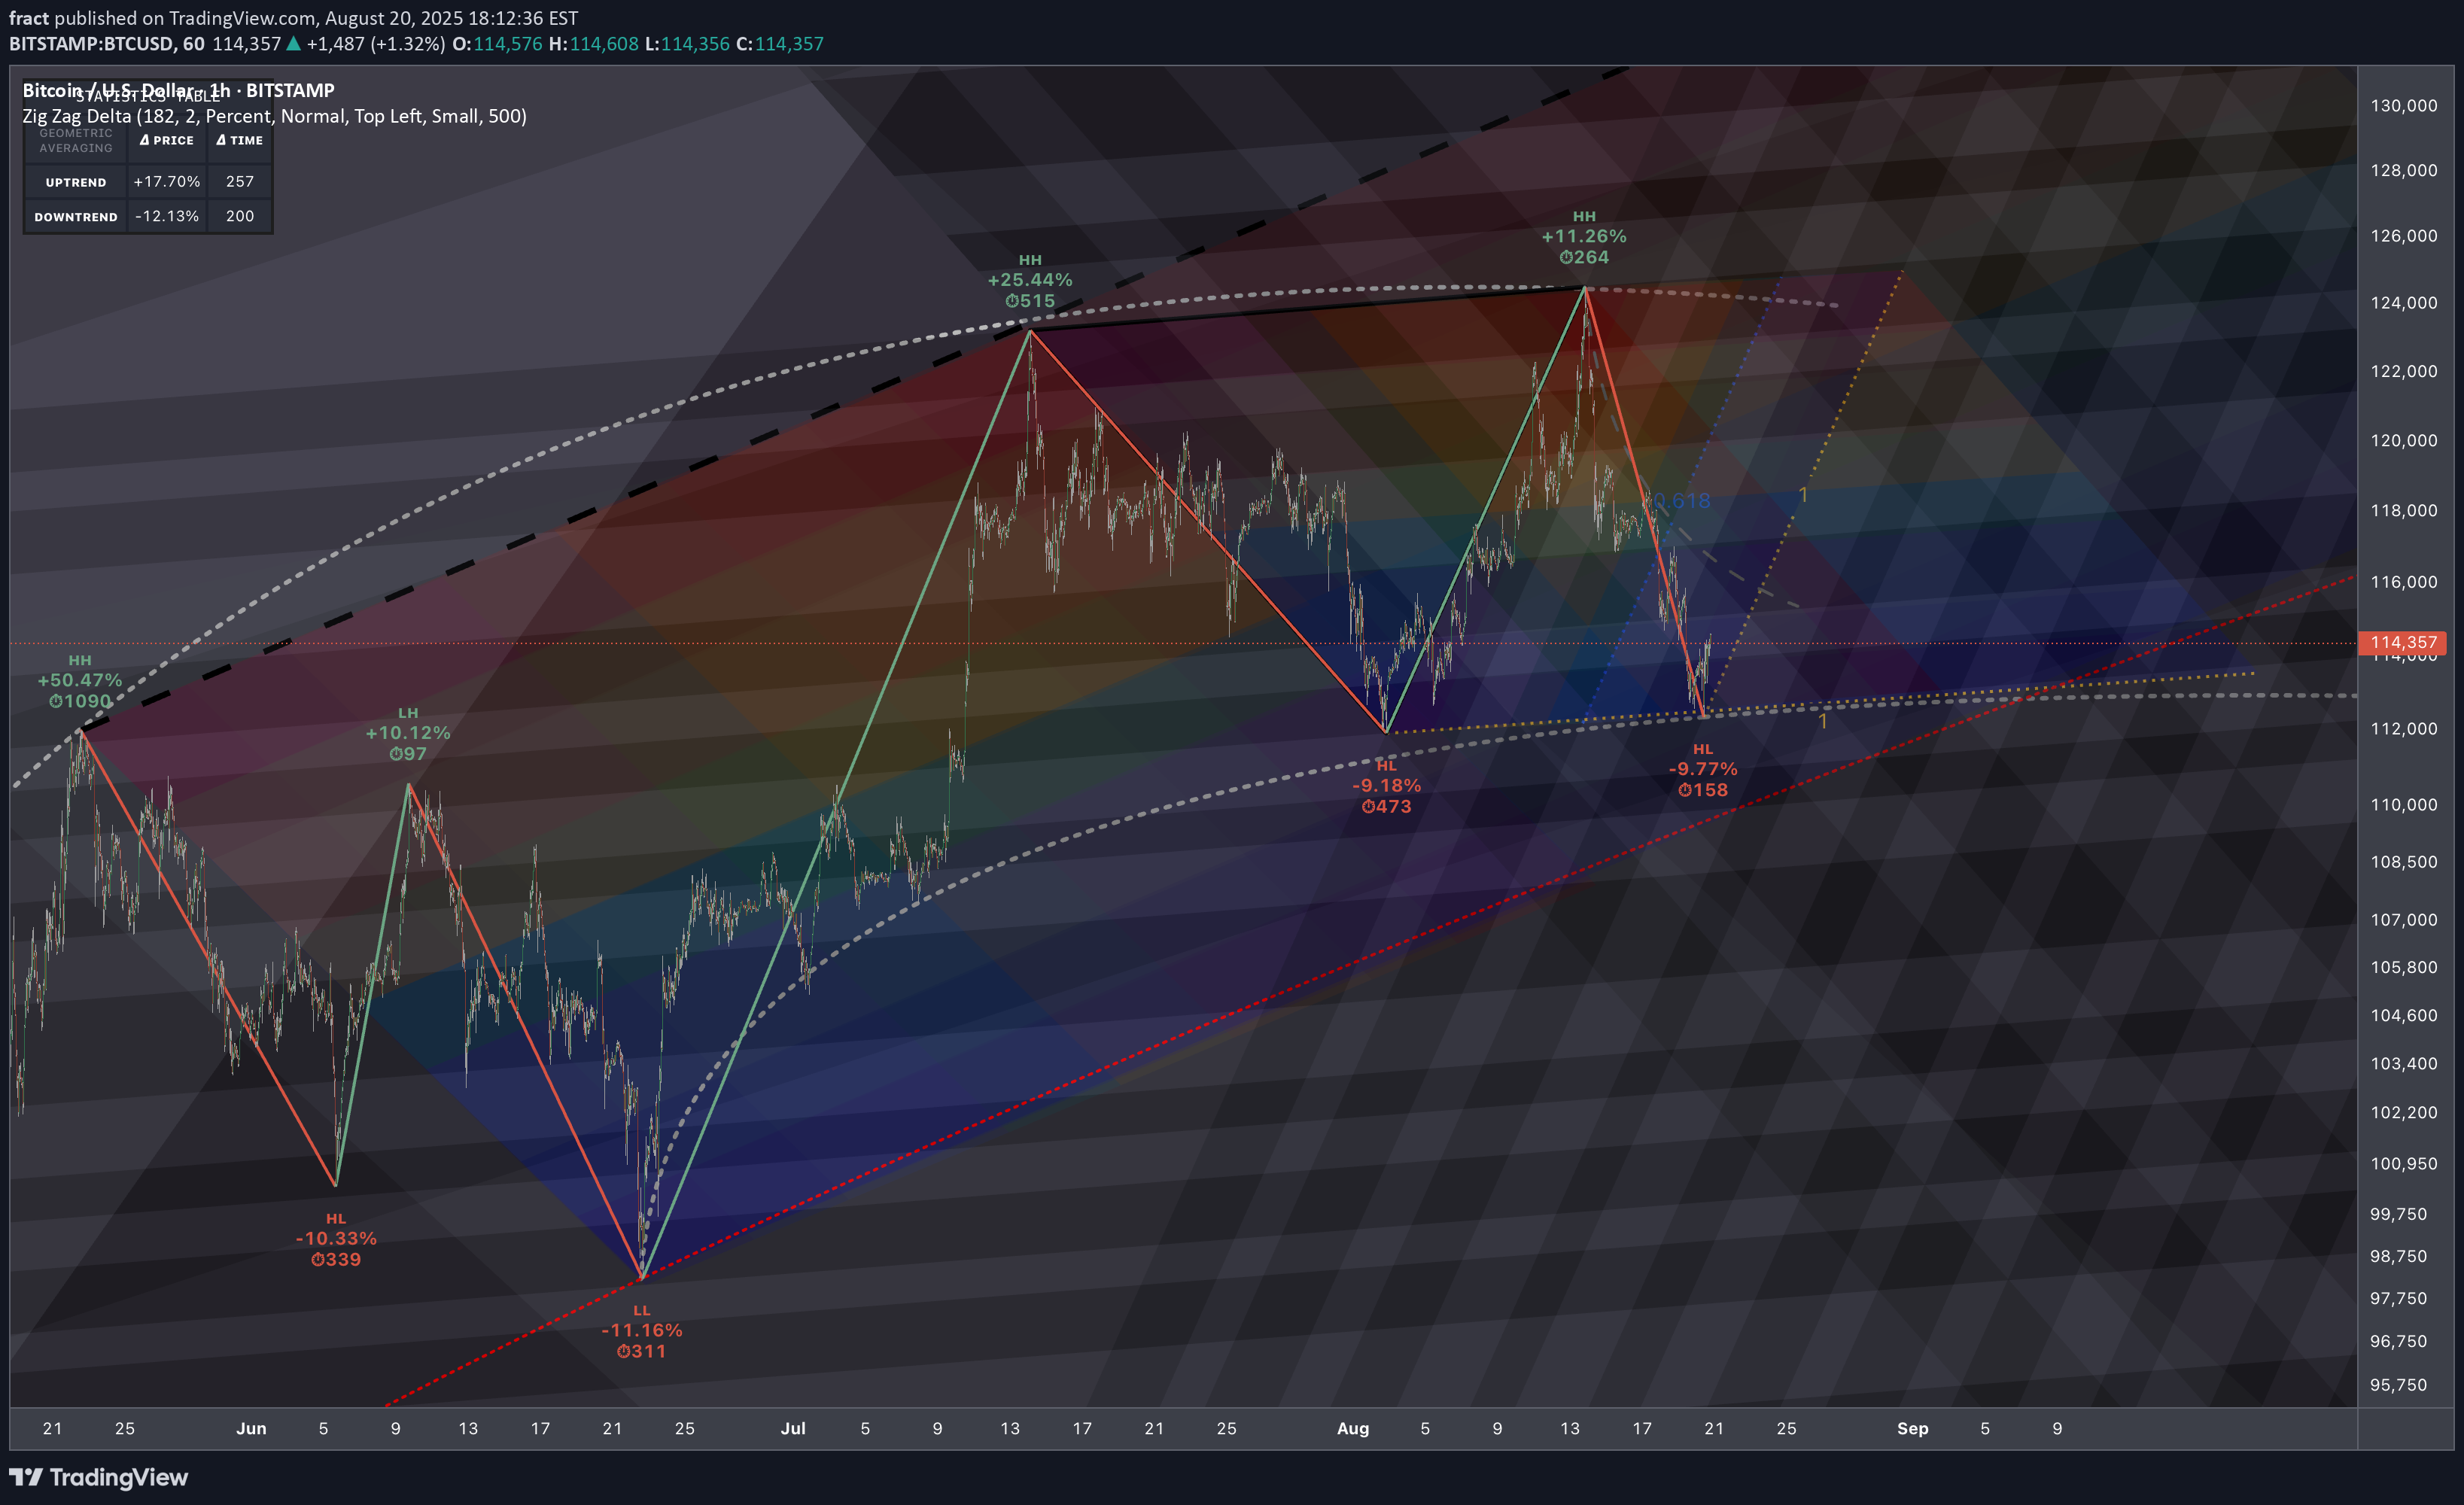
🏛️ Research Notes Fibonacci Channels as Frames of Reference Just like Schrödinger’s wave equation describes all possible states of a quantum system, the market at any moment holds a spectrum of potential price paths. Hence, commonality is that, the wave function is a mathematical description of probabilities, not certainties, just like market state is a blend of possible moves, not a single predetermined path. In quantum mechanics, choosing a measurement basis determines which aspects of the wave function become clear. In charting, each Fibonacci channel is a “measurement frame,” tuned to a certain proportion or scaling law that the market tends to respect. So if we say have multiple channels, then by overlaying several, you capture different interference layers, revealing systemic alignments that a single frame would miss. (Structure Memory and Duality )Both curves played a role of reversing the swings of the local scope.

🏛️ Research Notes Original Structure Logical Continuation Cycle can be broken further by adding x.146 and x.886 essentially allowing us define probability density with better precision. Also, made it B&W because I care about the topology of compression and release (the outcome) more than providing subjective interpretation colors to remain objective. Specifically, if the geometry of "release" phase would match the price texture. Validation of the structure (initial measurements) by recognizing how it resonated throughout history. (in a way prelude to what we see) Stats Table shows geometric averaging of all swings to figure out the all time mean to be able to anticipate wave’s first limit set by typical range.

🏛️ Research Notes There are known phenomena in physics that continues to remind me about markets, which partially influenced my perception of price action and reflected in topology. In space, speed itself doesn’t cause discomforts — only acceleration does. In markets, trend direction isn’t what stresses traders, it’s the rate of change (volatility spikes, momentum surges). A slow, constant uptrend can feel comfortable, but sudden thrusts (news shocks, liquidity squeezes) presses them against the seat. No matter how hard you accelerate, you can’t exceed light speed. Markets also have practical velocity limits such as liquidity constraints, margin requirements, volatility halts which contribute to proportions in movements). Beyond certain speeds, moves become self-limiting because liquidity providers back away or exchanges impose breakers. Aberration of Light → Focus Shift in Market Attention As you accelerate, stars seem to shift forward in view. In markets, as momentum builds, your perception of what matters narrows. What I mean is liquidity, news, and setups ahead dominate, while the “sky behind” (past fundamentals or long-term signals) fades. The market narrative contracts into a single front-facing beam: what’s next, not what’s past. Doppler Effect → Price Action Distorts Information Moving away from Earth, you see time slow down behind you; moving toward something, time speeds up. In markets, when price runs away from fundamentals, old data feels stale and irrelevant (red-shifted). In fast rallies or panics, information feels accelerated and urgent (blue-shifted) — traders act as if the clock is ticking faster. (Has nothing to do with the color gradient I use on chart.) Terrell–Penrose Rotation → Illusion At high speed, objects don’t look contracted, they look rotated due to delayed light arrival. In markets, patterns rarely appear exactly as the textbook shows because we’re always looking at “delayed” sentiment. What looks like a simple breakout might just be a rotated perspective of deeper structure. Time Dilation → Compression of Trading Horizon Travelers age slower, as from their view, a distant journey seems shorter. In markets, when immersed in high-frequency movement, traders experience time compression (dozens of opportunities in minutes). From outside (a swing trader’s view), that same period looks like a small blip in a larger trend. Length Contraction → Path Shortening During High Momentum Near light speed, distances shrink in the direction of travel. In markets, when momentum is extreme, the “distance” to a target level (Fibonacci, prior high) feels shorter, so price reaches it much faster than normal expectation.

🏛️ Research Notes Frames of Reference Interconnection of 3rd degree points fractal hierarchy Multi-scale Interconnection Merging into probabilistic layout Market movement reflects proportional relationships inherent to its own scale. Fibonacci ratios, appear not by accident but as structural constants within this probabilistic environment. Price and time intervals often align with these ratios because markets are recursive systems where past structures inform the formation of new ones through scaled transformation. In this framework, the golden ratio serves as more than a tool for retracements or extensions, as encodes the geometry of market behavior itself via frames of reference. Whether in the spacing of pivots, the rhythm of cycles, or the layering of trends, its presence points to a self-organizing principle at work.

🏛️ Research Notes Recent rejection from LH could be explained by spike out of scale, which in its turn was caused by buildup of counter force while correcting. Those two are part of progression which was wired by longer selloff cycle. If we scale back further, we would confirm overall structure's capacity set by growth patterns. Those boundaries and space between them can be interpreted as supply zones, leaving us with this particular interconnection: Though the object of observation would be the recent developments at minimal TF for publication (15m), so temporal patterns and cycle-derived levels can be thoroughly studies.
Disclaimer
Any content and materials included in Sahmeto's website and official communication channels are a compilation of personal opinions and analyses and are not binding. They do not constitute any recommendation for buying, selling, entering or exiting the stock market and cryptocurrency market. Also, all news and analyses included in the website and channels are merely republished information from official and unofficial domestic and foreign sources, and it is obvious that users of the said content are responsible for following up and ensuring the authenticity and accuracy of the materials. Therefore, while disclaiming responsibility, it is declared that the responsibility for any decision-making, action, and potential profit and loss in the capital market and cryptocurrency market lies with the trader.