
finance_hossein
@t_finance_hossein

What symbols does the trader recommend buying?
Purchase History
پیام های تریدر
Filter
Signal Type
finance_hossein

✅ Entry: 0.2437 USDT🎯 Targets:First Target: 0.2600 USDTSecond Target: 0.2750 USDTThird Target: 0.2850 USDT❌ Stop Loss: 0.2291 USDT🧠 Analysis Explanation:The price is consolidating within a symmetrical triangle and currently testing the breakout zone near dynamic support.An upward breakout could trigger a strong bullish move, in line with the ascending trendline support.RSI is recovering from oversold levels, indicating potential momentum shift.The setup offers a favorable risk/reward ratio, with the stop loss just below key support.⚡️ Note: Wait for confirmation of breakout before entry. Use appropriate risk management based on your trading plan.
finance_hossein
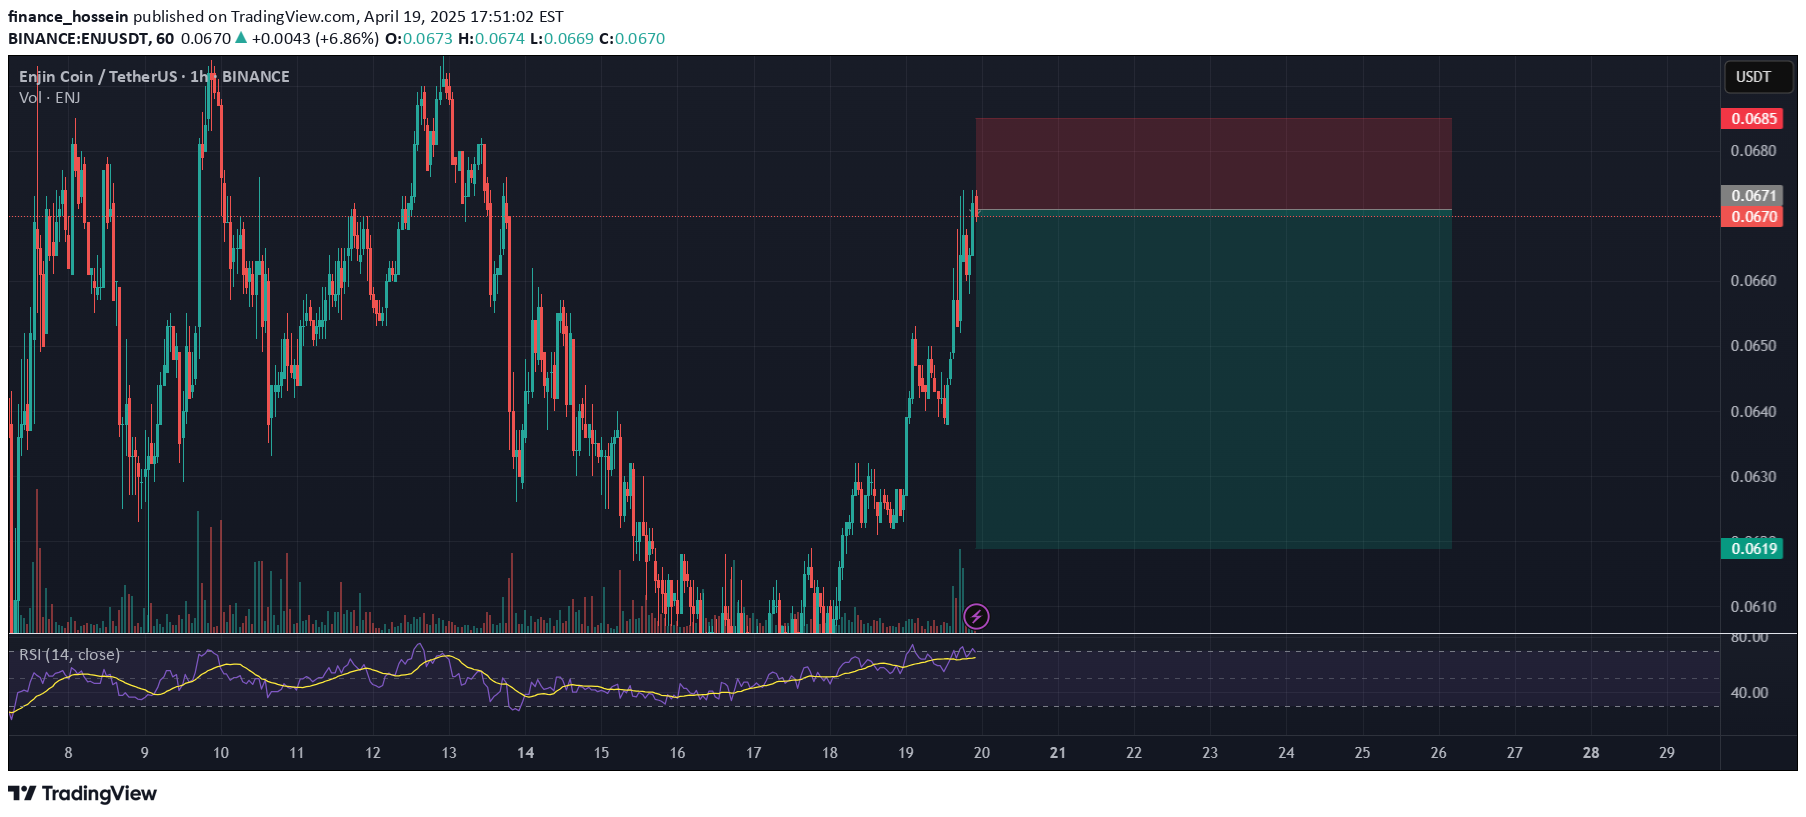
The Enjin Coin (ENJ) is showing strong overbought signals on the hourly timeframe, presenting an attractive selling opportunity with a favorable risk-to-reward ratio.Technical Analysis:Current price: 0.0671 USDT with recent rejection at 0.0674 resistance levelRSI (14) reading: 65.00, showing momentum shift after reaching overbought territoryVolume profile: Trading volume of 447.81K shows significant activity but potential exhaustionMarket structure: Price formed a clear resistance zone between 0.0671-0.0685Key Observations:ENJ has formed a potential double top pattern with clear resistance at the 0.0674 levelThe price action shows signs of bullish exhaustion after the recent rally from 0.0630RSI indicator has been trending downward from overbought levels, suggesting diminishing buying pressurePrice is currently testing a key resistance zone with visible rejection wicks on the hourly candlesTrade Setup:Entry point: 0.0671 (current price) or on rejection from 0.0674 resistanceStop loss: 0.0685 (above recent swing high)Profit targets:Target 1: 0.0650 (previous support level) - 31% of positionTarget 2: 0.0630 (strong support zone) - 49% of positionTarget 3: 0.0619 (green zone support) - 20% of positionRisk Management:Maintain a risk exposure of maximum 2% of total capitalSuggested position size based on volatility: ~145 ENJRisk-to-reward ratio: 1:3.2 (excellent opportunity)Current market sentiment reflects fear (Fear & Greed Index: 32), creating conditions where retail traders may panic sell on the first signs of downward movement, accelerating our targets.Remember, proper risk management is crucial - stick to your exit strategy regardless of short-term price action
finance_hossein

Signal Overview📈 Symbol: BCH/USDT⏱️ Timeframe: 1h📊 Market Sentiment: Fear (Fear & Greed Index: 43)🎯 Analysis Score: Buy: 45.9, Sell: 9.7, Confidence: 229.3%🕒 Last Data Update: 2025-04-12 14:00:00 (50.7 minutes ago)Technical AnalysisRSI in extreme overbought territory: 84.90Price approaching critical resistance level: 330.2092Very high confidence signalRisk Management (Sell Position)Entry Point: 327.3723 (326.8814 with slippage and fees)Stop Loss: 332.4284 (-1.70%)Exit Strategy:Target 1: 313.1862 (4.09%) - 50% positionTarget 2: 304.6748 (6.70%) - 30% positionTarget 3: 297.6020 (8.87%) - 20% positionRisk/Reward Ratio (Target 1): 2.81Suggested Position Size: 129.6263 BCHATR (Average Volatility): 3.3707 (1.03%)Additional RecommendationsThis is an ideal setup with an excellent risk-to-reward ratio. The RSI is showing extreme overbought conditions while price approaches a significant resistance level, creating a prime selling opportunity. Always implement proper risk management and avoid risking more than 2.0% of your capital on this trade. Commitment to the exit strategy is crucial for maximizing profit potential.Trade RationaleThe technical indicators strongly suggest BCH is overextended in the short term. With RSI at 84.90, we're seeing extreme overbought conditions that historically precede corrections. The price is approaching key resistance at 330.2092, which provides an ideal entry for a short position. The tiered take-profit strategy allows for capturing gains at different price levels while maintaining a favorable risk-to-reward profile.stop tauched
finance_hossein

## Market AnalysisNEO has recently shown significant upward movement but is now encountering strong resistance at the $5.68 level. The price action exhibits classic signs of exhaustion with decreasing buying volume after a steep climb. The current 1-hour chart shows a potential reversal pattern forming, making this an optimal entry for a short position.## Technical Indicators- **RSI (Relative Strength Index)**: Currently in overbought territory at 79.28, signaling potential reversal- **Volume Profile**: Declining buying pressure at current price levels- **Market Sentiment**: Fear & Greed Index at 25 (Extreme Fear) - contrarian indicator supporting potential downside- **Risk/Reward Assessment**: Favorable at 2.2 for the primary target## Entry StrategyOur algorithm identifies an ideal entry at $5.60, with consideration for slippage and fees. The NEO price has shown resistance to break above $5.68 with multiple rejections, strengthening our conviction for this short position.## Risk Management- **Stop Loss**: $5.74 (2.40% from entry)- **Position Sizing**: Recommend risking no more than 2% of total capital- **Exit Strategy**: - Target 1: $5.38 (+3.89%) - Close 50% of position - Target 2: $5.05 (+9.84%) - Close 30% of position - Target 3: $4.75 (+15.11%) - Close remaining 20%## Supporting EvidenceThe recent price action shows a parabolic move that typically doesn't sustain. Additionally, the 1-hour chart displays potential bearish divergence between price and momentum indicators. Current ATR of 0.0841 (1.50%) suggests manageable volatility for this trade setup.Remember to adhere strictly to the risk management rules outlined above. This setup offers an excellent risk-to-reward opportunity, but proper position sizing remains crucial for long-term trading success.1% ...1% loadedsave profit
Disclaimer
Any content and materials included in Sahmeto's website and official communication channels are a compilation of personal opinions and analyses and are not binding. They do not constitute any recommendation for buying, selling, entering or exiting the stock market and cryptocurrency market. Also, all news and analyses included in the website and channels are merely republished information from official and unofficial domestic and foreign sources, and it is obvious that users of the said content are responsible for following up and ensuring the authenticity and accuracy of the materials. Therefore, while disclaiming responsibility, it is declared that the responsibility for any decision-making, action, and potential profit and loss in the capital market and cryptocurrency market lies with the trader.