
filatovarthur
@t_filatovarthur

What symbols does the trader recommend buying?
Purchase History
پیام های تریدر
Filter
filatovarthur
GOLDEN INFORMATION: Gold Holds Firm Near $3,760 Amid Fed Cut Hop
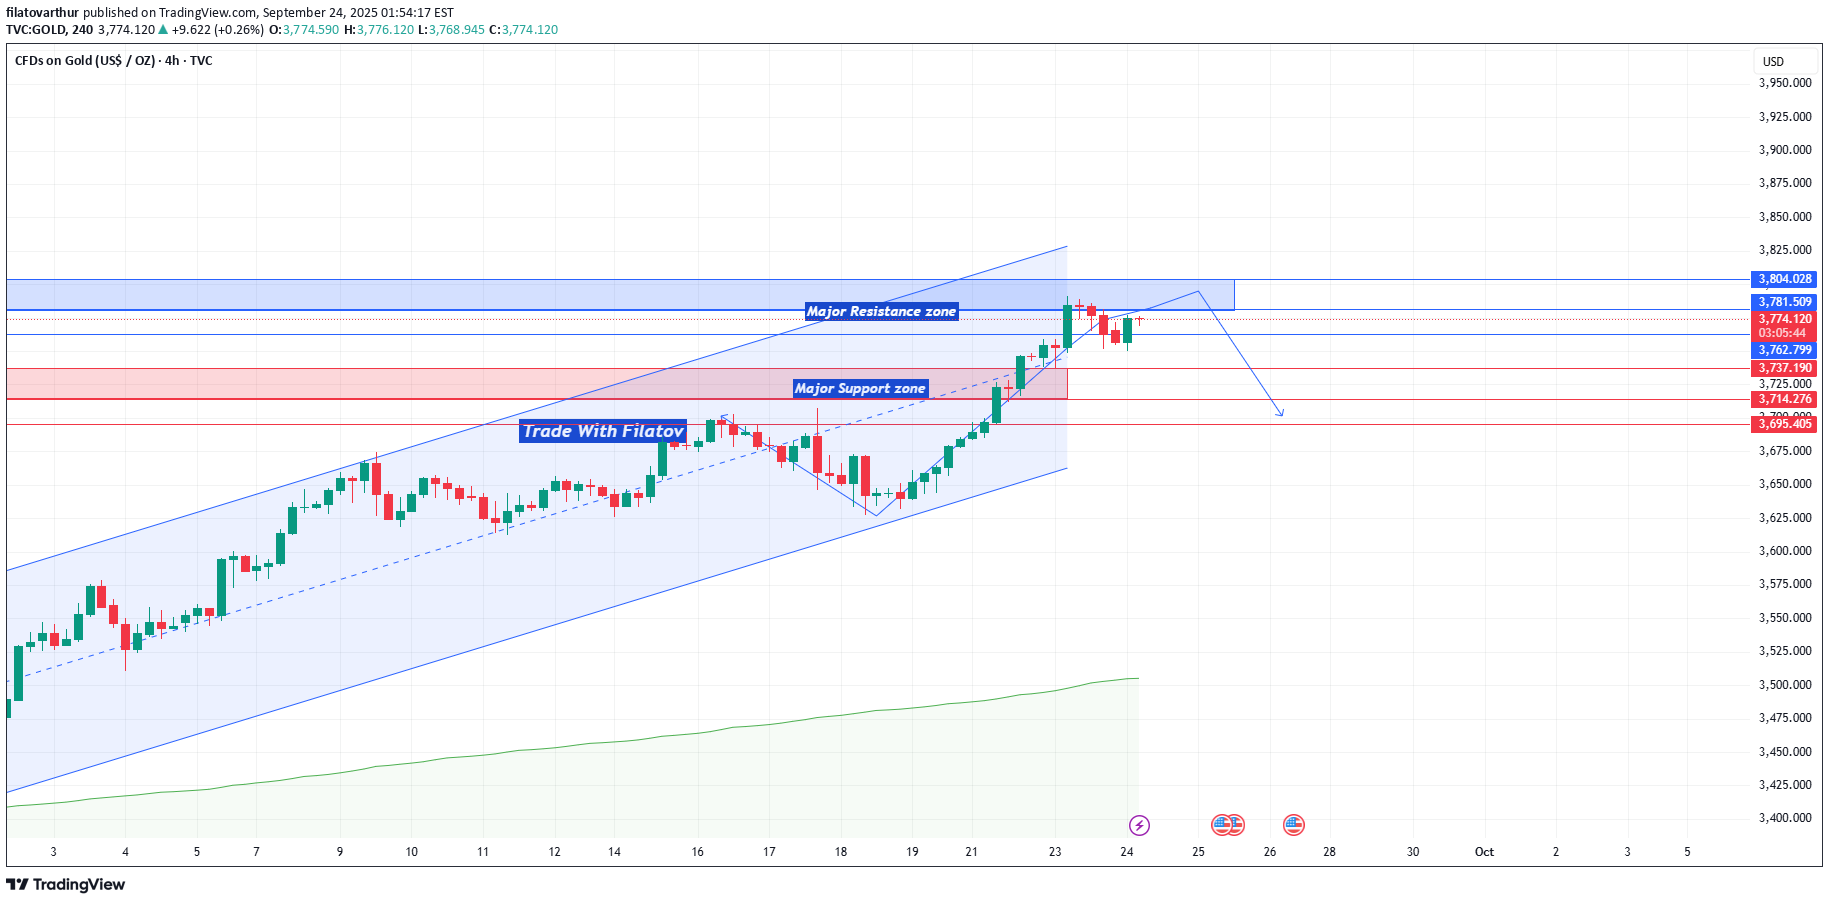
Gold (XAU/USD) is trading steady around $3,760 in Wednesday’s Asian session, after a slight pullback from its record high of $3,791. The precious metal continues to draw support from expectations of further U.S. Federal Reserve rate cuts and strong safe-haven demand. Fed Signals More Easing Ahead Fed Chair Jerome Powell highlighted the “challenging” balance between persistent inflation risks and a softening U.S. labor market. He reiterated the Fed’s readiness to ease policy further if needed, strengthening market bets for additional rate cuts. Futures markets are now pricing in two more 25 basis-point cuts in October and December, moves that would lower the opportunity cost of holding non-yielding assets like Gold. Market Outlook: Correction, Accumulation, and Uptrend Continuation After a brief correction lower, Gold appears to be entering an accumulation phase, setting the stage for a potential next leg higher toward $3,800. Technical View From a short-term perspective, key technical indicators—EMA 34 and EMA 89—along with support and resistance levels, suggest that traders could consider a tactical SELL setup within the ongoing consolidation. Immediate support: $3,740 – $3,720 Near-term resistance: $3,780 – $3,800 A well-timed sell order near resistance zones, with stops above the recent record, may provide an attractive risk-reward trade for short-term participants, while the broader long-term trend remains bullish.
filatovarthur
XAUUSD Trade Idea: Golden Cross Signals Bullish Momentum
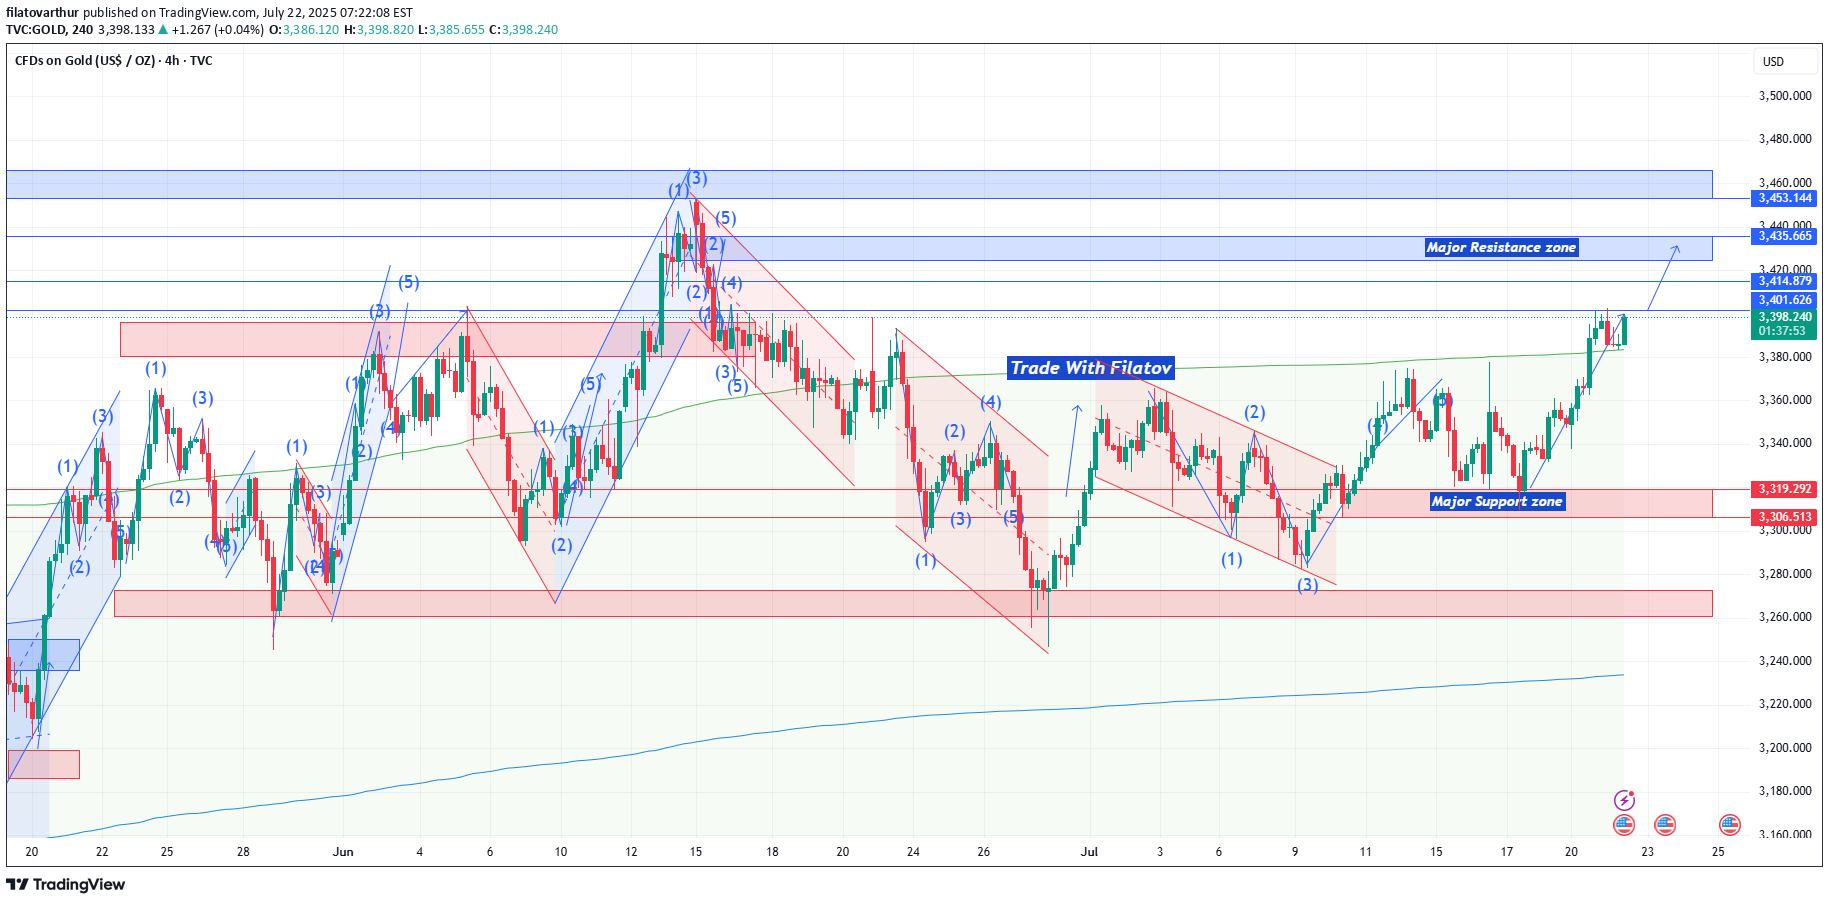
Gold (#XAUUSD) is surging after breaking above the 61.8% Fibonacci level, confirming strong bullish momentum! 📊 Key Observations: Price has bounced off the upper trendline, with an imbalance below, suggesting a possible small correction. The MA50 has crossed above the MA200, forming a Golden Cross – a highly bullish signal! 🎯 Trade Strategy: 🔼 Consider buying ONLY if price consolidates above 3400 & the nearest fractal. ✅ Target: 3435 (next resistance zone) ⚠️ Watch for pullbacks – the Golden Cross supports upside, but a retest of support could offer a better entry.
filatovarthur
TradeIdea – Gold (XAUUSD)
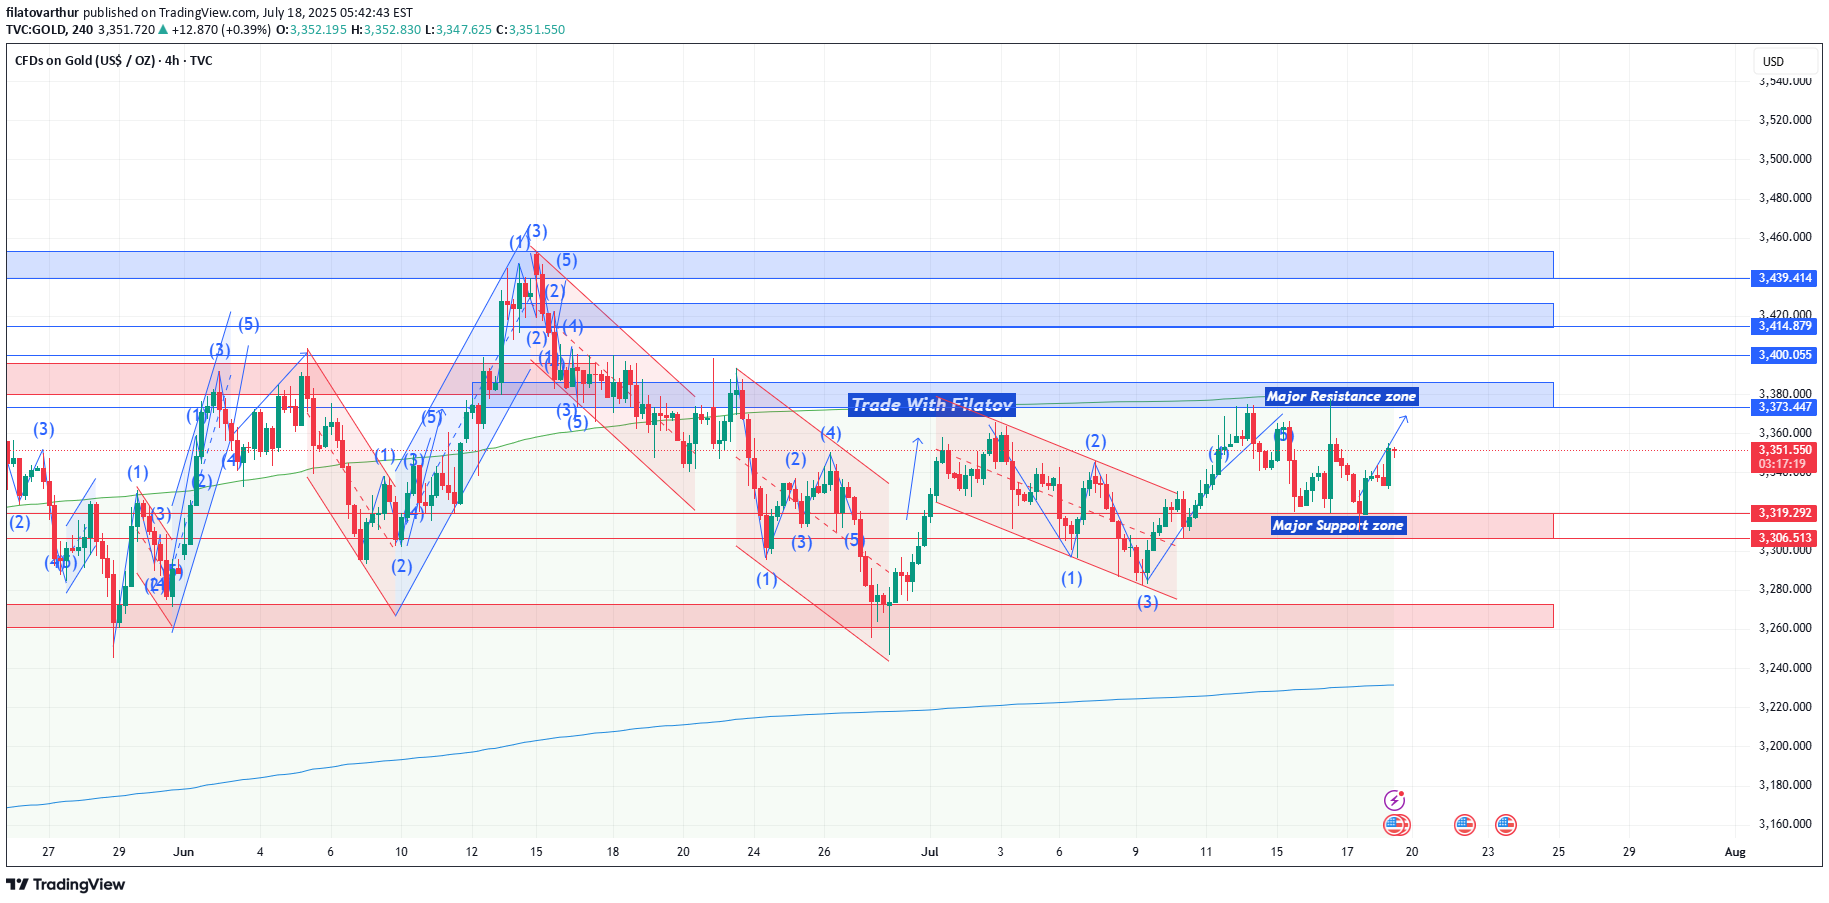
Looks like a bullish breakout is brewing! ✅ Price has broken out of the descending channel ✅ Retested the global trendline support ✅ Reclaimed the 200-day moving average (MA200) ✅ Momentum indicator surged above the 100 mark ✅ Visible imbalance zone above — potential target area 📌 If price consolidates above $3350, consider a long setup: 🎯 Target 1: $3370 🎯 Target 2: $3375 🧠 Watch for confirmation before entry — structure and momentum alignment is key.
filatovarthur
XAUUSD Trade Update

Yesterday price failed to hold below key support. Gold has now broken out of a descending channel after reclaiming the global trendline. It’s trading above the nearest fractal and testing the MA200, with Awesome Oscillator flashing bullish momentum. #TradeIdea 🔼 Buy XAUUSD — only if we get a clear consolidation above $3340 🎯 Target 1: $3360 🎯 Target 2: $3385 (only after Target 1 is hit) ⚠️ Wait for confirmation — no premature entries.
filatovarthur
Bitcoin Breakout Watch – BTC/USD Update

BTCUSD is currently consolidating above the $112,000 level — a critical price zone that could mark the beginning of a new leg higher. If this consolidation holds, it signals strong buyer interest and sets the stage for a potential breakout. The next major target lies at $120,000, aligning with the 161.8% Fibonacci extension, a key level often associated with explosive momentum moves. 💡 This setup reflects growing confidence in the crypto space and may attract institutional inflows if confirmed.
filatovarthur
Gold Market Update – Technical Breakdown in Focus

Gold has broken below the ABCD harmonic pattern structure, a classic sign of a potential trend reversal. This bearish move is now approaching the critical support at $3385, which has acted as a structural pivot in past sessions. Adding to this bearish outlook, the Momentum oscillator has crossed decisively below the 100-line, confirming a shift in directional strength and reinforcing downside potential. 🔽 TradeIdea – XAUUSD Short Setup Entry Trigger: Initiate short positions only if price closes below $3385 on strong volume. Take-Profit Target: $3360 – near the lower harmonic projection and previous demand zone. Stop-Loss Idea: Above $3412 (structure invalidation level) This setup aligns with both pattern-based analysis and momentum confirmation, increasing confidence for short-term bearish continuation.
filatovarthur
GOLD LIVE TRADE SIGNAL – June 16, 2025 (Price: $3415)

🔵 Setup: BUY on Breakout — targeting continuation after corrective pullback 📉 Market Structure: Bullish impulse completed a clear 5-wave Elliott structure Current pullback forming a potential Wave 2 or IV Price sitting above the breakout zone (~3391.6 support) ✅ Trade Details: Entry: Buy @ 3422 (on bullish candle close above local resistance zone) Stop Loss: 3408 (below consolidation low) Target 1: 3445 Target 2: 3468 RRR: ~1:2.3 Confidence: HIGH — strong momentum wave + clean structure 🔍 Technical Confluence: Wave (2) retracement respected Channel breakout held (blue ascending) Minor resistance around 3420 is being retested Volume likely to spike in NY session Caution: Avoid entry if price breaks below 3391.6 – would invalidate short-term structure.
filatovarthur
Gold Trade Setup – Tactical Short Call

Gold’s recent rebound appears corrective within a broader short-term bearish structure. Price action has stalled below the 200-period 4H SMA and key Fib resistance, signaling potential exhaustion. 🔎 Technical Confluence: Rejection from descending trendline resistance 61.8% retracement of the latest drop capped upside near $3,315 Bearish RSI divergence on 1H and 4H Weak momentum on MACD + low ADX signals lack of trend strength 📊 Macro Overlay: Market remains cautious ahead of today’s Core PCE data (expected to cool slightly YoY). Rising real yields and firm USD limit upside in gold, especially as risk-on tone returns temporarily. Positioning data shows speculative longs remain elevated—raising vulnerability to profit-taking. ⚠️ Execution Note: Patience is key—wait for confirmation via bearish engulfing or failure swing near $3,315 before engaging. Lower timeframes show consolidation; a breakdown below $3,290 will likely accelerate toward the $3,274 target.
filatovarthur
XAUUSD Technical Outlook – Golden Cross in Focus

Gold is showing signs of recovery on the H1 timeframe, rebounding from the critical $3,290 support zone after a brief consolidation phase. A notable development is the 50-period moving average crossing above the 200-period MA — forming a Golden Cross, which is a classic bullish signal suggesting upward momentum may strengthen in the near term.🔍 Momentum Insights:Resistance Check: On the micro-level, XAUUSD is approaching short-term resistance — the 50-MA itself — which may offer temporary friction.MACD Confirmation: The MACD histogram has crossed above the signal line, reinforcing bullish divergence and signaling growing upward momentum.Structure: Price is maintaining higher lows while respecting the moving average structure — a sign of controlled bullish development.📈 #TradeIdea – Breakout StrategyWe are watching for a buy opportunity above the $3,320 breakout level, aligning with a shift in both momentum and structure.🔼 Long Setup:📍 Entry: Buy on breakout above $3,320🎯 Target 1: $3,350🎯 Target 2: $3,365🛡️ Stop-loss can be trailed below $3,290 (support turned invalidation)
filatovarthur
XAUUSD ALERT TODAY

Here it is - Gold has started to fall. The price formed a descending channel pattern, bounced off the upper trendline, and broke the short-term uptrend. Parabolic SAR indicates the beginning of the decline, and MACD confirms the decline. There is also Imbalance at the bottom.🔽 We consider selling #XAUUSD only on consolidation below 3305;🎯 Target: 3250.
Disclaimer
Any content and materials included in Sahmeto's website and official communication channels are a compilation of personal opinions and analyses and are not binding. They do not constitute any recommendation for buying, selling, entering or exiting the stock market and cryptocurrency market. Also, all news and analyses included in the website and channels are merely republished information from official and unofficial domestic and foreign sources, and it is obvious that users of the said content are responsible for following up and ensuring the authenticity and accuracy of the materials. Therefore, while disclaiming responsibility, it is declared that the responsibility for any decision-making, action, and potential profit and loss in the capital market and cryptocurrency market lies with the trader.