
eltahhannada_na
@t_eltahhannada_na

What symbols does the trader recommend buying?
Purchase History
پیام های تریدر
Filter
Signal Type
eltahhannada_na
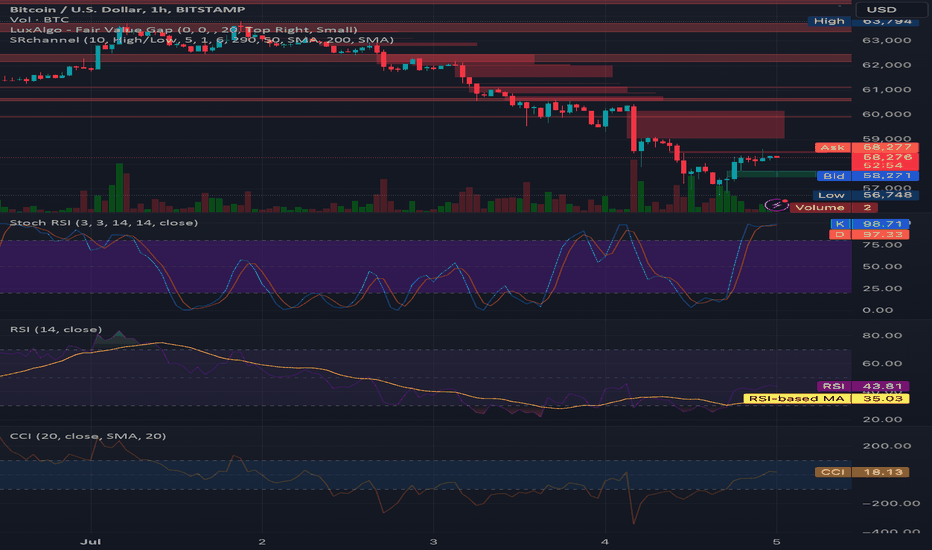
BTCUSD Current Price: 58,260 USD Key Levels: •Resistance: 60,000 USD, 62,000 USD •Support: 56,748 USD Technical Indicators: •Stochastic RSI: Overbought •RSI (14): 43.40 (bearish momentum) •CCI (20): 13.82 (neutral) Volume: Increased during price drops, indicating strong selling pressure. Short Position Strategy: Entry Point: Around 60,000 USD (resistance level) •Stop Loss: 60,500 USD (above the resistance) •Target: 56,748 USD (support level) Rationale: •Resistance at 60,000 USD suggests potential for continuation of the downtrend. •Stochastic RSI in overbought territory, indicating a possible pullback. •RSI below 50 confirms bearish momentum.
eltahhannada_na
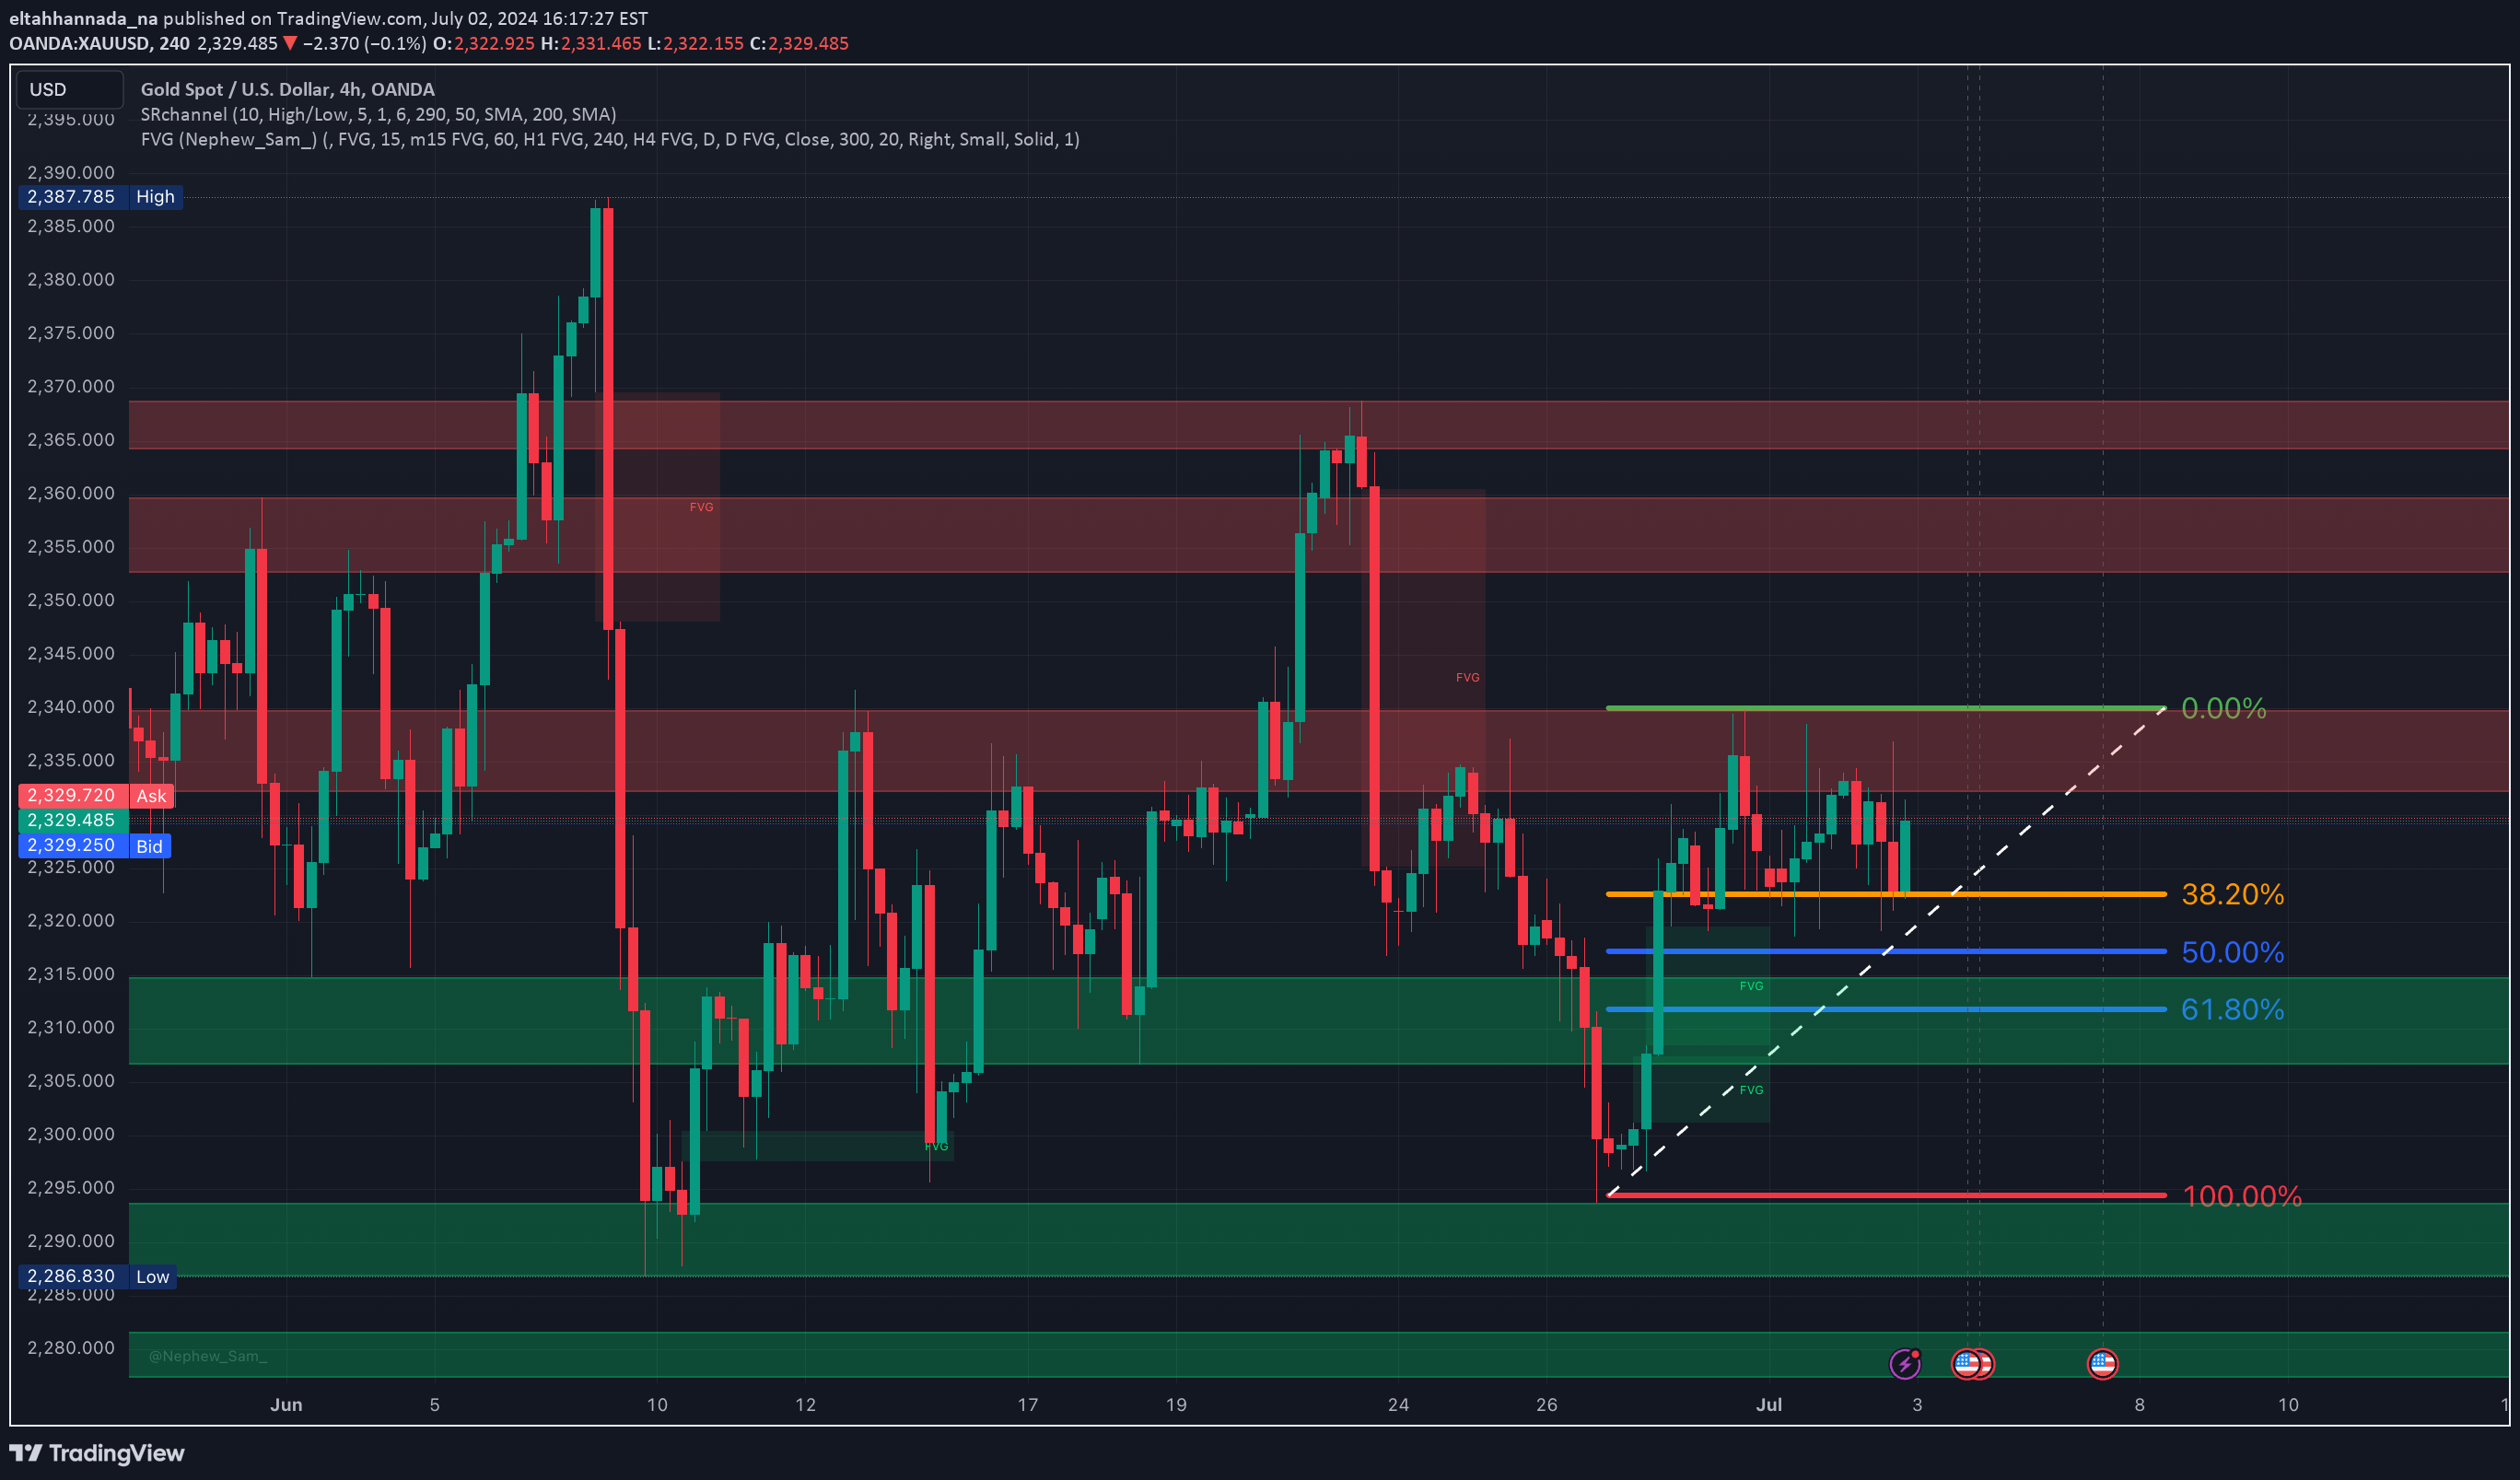
GOLD XAUUSD Based on the new chart on a 4-hour timeframe, here are simplified entry points for long positions with updated support and resistance levels and Fibonacci retracement levels: Key Points: 1.Support and Resistance Zones: - Resistance Zones: Around 2,331 to 2,333 USD, previously acting as strong resistance. - Support Zones: Around 2,319 to 2,322 USD and lower at 2,310 USD, providing strong support in the past. 2. Fibonacci Retracement Levels: - 38.20% Level: Around 2,325 USD, minor support/resistance. - 50.00% Level: Around 2,322 USD, significant support/resistance. - 61.80% Level: Around 2,319 USD, critical support/resistance. 3. Fair Value Gaps (FVG): Indicate potential price targets or reversal points. 4. Recent Price Action: Price has tested the 38.20% Fibonacci level and shows a potential bounce, indicating bullish strength. Currently above the 50.00% Fibonacci level, suggesting a bullish trend if it holds. Entry Points for Long Positions: 1. Breakout Above Resistance: - Entry Point: 2,331 USD - Reason: A breakout above this level with strong volume can confirm bullish momentum and potential for a rally. 2. Pullback to Support Zone: - Entry Point:2,322 USD - Reason:Entering near the 50.00% Fibonacci level around 2,322 USD offers a good risk-reward ratio. 3. Bounce from Lower Fibonacci Level: - Entry Point:2,319 USD (61.80% Fibonacci level) - Reason: A bounce from this level with confirmed upward momentum is a good entry point. Stop-Loss and Take-Profit Levels: - Stop-Loss: Below the recent low at 2,310 USD - Take-Profit Levels: - TP1: 2,331 USD (Initial resistance) - TP2: 2,333 USD (Higher resistance zone) - TP3: 2,335 USD (Upper resistance zone) Probability of Consolidation: - Probability:20% - While strong bullish indicators are present, there is still a 20% chance of consolidation. Conclusion: The overall sentiment for gold is bullish, with strong indicators suggesting an upward trend. Entering long positions at the identified points offers a favorable risk-reward ratio. However, be mindful of the possibility of consolidation.
eltahhannada_na
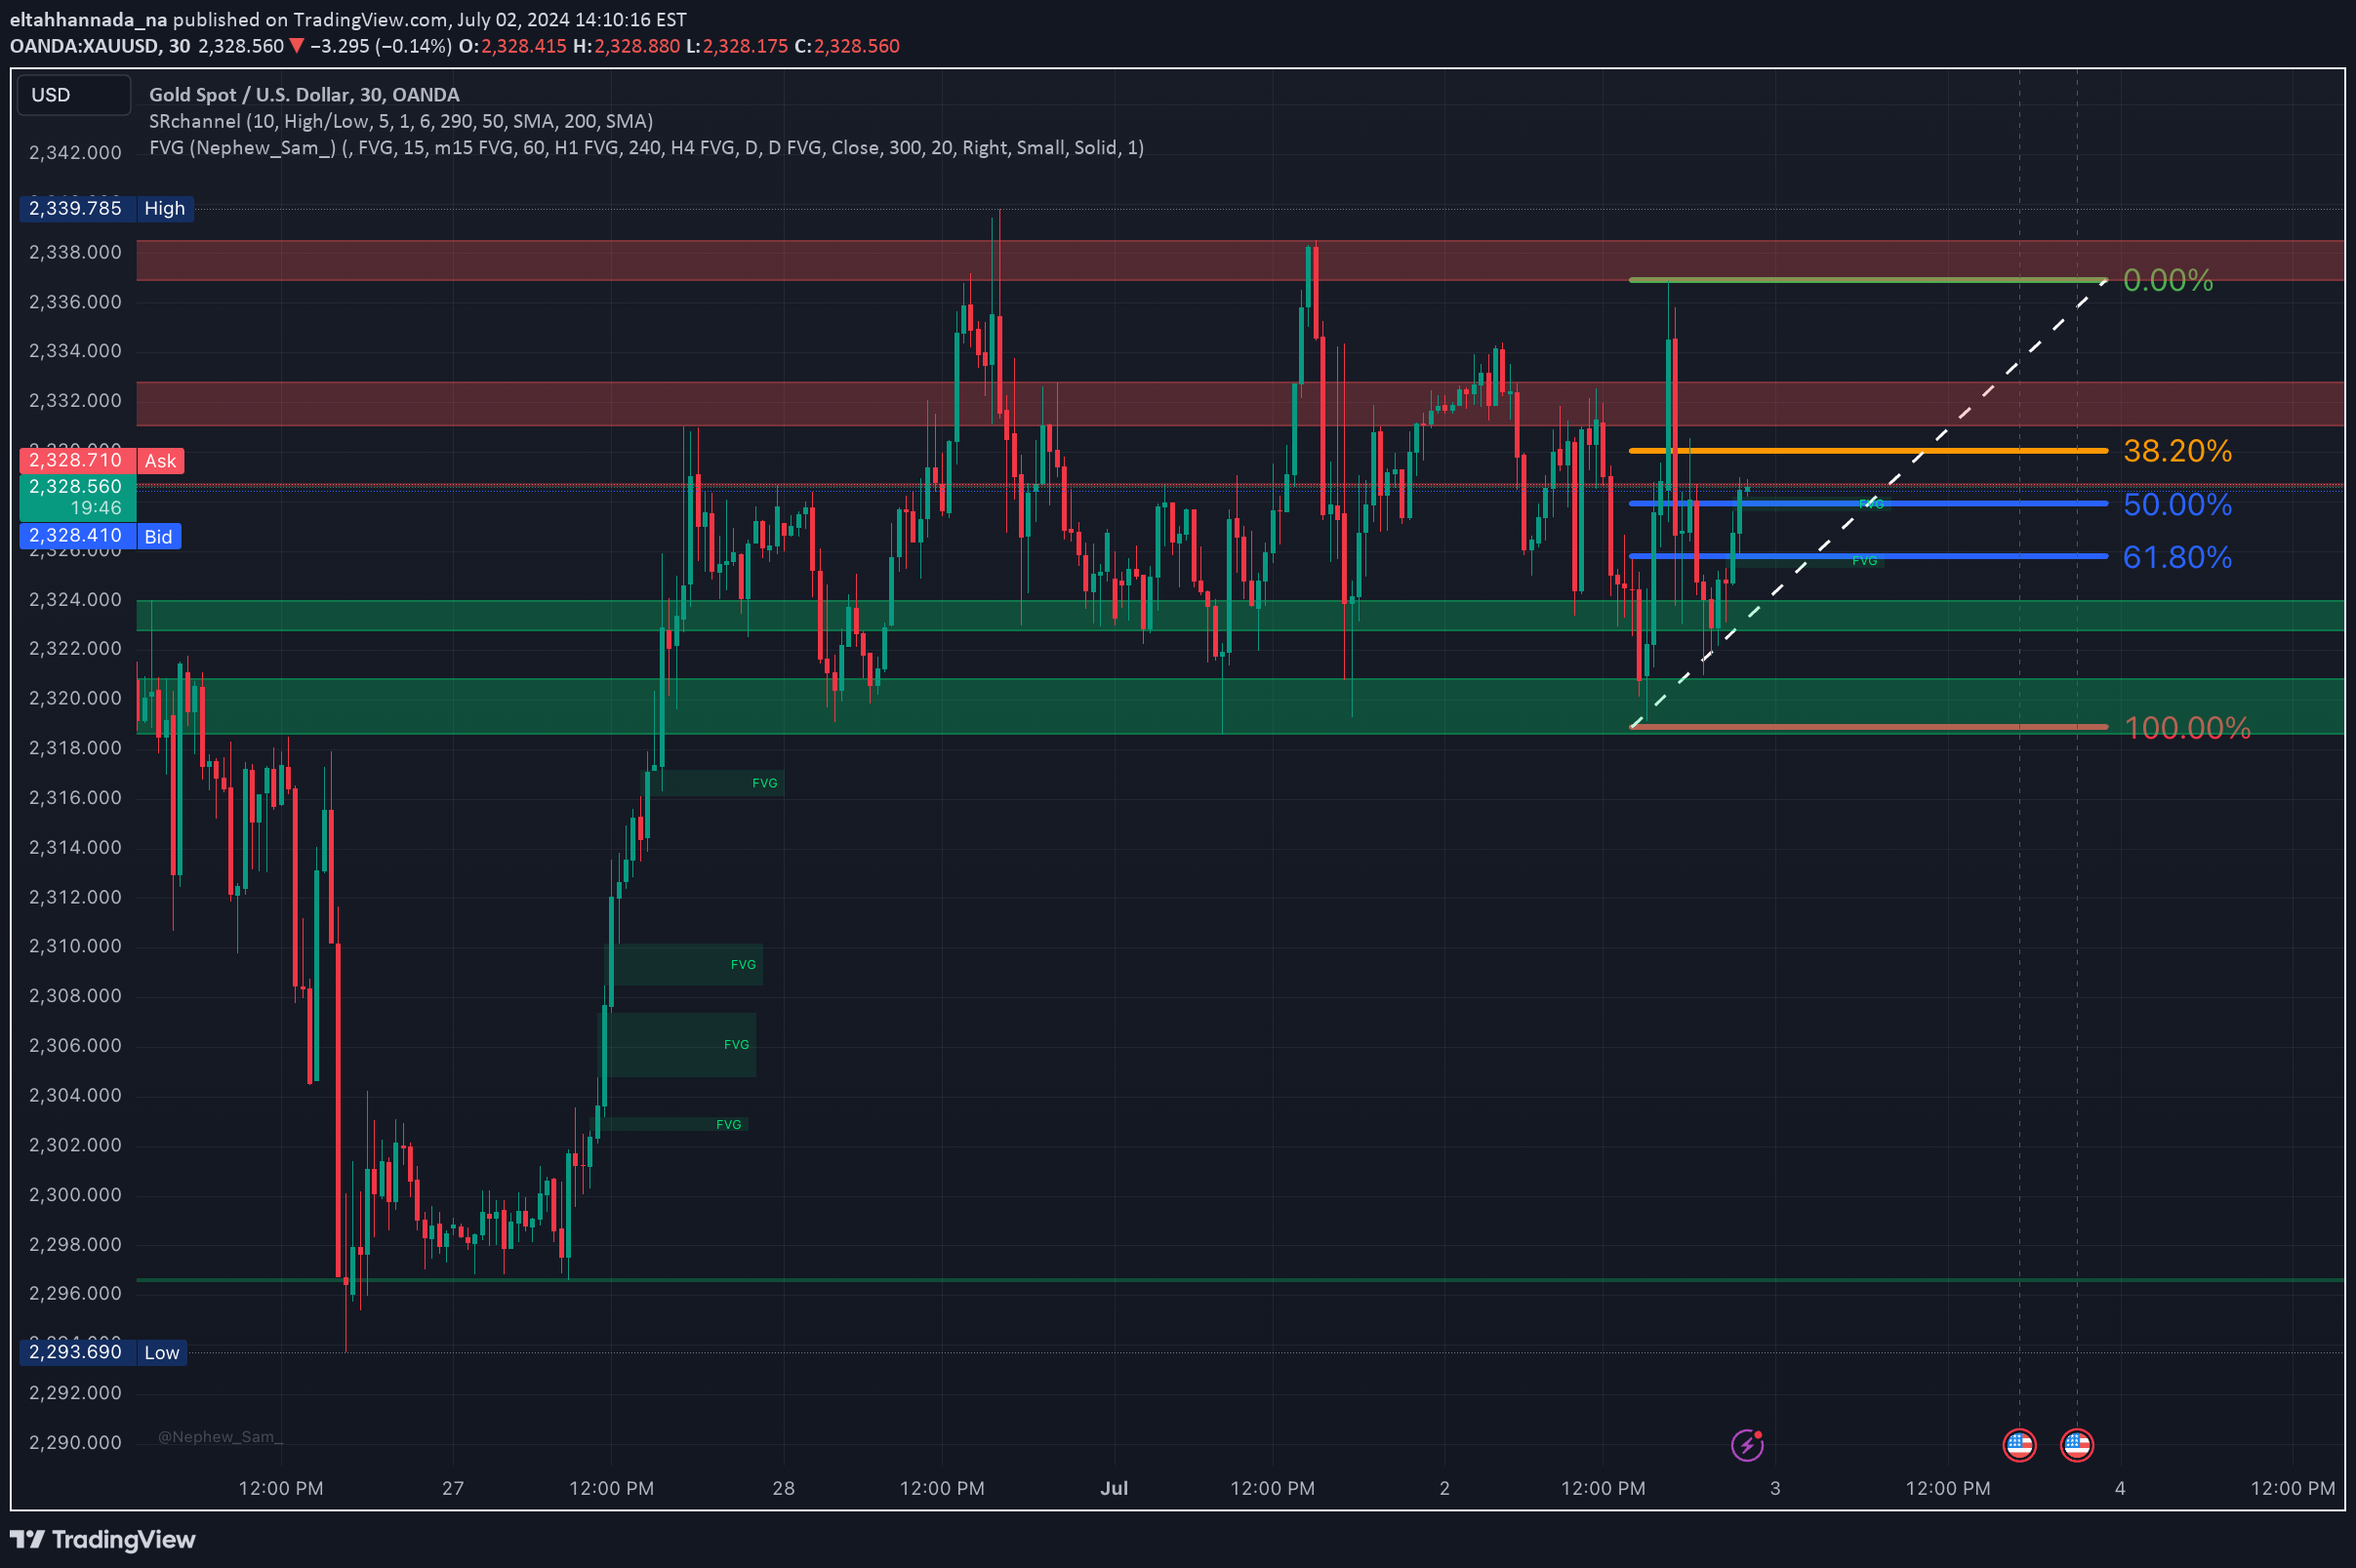
XAUUSD GOLD Updated Summary from a Bullish Perspective: The chart indicates a bullish sentiment After a recent bounce off a strong support zone around 2,313 USD, the price is showing potential for an upward trend. Key indicators, including Fibonacci retracement levels and support/resistance zones, suggest possible bullish continuation. Bullish Indicators: 1. Support Bounce - The price has bounced off a strong support zone around 2,313 USD, indicating strong buying interest at this level. 2. Upward Trendline: - A dashed white upward trendline from the recent low suggests the potential for continued upward momentum. 3. Fibonacci Levels - The price is approaching the 50% Fibonacci retracement level (around 2,325 USD), a key level that often supports bullish moves. 4. Volume: - Stable volume at current levels indicates a balanced market, with potential for increased buying pressure. Entry Points for Long Positions: 1. Breakout Above Resistance: - Entry Point: 2,330 USD - Reason: A breakout above the resistance zone around 2,330 USD with strong volume can confirm bullish momentum and a potential rally. 2. Pullback to Support Zone: -Entry Point: 2,318 USD - Reason: Entering near the support zone around 2,318 USD provides a favorable risk-reward ratio, especially if the price bounces off this level again. 3. Fibonacci Retracement Levels: - Entry Point: 2,325 USD (50% Fibonacci level) - Reason:The 50% Fibonacci retracement level around 2,325 USD is a significant support level. A bounce from this level with upward momentum confirmation can be a good entry point. Probability of Consolidation: - While the bullish indicators are strong, there is still a 30% chance that the price could consolidate between the support and resistance zones. This scenario is less likely but should be considered. Stop-Loss and Take-Profit Levels: - Stop-Loss:Below the recent low at 2,313 USD to limit potential losses. - Take-Profit Levels: - TP1: 2,336 USD (Resistance zone) - TP2: 2,339 USD (Upper resistance zone) - TP3:2,345 USD (Further upside potential) Conclusion: The overall sentiment for gold is bullish, with key indicators suggesting an upward trend. Entering long positions at the identified points can provide a favorable risk-reward ratio. However, the possibility of consolidation exists and should be monitored.
eltahhannada_na
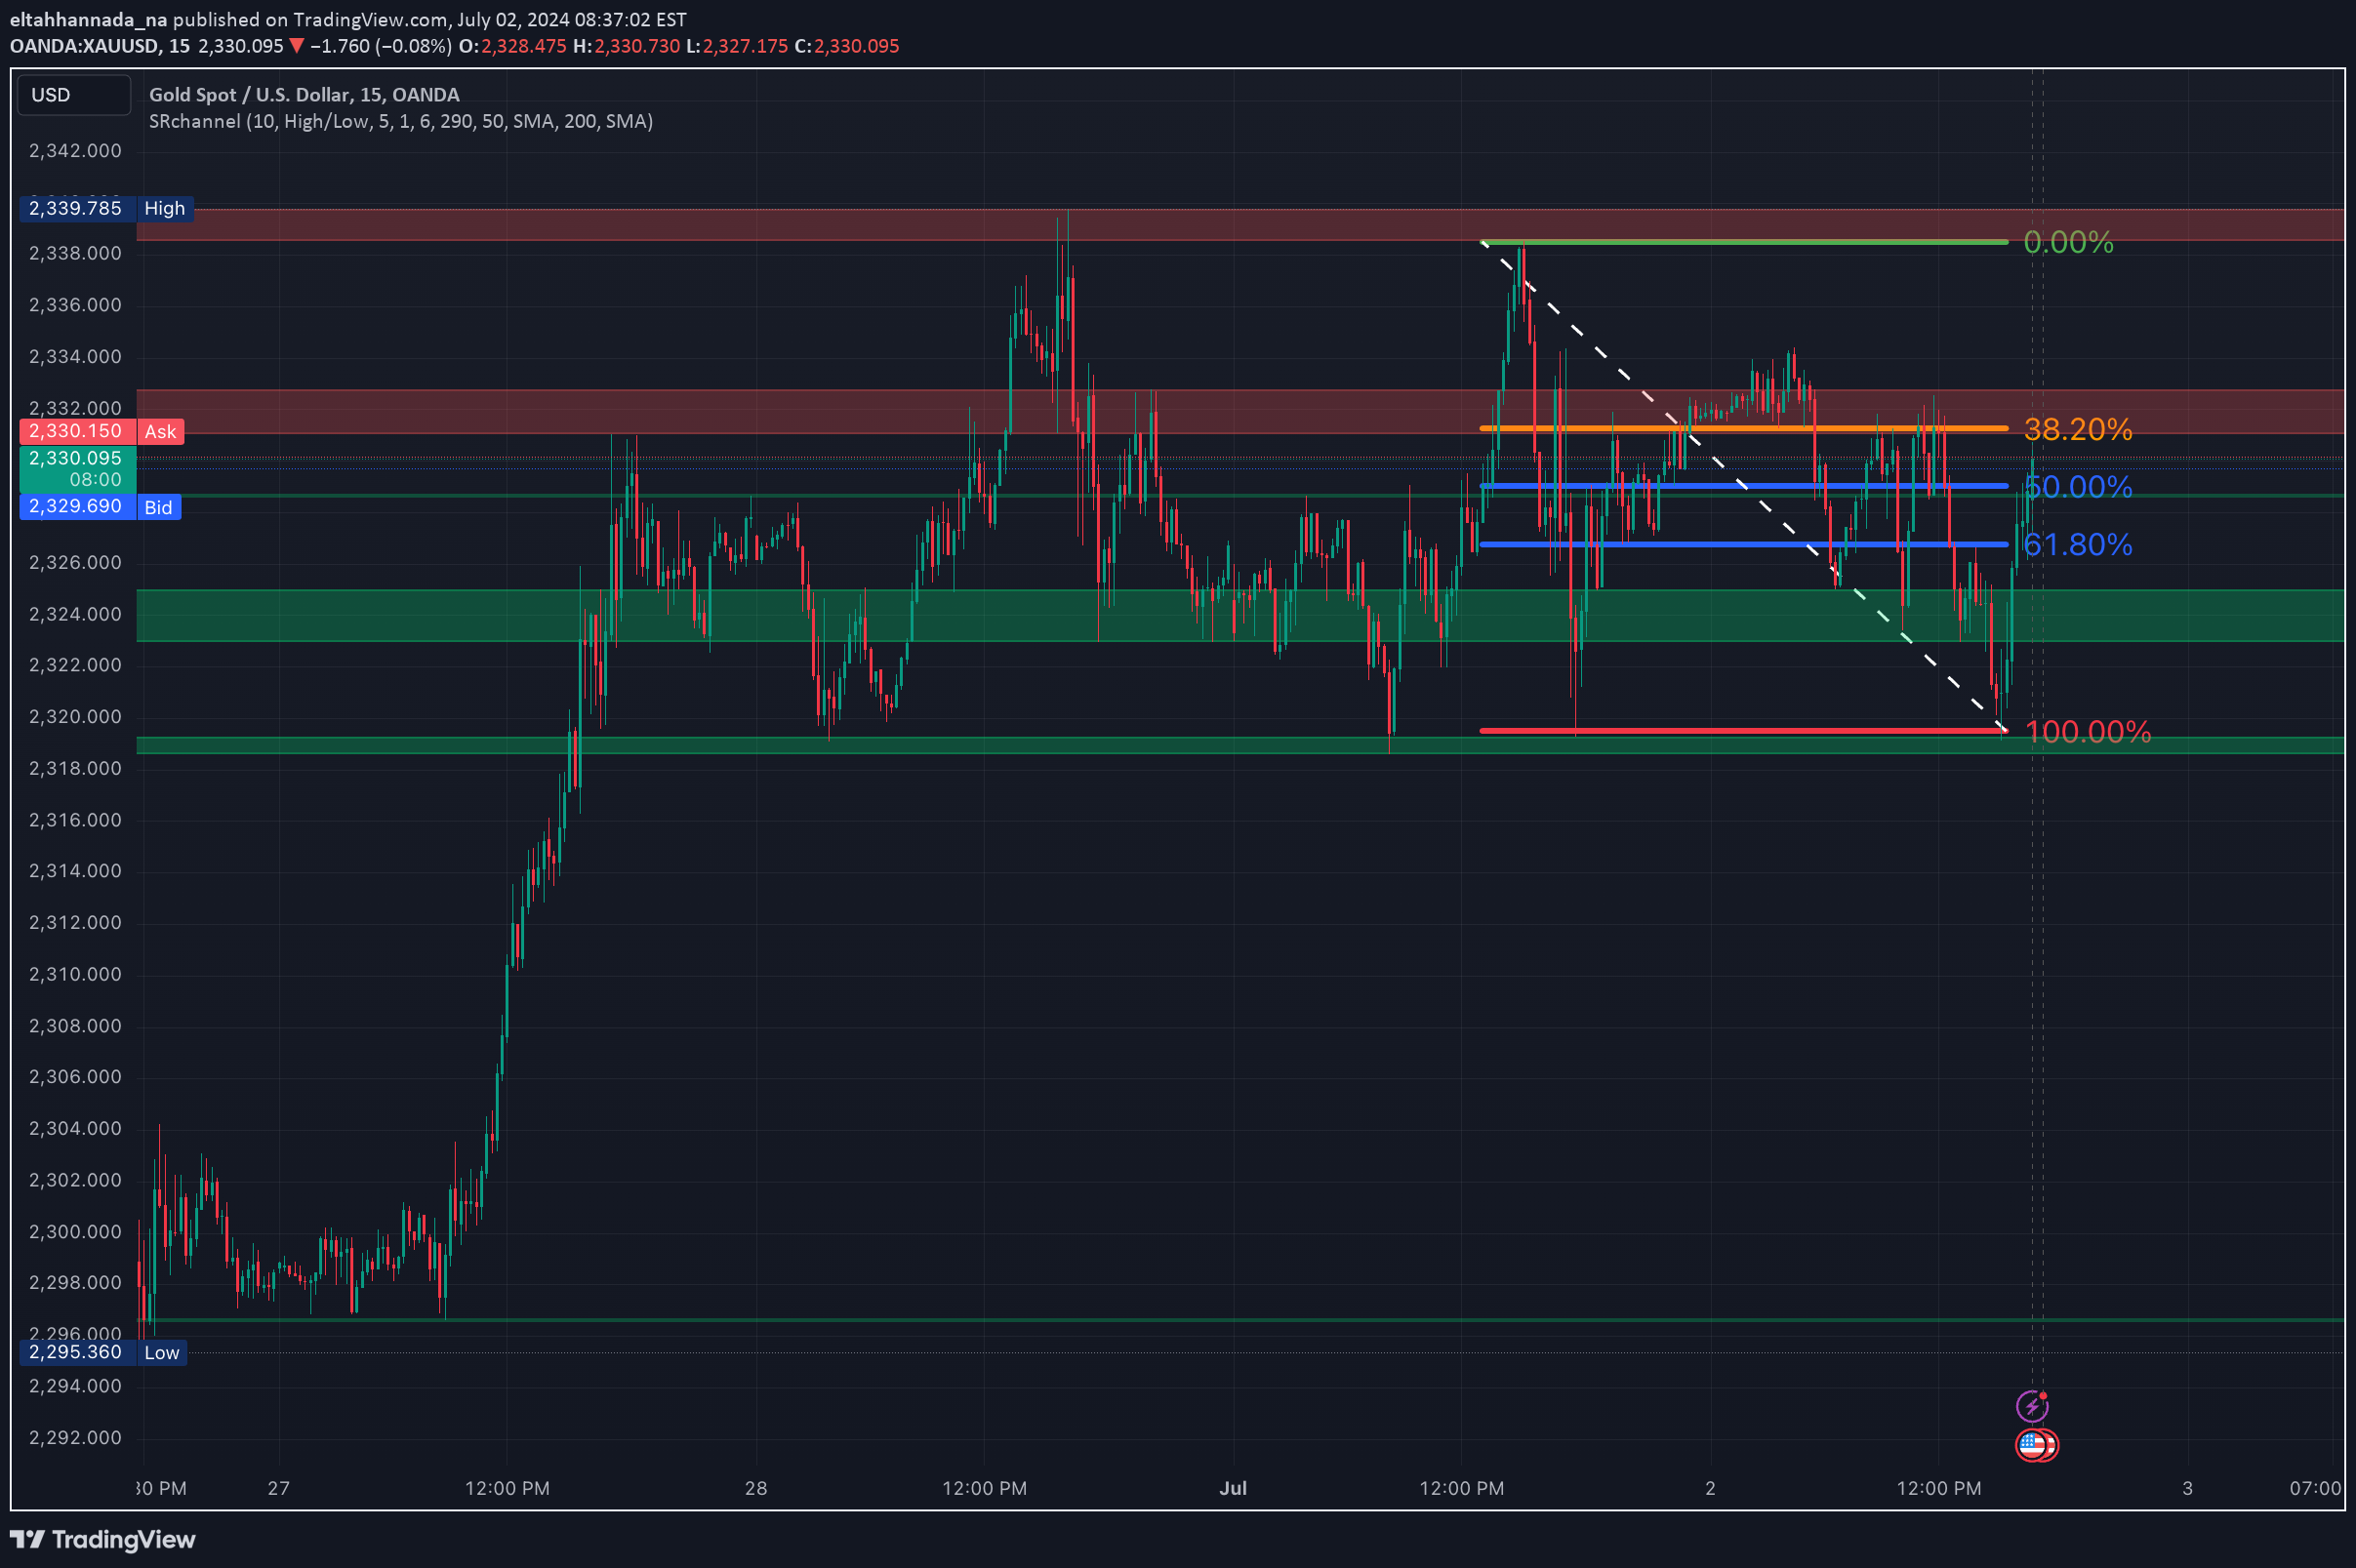
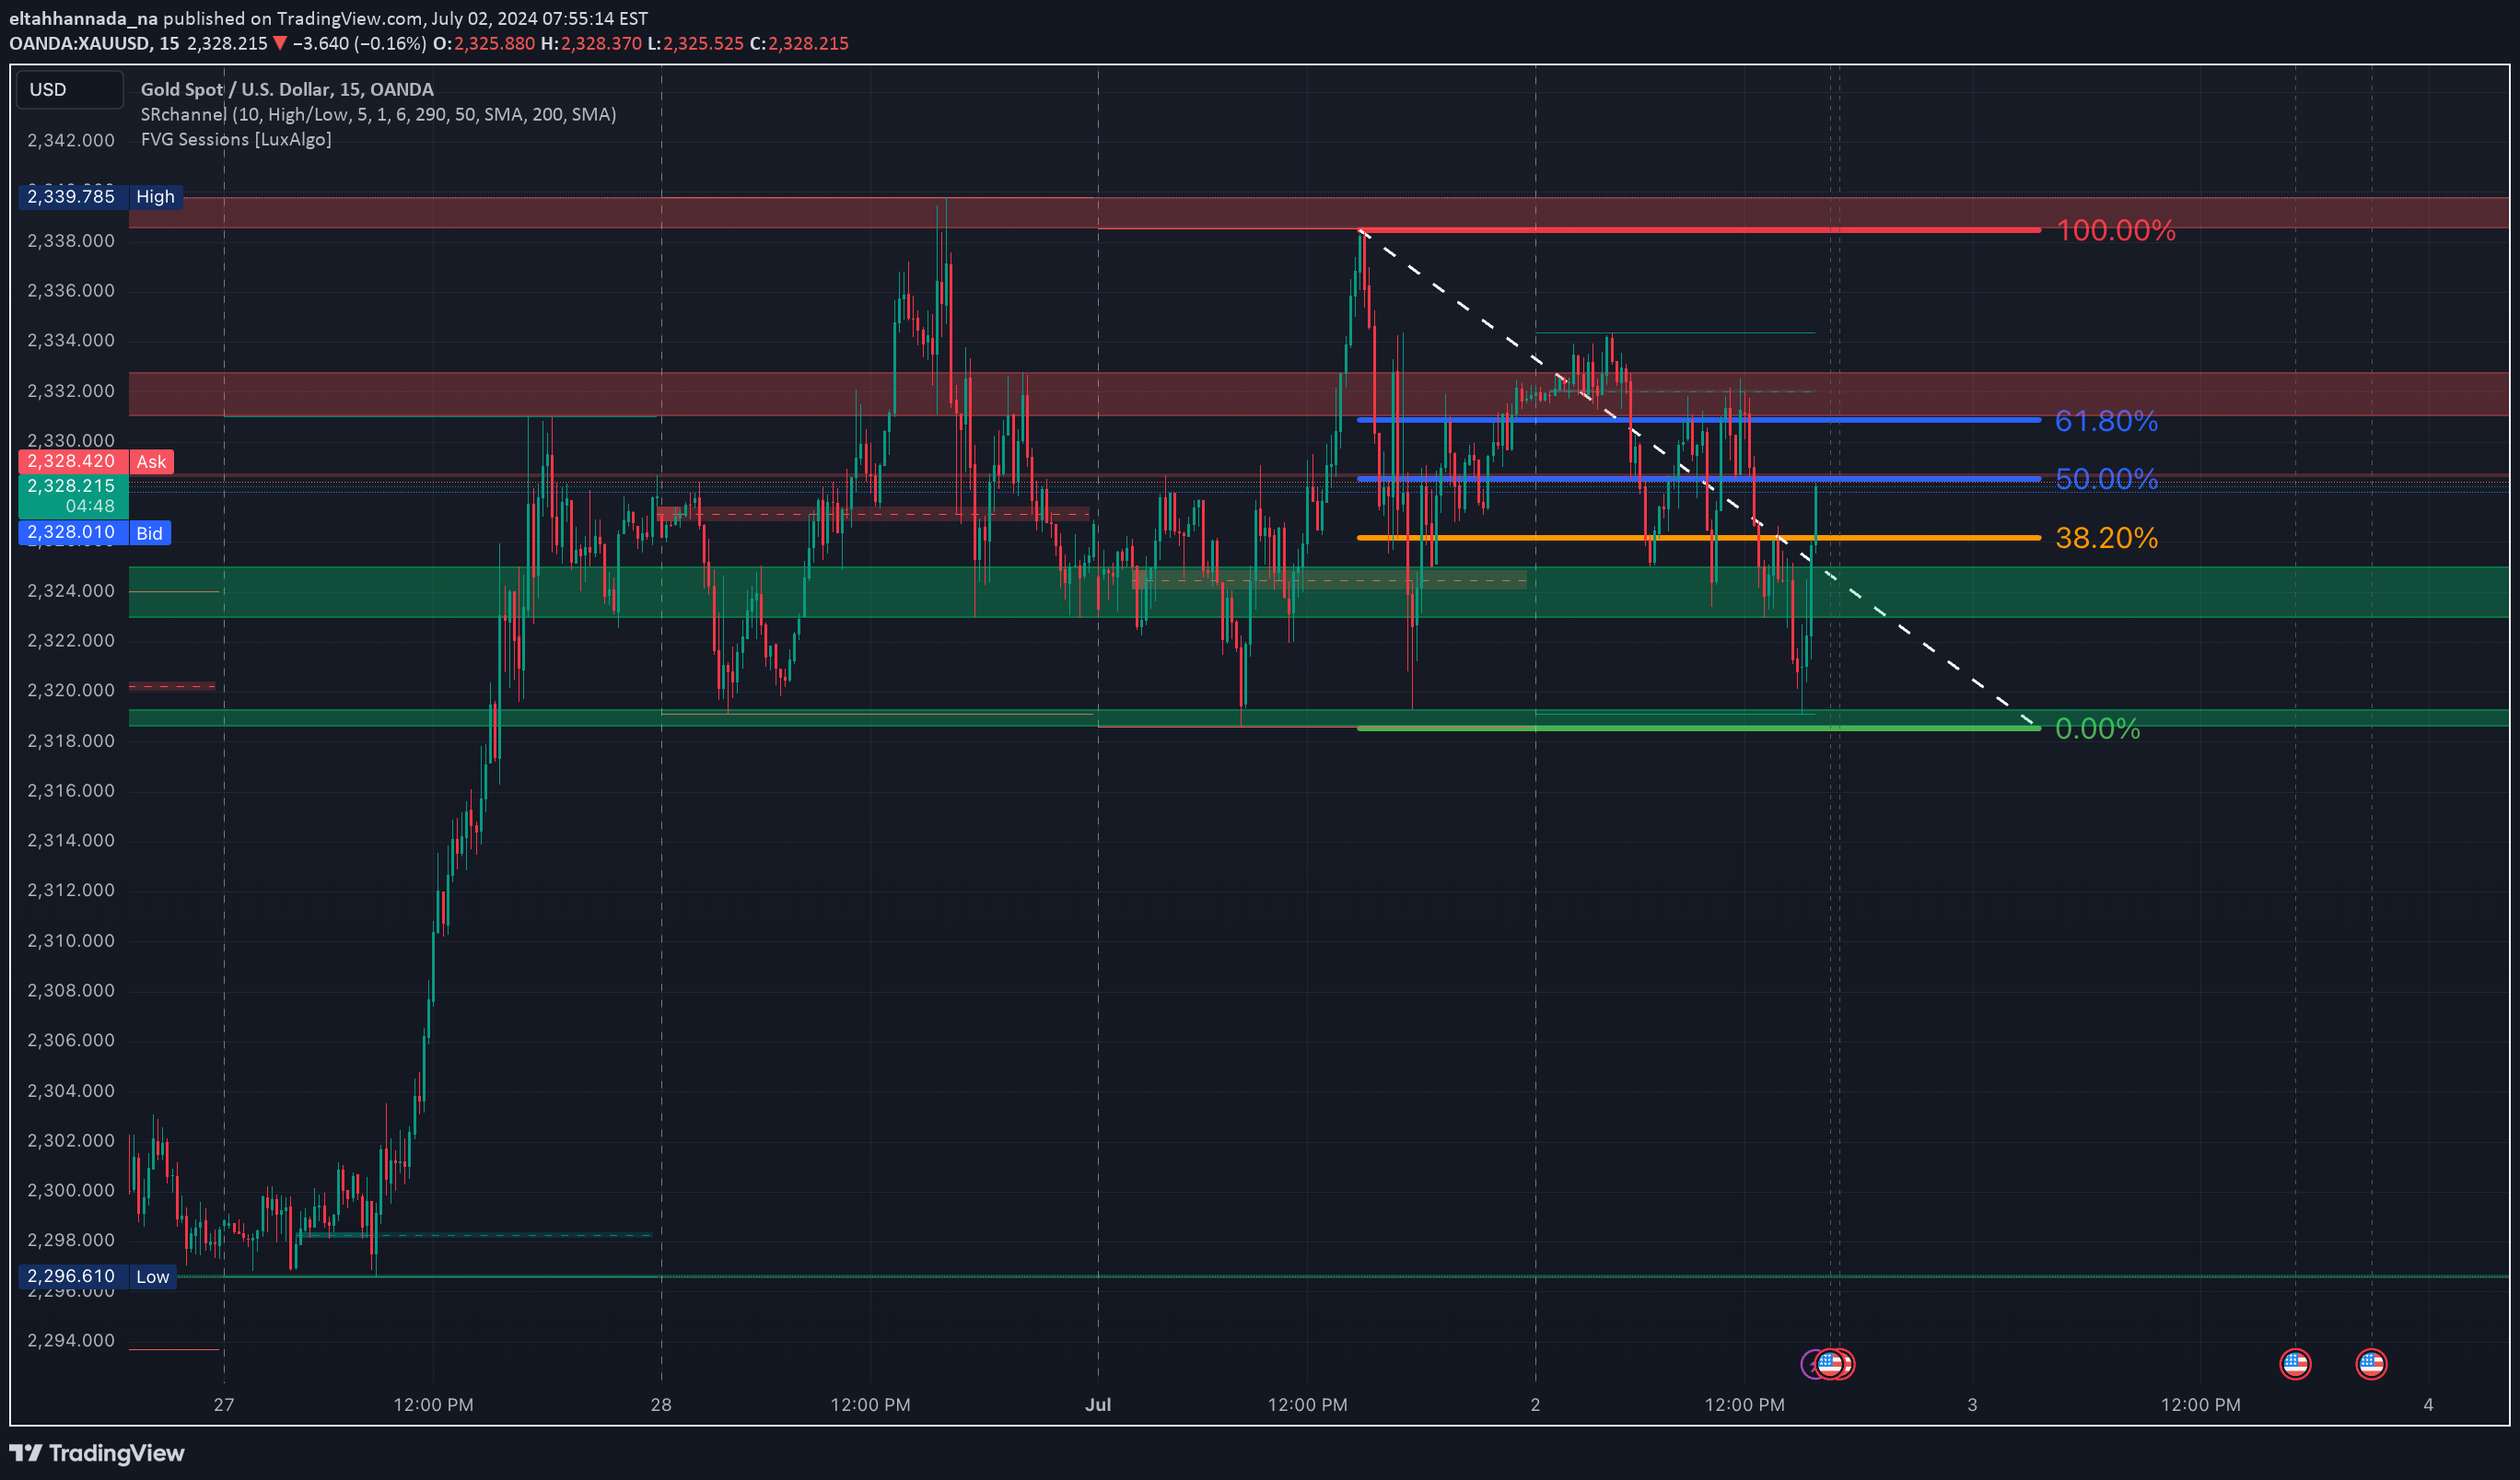
XAUUSD 1. Support and Resistance Zones: - Support: Around 2318.605 (green zone) and another support zone at 2323.000 to 2325.000. - Resistance: - Primary resistance is around 2334.000 (red zone). - Intermediate resistance levels at the 38.2% Fibonacci level (2330.000). 2. Fibonacci Retracement Levels: - 0.0%: At 2339.785 (high). - 38.2%: Approximately at 2330.000. - 50.0%: Approximately at 2327.000. - 61.8%: Approximately at 2324.000. - 100.0%: At 2318.605 (low). - Descending Trend Line: The white dashed line indicates a bearish trend. The price recently bounced off the 100.0% Fibonacci level and is moving towards the trend line resistance. - The price has rebounded sharply from the support level around 2318.605, breaking through the 61.8% and 50.0% Fibonacci levels. - The current price is approaching the 38.2% Fibonacci retracement level (2330.000), which also coincides with a significant resistance zone. Bullish Scenario: 1. Break Above Resistance: - If the price breaks above the 38.2% Fibonacci level (2330.000) and the descending trend line, it could signal a reversal of the recent bearish trend. - The next target would be the primary resistance zone around 2334.000. 2. Volume and Momentum: - Increased volume and bullish momentum are necessary to sustain the break above the resistance levels. Bearish Scenario: 1. Failure at Resistance: - If the price fails to break above the 38.2% Fibonacci level (2330.000) and the descending trend line, it could indicate a continuation of the bearish trend. - The price may then retest the support levels around 2324.000 (61.8% Fibonacci level) and 2318.605 (100.0% Fibonacci level). 2. Bearish Reversal Patterns: - Look for bearish reversal patterns (e.g., bearish engulfing candles) around the resistance levels to confirm a potential move lower. Trading Strategy: Long Position (Bullish Scenario): 1. Entry: - Enter a long position on a confirmed break and close above 2330.000 (38.2% Fibonacci level) and the descending trend line. 2. Stop Loss: - Place a stop loss below 2327.000 (50.0% Fibonacci level) to manage risk. 3. Take Profit: - First target: 2334.000 (primary resistance zone). - Second target: Higher resistance levels if bullish momentum continues. Short Position (Bearish Scenario): 1. Entry: - Enter a short position if the price fails to break above 2330.000 and shows signs of rejection at this level. 2. Stop Loss: - Place a stop loss above 2334.000 to manage risk. 3. Take Profit: - First target: 2324.000 (61.8% Fibonacci level). - Second target: 2318.605 (100.0% Fibonacci level). Summary: The price is currently testing significant resistance levels. The most likely scenario is a short-term pullback or consolidation unless there is a strong bullish breakout above the 38.2% Fibonacci level and the descending trend line. Trading Strategy: - For a bullish breakout, look for entries above 2330.000 with targets towards 2334.000. - For a bearish continuation, consider short entries on rejection at 2330.000 with targets towards 2324.000 and 2318.605.
eltahhannada_na
XAUUSD Current Situation: - Gold prices are trading around the 2323.360 level - The price is facing resistance at the 38.2% Fibonacci retracement level (2326.500) and is currently below a descending trend line, indicating short-term bearish pressure. Key Levels to watch - Resistance: - 2326.500 (38.2% Fibonacci level) - 2329.000 (50.0% Fibonacci level) - 2331.500 (61.8% Fibonacci level) - 2334.000 (strong resistance zone) - Support: - 2313.475 (recent low and significant support zone) Most Likely Scenario Given the current market conditions and technical setup, the most likely scenario is continued bearish pressure with a potential retest of the support zone around 2313.475. This scenario assumes that the price will struggle to break above the 38.2% Fibonacci retracement level (2326.500) and the descending trend line. Trading Strategy Short Position (Most Likely Scenario) Entry: - Enter a short position if the price fails to break above 2326.500 (38.2% Fibonacci level) and shows signs of rejection at this level. - or, enter a short position if the price breaks below 2318.000, confirming continued bearish momentum. Stop Loss: - Place a stop loss above the 2329.000 level to manage risk, ensuring it's above the 50.0% Fibonacci retracement level. Take Profit: - First target: Around 2313.475 (support zone). - Second target: If the price breaks below 2313.475, look for further downside potential, targeting levels such as 2306.000. Long Position (less likely Scenario) Entry: - Enter a long position if the price breaks and closes above 2326.500 (38.2% Fibonacci level) and sustains above this level. Stop Loss: - Place a stop loss below 2318.000 to manage risk. Take Profit: - First target: Around 2329.000 (50.0% Fibonacci level). - Second target: Around 2331.500 (61.8% Fibonacci level) if bullish momentum continues. Summary - Most Likely Scenario: Continued bearish pressure with a potential retest of the support zone around 2313.475. - Trading Strategy: Favor short positions with entries near 2326.500 and stops above 2329.000, targeting 2313.475 and lower levels. Consider long positions only if there is a clear break above 2326.500 with sustained momentum.
eltahhannada_na
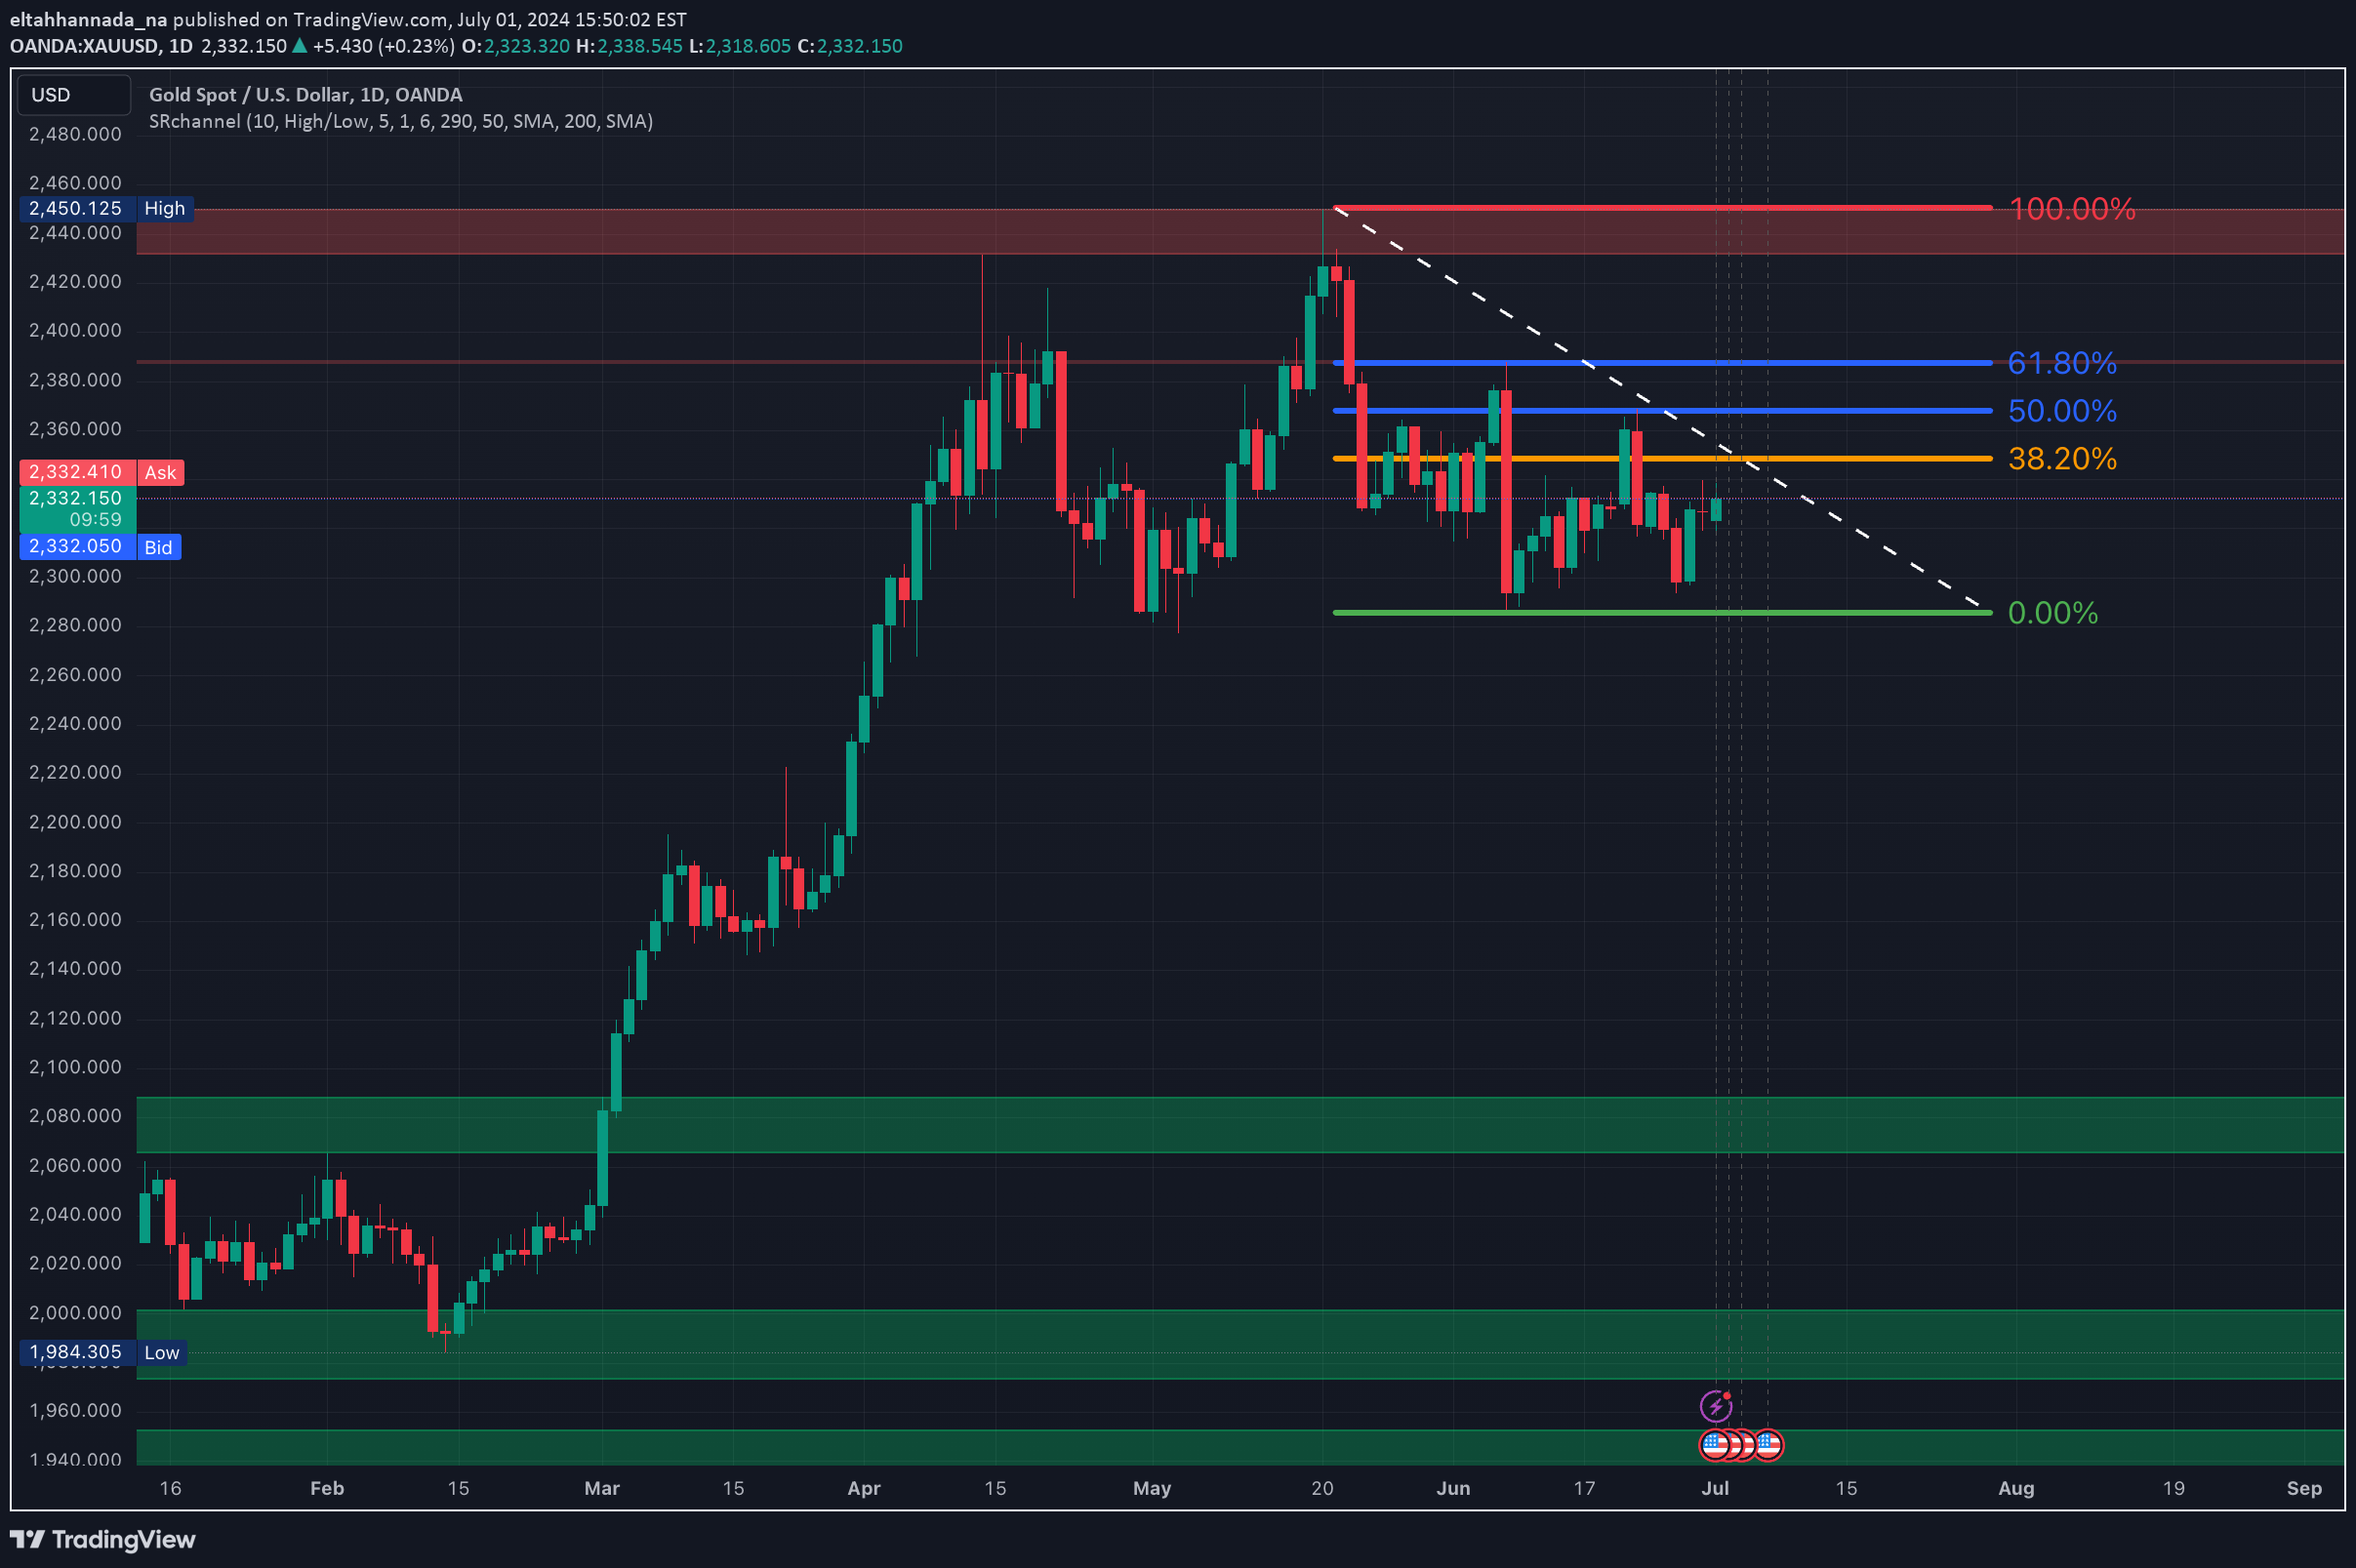
Based on the current charts, the bearish scenario appears more likely for the following reasons: 1.Repeated Resistance: Multiple rejections at the resistance level of 2,332.485. 2.Fibonacci Resistance: The price is near the 61.80% Fibonacci retracement level, a common reversal point. 3.Bearish Flag on Daily Chart: Indicates potential downside continuation. Most Likely Scenario: •Bearish •Entry: Below 2,328.393 if there is a clear breakdown with strong volume. •Target 1: 2,325.000 (short-term support level) •Target 2: 2,319.295 (major support level) •Stop-Loss: Above the breakdown candle or 2,329.000.
eltahhannada_na
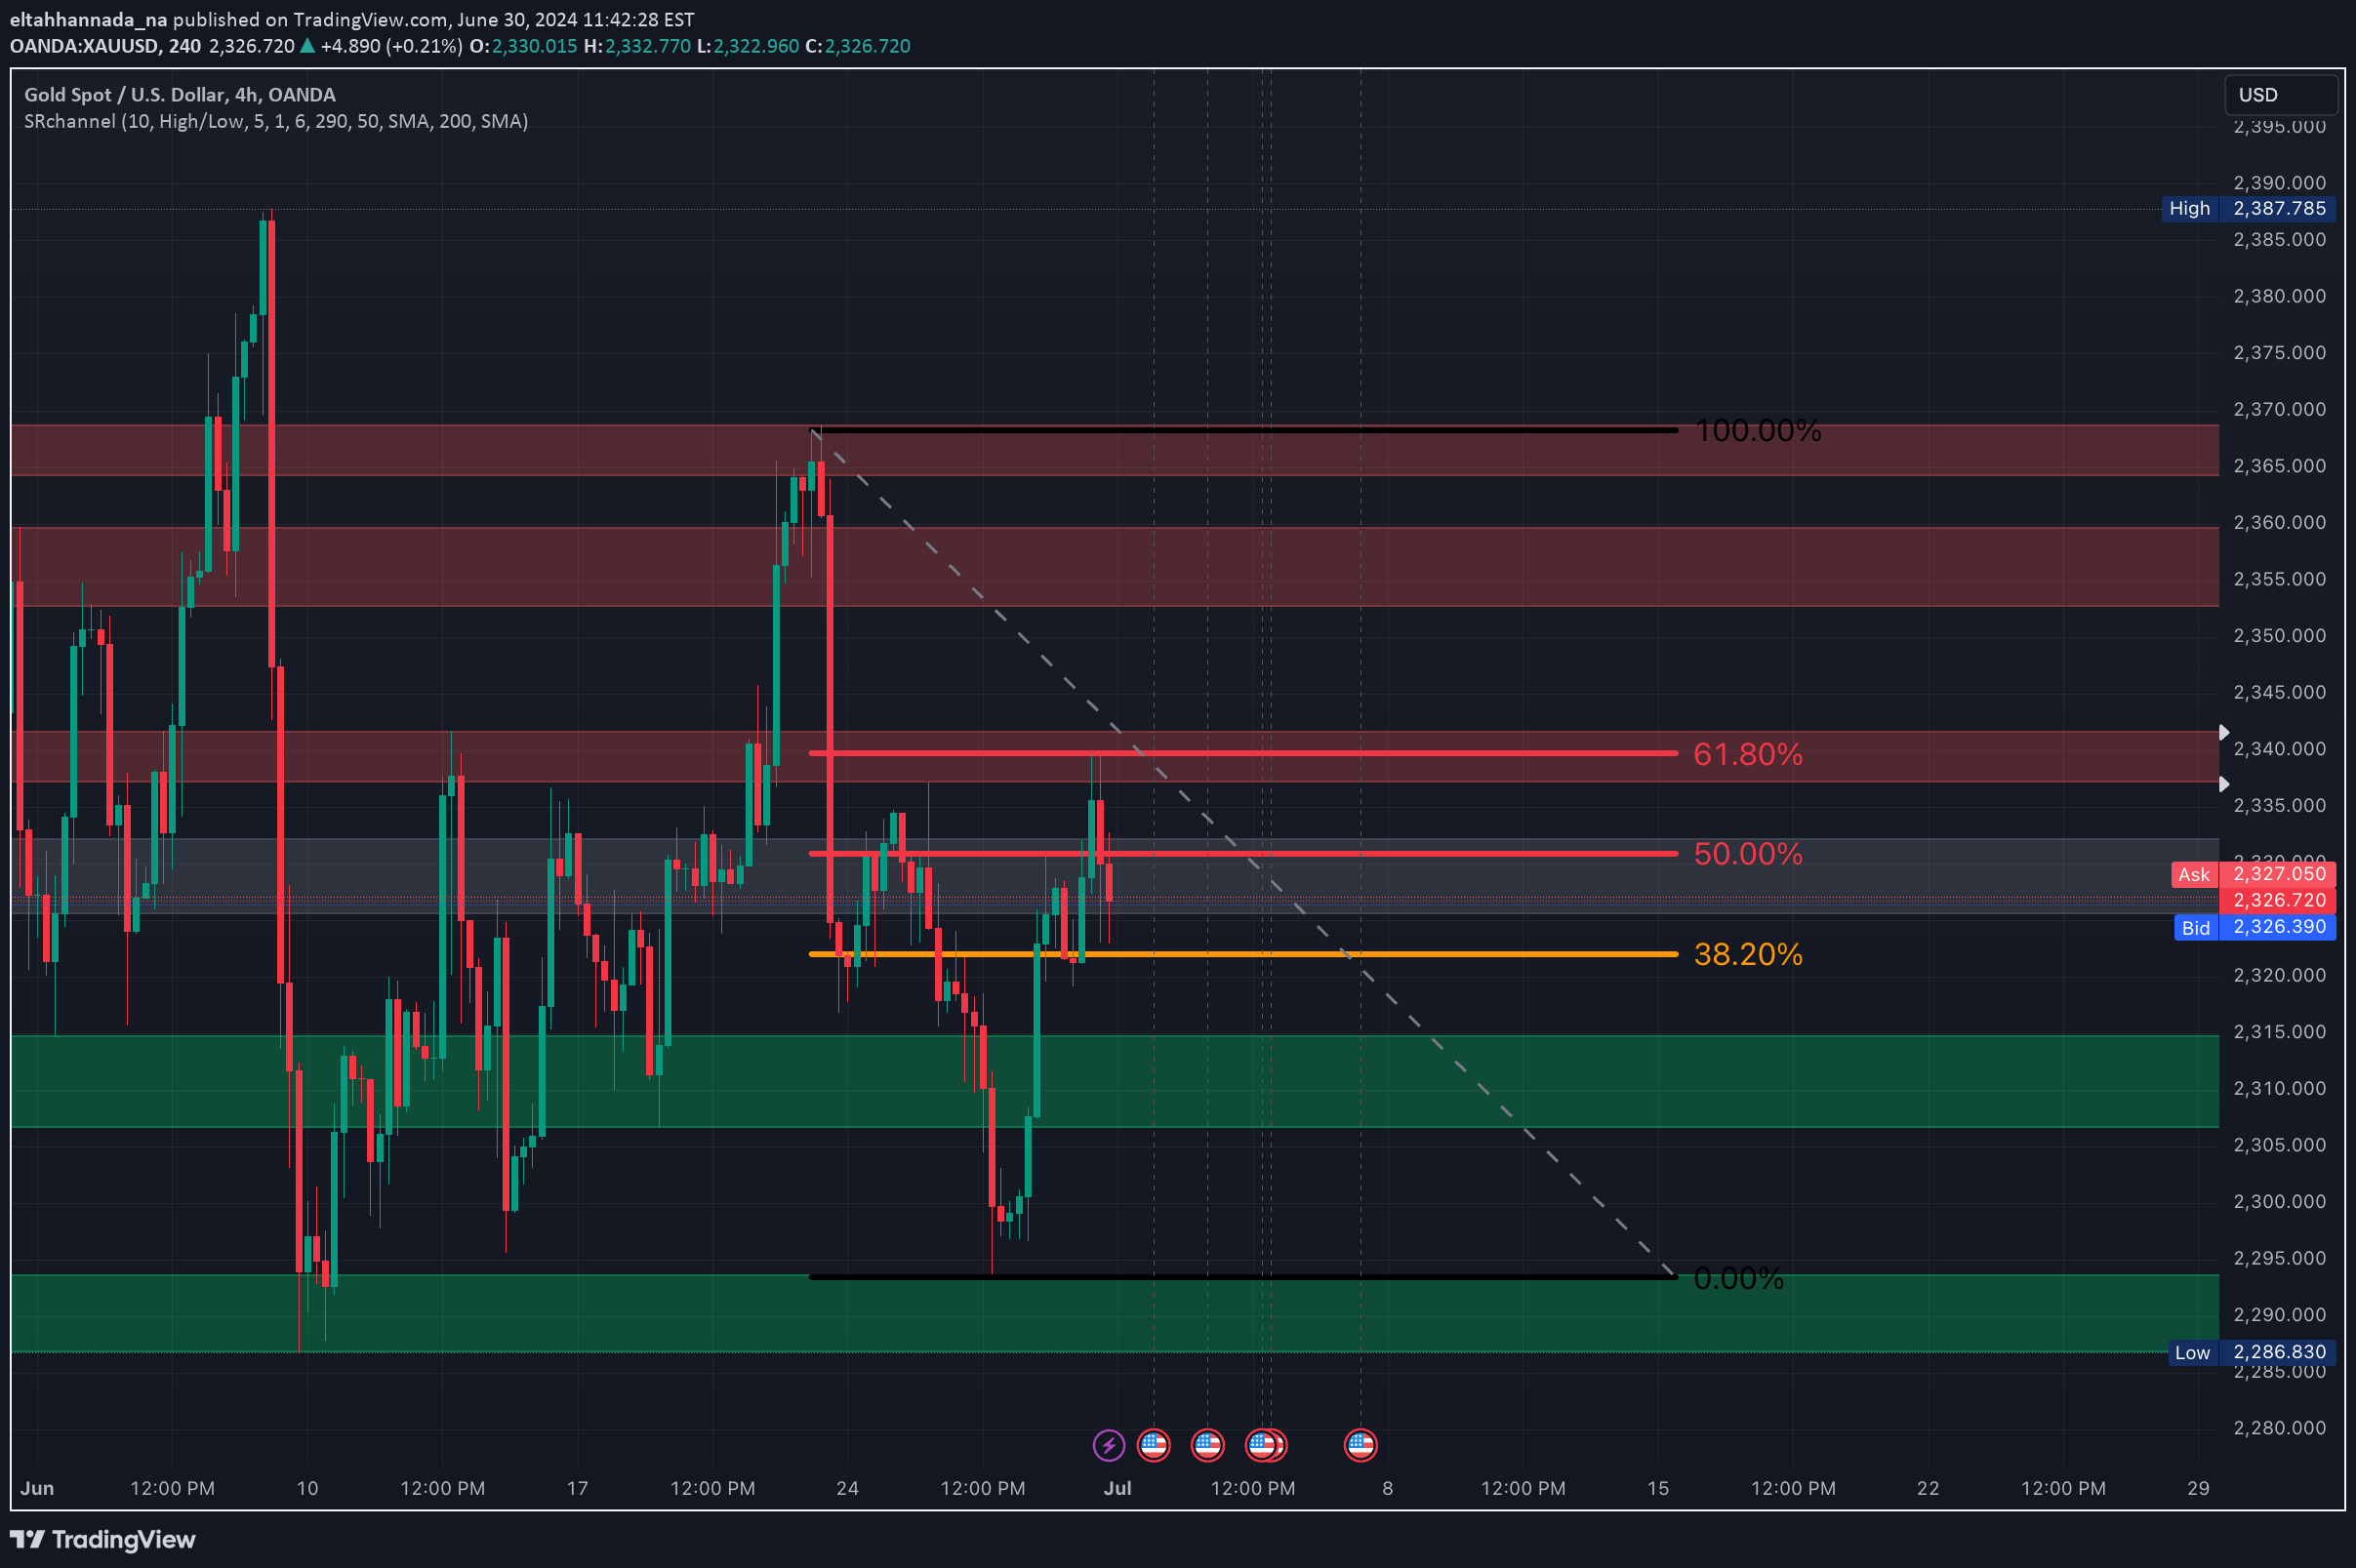
XAUUSD Gold analysis on the 4-hour chart from both bullish and bearish perspectives: Bullish Perspective: 1. Potential Reversal: - The price attempts to form higher lows, indicating a possible trend reversal. 2. Key Resistance Levels: - 50.00% Fibonacci Level (2,328.00): Currently acting as resistance. A break above this level is bullish. - 61.80% Fibonacci Level (2,340.00): Next major resistance. A break above this level could signal further upside. 3. Key Support Levels: - 38.20% Fibonacci Level (2,319.00): This level has provided support recently, suggesting buying interest. - Lower Support Zone (around 2,290.00): Strong support area. If the price stays above this, the bullish outlook remains intact. 4. Volume: Although trading volume is low, any increase in volume could support a bullish breakout. Bullish Strategy: - Entry: Consider long positions if the price breaks above 2,328.00, especially if it sustains above 2,340.00. - Targets: Aim for the upper resistance zones around 2,355.00 and higher. - Stop-Loss: Place stop-loss below 2,319.00 to protect against potential pullbacks. Bearish Perspective: 1. Downtrend Confirmation: - The price is in a clear downtrend, making lower highs and lower lows. 2. Key Resistance Levels: - 61.80% Fibonacci Level (2,340.00): Recent price rejection here indicates strong resistance. - 50.00% Fibonacci Level (2,328.00): The price is struggling to stay above this level. 3. Key Support Levels: - 38.20% Fibonacci Level (2,319.00): Watch for a break below this level for further downside. - Lower Support Zone (around 2,290.00): Next major support area. 4. Volume: Low trading volume suggests weak bullish attempts, supporting the bearish outlook. Bearish Strategy: - Entry: Consider short positions if the price stays below 2,328.00, especially if it drops below 2,319.00. - Targets: Aim for 2,290.00 and below. - Stop-Loss: Place stop-loss above 2,340.00 to protect against potential reversals. Summary - Bullish Signals: Look for breaks above key resistance levels (2,328.00 and 2,340.00) with increasing volume. - Bearish Signals: Watch for price rejections at key resistance levels and breaks below support levels (2,319.00 and 2,290.00) with low volume.Based on the current price action and market conditions prediction for gold prices: Technical Analysis: 1. Current Price Action - The current price is around 2321 - Recent price action shows a significant decline followed by stabilization around support levels. 2. Support and Resistance Levels - Support: 2318 is a critical support level. If this level holds, we might see a rebound or consolidation around this price. - Resistance: 2329 and higher levels (2334 - 2338) are key resistance zones. If the price approaches these levels, it may face selling pressure. 3. Fibonacci Retracement: - The price has been fluctuating around key Fibonacci levels. A hold above the 0.0% level (2318) is crucial for a potential bounce back. Fundamental Analysis: 1. Economic Data: - The anticipation of US jobs data creates a cautious sentiment in the market. Strong data could lead to a decrease in gold prices, while weak data might boost them. 2. Market Sentiment: - Current news indicates mixed sentiments with cautious optimism in equities but uncertainty in gold. This suggests potential short-term volatility. 3. Federal Reserve Policies: - Uncertainty regarding the Fed's stance on interest rates is a significant factor. Any dovish signals (e.g., delaying rate hikes) could support gold prices, while hawkish signals (e.g., faster rate hikes) could pressure them. Prediction: - Short-Term (Next Few Days): - Rangebound Movement: Gold prices are likely to remain within a range, oscillating between the support level (around 2318.6) and the resistance levels (around 2329 to 2334). - Volatility: Expect some volatility around the release of the US jobs data. Prices may spike or dip depending on the data's interpretation. - Medium-Term (Next Few Weeks): - Potential Rebound: If the support at 2318 holds and US jobs data is weaker than expected, there could be a rebound towards higher resistance levels (2334 - 2338). - Continued Pressure: If the support breaks and the US jobs data is strong, gold prices could see further declines, potentially testing lower support levels around 2306 Strategy: - For Long Positions: Consider entering near the 2318.6 support level with a stop loss below 2310, targeting a rebound towards 2329 or higher. - For Short Positions: Consider entering near the resistance levels (2329 to 2334) with a stop loss above 2338, targeting a decline towards 2318.6 or lower.
Disclaimer
Any content and materials included in Sahmeto's website and official communication channels are a compilation of personal opinions and analyses and are not binding. They do not constitute any recommendation for buying, selling, entering or exiting the stock market and cryptocurrency market. Also, all news and analyses included in the website and channels are merely republished information from official and unofficial domestic and foreign sources, and it is obvious that users of the said content are responsible for following up and ensuring the authenticity and accuracy of the materials. Therefore, while disclaiming responsibility, it is declared that the responsibility for any decision-making, action, and potential profit and loss in the capital market and cryptocurrency market lies with the trader.