
elitetrader9090
@t_elitetrader9090

What symbols does the trader recommend buying?
Purchase History
پیام های تریدر
Filter
elitetrader9090
Gold (XAU/USD) Analysis

Gold (XAU/USD) AnalysisThis chart provides a technical outlook on **Gold (XAU/USD)**, showing possible **bullish** and **bearish** scenarios based on price action and support/resistance levels. Bullish OutlookKey Support Holding**: Gold is staying above **$3,125-$3,130**, showing buyers are stepping in. - **Uptrend Structure**: Price is following a rising trendline, meaning bullish momentum is intact. - **Breakout Zone**: If Gold surpasses **$3,155-$3,160**, it could rally toward **$3,170-$3,180**, as no major resistance exists in that range. What to Watch?- A strong breakout with volume above **$3,155-$3,160** confirms upside potential. - Look for support at moving averages (EMAs) to validate trend continuation. Bearish Outlook- **Resistance Rejection**: If Gold fails to break above **$3,155-$3,160**, it might face selling pressure. - **Break Below $3,140**: If price drops under this level, it could target **$3,125-$3,110**, which is the next key support. - **Further Downside**: A breakdown below **$3,110** could lead to a deeper decline towards **$3,090-$3,080**. What to Watch? - A drop below **$3,140** with strong volume could confirm further downside. - If selling pressure increases, Gold may retest lower support zones. Final Thought Gold is currently in an **uptrend**, but traders must monitor key levels: ✔ **Bullish if** it breaks **$3,160** 📊 ✔ **Bearish if** it falls below **$3,140** 🔻 Stay cautious and wait for price confirmation before making a move! 🚀https://www.tradingview.com/x/khQmbwcU/
elitetrader9090
Gold setup (XAU/USD) Chart analysis

Gold (XAU/USD) Scenarios https://www.tradingview.com/x/LCoTkYUk/ *Market Overview:* - Gold is currently trading around *$3,132.70*, maintaining its upward trajectory. - The price remains *above key moving averages* (7, 21, and 50 EMA), signaling ongoing bullish strength. *Critical Price Levels:* - *Resistance Zone ($3,140-$3,145):* Price has tested this level but hasn’t managed to break through convincingly. A strong move above could open the door for further gains. - *Support Area ($3,127-$3,130):* Holding above this region is crucial for buyers to maintain control. - *50 EMA ($3,110.38):* Acts as a dynamic support; a drop below this level may indicate weakening momentum. *Potential Scenarios:* 🔹 *Bullish Outlook:* - A *decisive breakout* above *$3,145* could accelerate gains, pushing towards *$3,160-$3,170*. - Increased buying pressure with strong volume would reinforce the uptrend. 🔻 *Bearish Outlook:* - If Gold *fails to hold support* at *$3,127, we might see a pullback towards *$3,110** (50 EMA). - A break below *$3,110* could shift sentiment, potentially leading to a dip toward *$3,070-$3,080*. *Final Thoughts:* Gold remains *bullish* but needs to clear resistance for further upside. If support holds, buyers may push higher; otherwise, a retracement could be in play.A bearish move, dropping from **$3,127** to **$3,102**, signaling increased selling pressure. This decline suggests that resistance at higher levels held firm, prompting profit-taking or fresh short positions. **Bearish Scenario** - **Selling Pressure:** Increased selling, possibly due to profit-taking or technical breakdowns. - **Support at $3,102:** This level acted as a temporary floor; if broken, further downside towards **$3,090-$3,080** is possible. **Next** - A **bounce from $3,102** trigger a retracement back toward **$3,115-$3,120** buyers step in. - A **break below $3,102** may extend losses to **$3,090 or lower**, confirming continued bearish sentiment. Traders should watch price action around **$3,102** for the next move!Gold price bounce from 3102 to 3160 wow guys close all trades now
elitetrader9090
Gold (XAU/USD) Technical Analysis

Gold (XAU/USD) Technical Analysis#### **Current Market Overview** - **Price:** $3,092 - **Support Level:** $3,087 - $3,083 - **Resistance Level:** $3,095 - $3,100 - **Trend:** Uptrend continuation, with price holding above key EMAs ---### **📈 Bullish Scenario** - If the price **breaks above $3,095 - $3,100** resistance, expect further upside movement towards **$3,110 - $3,120**. - The **rising trendline and EMA support** suggest buyers are in control. - A strong close above resistance could trigger **momentum buying** and fuel a rally. ---https://www.tradingview.com/x/QJ8wzoly/### **📉 Bearish Scenario** - A **failure to break $3,100** may lead to a pullback towards **$3,087 - $3,083** support. - If sellers push below this support zone, further downside towards **$3,076 and $3,065** is possible. - Increased selling pressure may shift sentiment, leading to a correction. ---### **Conclusion** - **Above $3,095:** Bullish continuation toward higher levels. - **Below $3,087:** Potential bearish correction before another leg up.🚀 **XAUUSD Hits 3106!** 🚀 Gold just reached **3106**, a strong bullish push! 📈💰 If you caught this move, well done! 🎉 ### **What’s Next?** ✅ **Take Some Profits:** Secure part of your gains to protect your capital. 💵🔒 ✅ **Let Some Run:** Keeping a portion open could allow for even bigger profits if the momentum holds. 📊🔥 ✅ **Final Target in Sight?** Do you have a set goal? Gold’s trend is looking strong, but risk management is key. 🎯📉Target Reached and hit 2027 huge gain now close all trades
elitetrader9090
Gold (XAU/USD) Trading Strategy

Gold (XAU/USD) Trading Strategy **📈 Bullish Strategy (Long Trade)****Entry:** - Look for a **bounce** from the **$3,071 - $3,072 support zone** or **$3,063 S2 support level**. - Confirmation signals: - A **bullish candlestick pattern** (e.g., engulfing or pin bar) near support. - Price holds above **7 EMA ($3,071)** and **21 EMA ($3,063)**. **Stop-Loss (SL):** - Below the **S2 support zone at $3,060** (to avoid fake breakouts). **Take-Profit (TP) Levels:** 1. **First Target:** $3,080 (recent high) 2. **Second Target:** $3,090 3. **Extended Target:** $3,100+ if momentum continues **Risk-Reward Ratio:** - Aim for a **1:2 or 1:3** ratio, risking 10-15 points for 20-30 points profit. ---**📉 Bearish Strategy (Short Trade)****Entry:** - If gold **breaks below $3,063 (S2)** with strong bearish momentum and volume. - Confirmation signals: - A **break and retest** of $3,063 as new resistance. - Price trading below **50 EMA ($3,052)**. **Stop-Loss (SL):** - Above the $3,072 level (previous support turned resistance). **Take-Profit (TP) Levels:** 1. **First Target:** $3,052 (50 EMA) 2. **Second Target:** $3,040 3. **Extended Target:** $3,020 (key psychological level) **Risk-Reward Ratio:** - Ensure at least a **1:2 ratio**, risking 10-15 points for 20-30 points profit. Additional Trading Tips- **Wait for confirmation**: Don't enter trades too early—wait for candlestick confirmation at key levels. - **Watch volume:** Higher volume increases trade reliability. - **Monitor news & fundamentals:** Major US economic data and Fed speeches can impact gold prices. - **Adjust SL & TP dynamically**: Use trailing stops if the trade moves in your favor.https://www.tradingview.com/x/zDfX3S7j/Gold Trade1️⃣ Trade Execution & Current Status- **Buy Entry:** **$3,073** - **Current Price:** **$3,086** - **Profit Secured:** Since price moved in favor, securing partial profits helps lock in gains while keeping a position open for further upside. 2️⃣ Next Price Targets & Key Levels- **Resistance (Upside Targets):** - **$3,090–$3,100** → Potential continuation of the bullish trend. - **Support (Downside Risks):** - **$3,073, $3,069** → Key levels to watch for pullbacks. 3️⃣ Trade Management Strategy- **Secure Profits:** Selling part of the position ensures gains while reducing risk. - **Hold for More:** Keeping some trades open allows capturing further gains if the trend continues. - **Trailing Stop-Loss:** Adjusting stop-loss upwards protects profits if the price reverses. 4️⃣ Market Outlook- **Bullish Momentum:** Gold remains strong amid global uncertainty and potential Fed rate cuts. - **Watch for:** Resistance near **$3,100**, possible pullbacks, and key economic news impacting price action. 💡 **Conclusion:** Manage risk wisely, lock in profits, and monitor price action for further moves. 🚀### **Gold Trade Update – Profitable Move!** 🚀✨ 📌 **Entry:** **3073** 📌 **Target Levels:** - 🎯 **3090** (Hit ✅) - 🎯 **3097** (Hit ✅) 📈 **Total Secured Profit:** **260 pips** 💰 🔹 Gold continues its bullish momentum, breaking key resistance levels. 🔹 Safe-haven demand remains strong due to global uncertainties, supporting the uptrend. 🔹 Trades have been **secured**, locking in profits while monitoring further price action. 💡 **Next Steps:** Close All Trades for now
elitetrader9090
Think Like a Pro: Trade with Discipline, Not Emotion

**Taming Greed: The Secret to Long-Term Trading Success** Trading is a battlefield of emotions—**excitement, fear, hope, and greed**. Among them, **greed is the silent killer**, pushing traders to overtrade, overleverage, and chase the market, ultimately leading to disaster. As the saying goes: 📉 **“Bulls make money, bears make money, but pigs get slaughtered.”** **Why Greed is Your Worst Enemy** Fear may hold you back, but **greed pushes you into reckless decisions**. It makes you **ignore your trading plan, risk too much, and hold losing trades for too long**—all in pursuit of bigger gains. But here’s the truth: **The market rewards patience, not desperation.** **How to Keep Greed in Check & Trade Like a Pro** 🔥 **Follow a Strict Trading Plan** A well-defined **plan is your shield against impulsive decisions**. Know your entry, exit, and risk before placing a trade. **Discipline beats greed—every time.** 📊 **Master Risk Management** Avoid the temptation to **bet big for quick gains**. A strong **risk strategy protects your capital** and ensures survival in the long run. The goal isn’t just to win—it’s to stay in the game. ⏳ **Say No to Overtrading** More trades don’t mean more profits—**it usually means more losses**. Trade **with precision, not emotion**. If you’re trading just for the thrill, **you’re gambling, not investing**. **Success = Patience + Discipline** Greed is an illusion—it promises wealth but delivers ruin. The real path to trading mastery lies in **consistency, control, and calculated risks**. 💡 **Trade smart. Stay disciplined. Build wealth the right way.**
elitetrader9090
Gold (XAU/USD) Technical Analysis

**Gold (XAU/USD) Technical Analysis – 1H Chart** **Current Price:** ~$3,018.51 **Resistance Levels:** ~$3,030, ~$3,045 **Support Levels:** ~$3,010, ~$2,995 *📈 Bullish Scenario:** - **Break Above Resistance (~$3,030-$3,045):** A sustained move above the nearest resistance zone could push gold toward $3,050 and beyond. - **Moving Averages Support:** If short-term moving averages (blue/black lines) provide support, bulls could regain momentum. - **Positive Risk Sentiment:** Any dovish signals from the Fed or safe-haven demand could fuel a rally. **Target:** $3,045–$3,060 *📉 Bearish Scenario:** - **Break Below Support (~$3,010-$2,995):** If gold drops below this level, it could test the next support zone around $2,990. - **Failure to Hold Above $3,020:** A rejection at resistance might increase bearish pressure. - **Stronger USD & Risk-On Sentiment:** If the US Dollar strengthens or risk appetite improves, gold could face downward pressure. **Target:** $2,995–$2,980 **Conclusion:** Gold is currently consolidating near key levels. A breakout above $3,030 could lead to further gains, while a drop below $3,010 may trigger a sell-off. Keep an eye on market sentiment and economic data for confirmation. 🚀📉https://www.tradingview.com/x/C4rvMopA/
elitetrader9090
Descending Channel in XAU/USD (Gold)

Trade Setup for Descending Channel in XAU/USD (Gold)**📉 Bearish Trade Setup (Sell Strategy)** Since the price is trending within a descending channel, the best trade approach is to **sell at resistance** and **target support levels**. **📌 Entry Points:** 🔹 **Sell Entry #1:** Near the upper boundary of the descending channel (~3,020 - 3,030). 🔹 **Sell Entry #2:** If price retests and fails to break above the 21 EMA (~3,015 - 3,018). **🎯 Target Levels (Take Profit - TP):** ✅ **TP1:** 3,000 (Psychological level and lower channel support) ✅ **TP2:** 2,980 (Next major support zone) ✅ **TP3:** 2,960 (Extended target if the trend continues) **🔒 Stop Loss (SL):** 🚨 **SL Above 3,035-3,040:** If price breaks out above the descending channel, it invalidates the setup. **📊 Trade Confirmation:** ✅ **EMA Rejection:** Watch for price rejecting the **21 EMA (Blue Line)** as resistance. ✅ **Volume Analysis:** Look for increased selling volume when price approaches resistance. ✅ **Bearish Candlestick Patterns:** Such as **bearish engulfing, shooting star, or evening star** near resistance. **📈 Alternative Bullish Setup (If Trend Breaks Upward)** If price **breaks above 3,040 with strong volume**, it could signal a trend reversal. In this case: 🔹 **Buy Entry:** After a confirmed breakout & retest above 3,040. 🎯 **Targets:** 3,060 - 3,080. 🚨 **SL:** Below 3,030. **Conclusion:** 🔻 **Primary Strategy: Sell on Rallies within the Channel.** 🔺 **Alternative Plan: Wait for a Bullish Breakout Before Buying.** 📉 **Stay disciplined with Stop Loss & Risk Management!*https://www.tradingview.com/x/eIpoUy1f/
elitetrader9090
Gold (XAU/USD) Head & Shoulder Chart Pattern H4
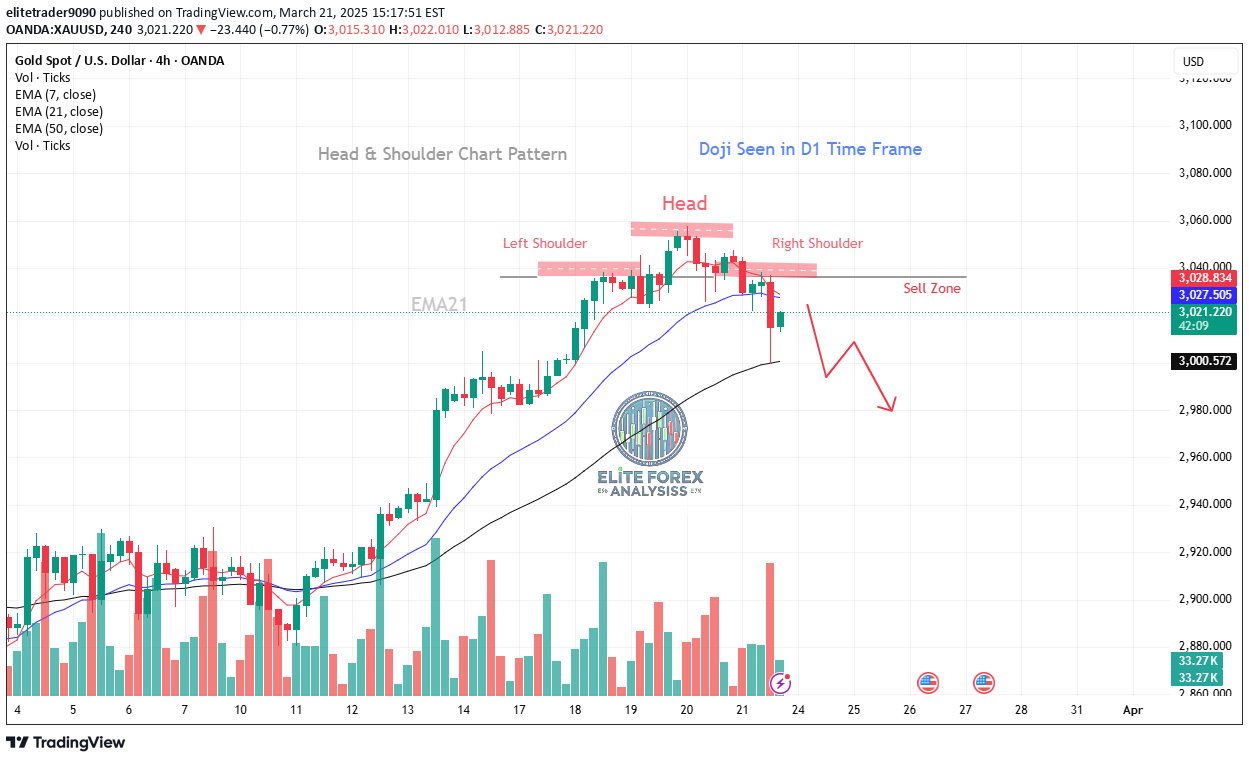
Gold (XAU/USD) Head & Shoulder Chart Pattern**Bearish Breakdown Confirmation (📉 Downtrend Risk)**- **Head & Shoulders Breakdown:** The price formed a **head and shoulders pattern**, signaling a potential reversal. - **Sell Zone:** Price is trading below the **21 EMA ($3,027)** and **7 EMA ($3,028)**, confirming bearish pressure. - **Support Test:** Price is approaching the **50 EMA ($3,000)**, which is a key level. A break below this could accelerate selling. - **Bearish Confirmation:** If gold fails to reclaim the **$3,028-$3,030 zone**, further downside toward **$2,980-$2,960** is likely. - **Entry Points:** A rejection from **$3,025-$3,030** is ideal for sellers, while a breakdown below **$3,000** confirms further weakness. 📌 **Conclusion:** - **Below $3,030 = Bearish outlook toward $3,000 & $2,980** - **Break below $3,000 = Strong downside toward $2,960** - **Above $3,030 = Bulls regain control** Trading Plan:🔴 Sell near resistance ($3,025-$3,030) with a stop above $3,035. 🟢 Take profit at $3,000, then $2,980 if breakdown occurs.https://www.tradingview.com/x/RdveNV6O/**Gold Trade Update:** Breakout sell entry at **3030**, hit **3005**, securing **250 pips** in profit! 🎯 Congratulations to those who followed the idea. Stay tuned for more successful setups. ✅ **Close all trades for now.**close trades now
elitetrader9090
Gold (XAUUSD) H1 Chart Analysis with D1 Doji Candlestick Insight

Gold (XAU/USD) H1 Chart Analysis with D1 Doji Candlestick Insight1. **Resistance Zone ($3,050 - $3,060)** - Gold is currently testing a **resistance level** around $3,050. - A clear **break and hold above this level** could push prices towards $3,070 or higher. 2. **Support Levels to Watch:** - **Immediate support:** $3,040 (near 21 EMA) - **Stronger support zone:** $3,030 (highlighted in red on the chart) - **Major support level:** $3,020 (Key demand area) 3. **Doji Candlestick on D1 Indicates Possible Pullback** - Yesterday’s **Doji candle on the daily timeframe (D1)** signals **market indecision** and a possible **retracement** before a continuation. - If today's session follows with a bearish close, Gold may **reject the resistance zone** and fall towards the **$3,030 - $3,020 support area**. 4. **Bullish & Bearish Scenarios:** - **Bullish:** If price breaks **above $3,050** and holds, we could see a rally towards **$3,070 - $3,080**. - **Bearish:** Failure to hold above **$3,050** and a break below **$3,040-$3,030** could confirm the Doji signal, leading to a deeper correction.https://www.tradingview.com/x/FpJTxBWu/Analysis highlights a bearish movement in gold (XAU/USD) after breaking a key support level. see*1. Bearish Move Confirmed:*- Gold dropped **100 pips** from **3043 to 3030**, indicating a strong selling pressure. - This confirms a bearish trend is in play. *2. Support Level Broken:*- **3040 was acting as support**, meaning buyers were previously defending this level. - Once price broke below **3040**, selling momentum increased, triggering a short trade. *3. Trade Execution & Profit Strategy:*- **Entry:** After support broke, a sell trade was activated. - **Profit Taking:** Price hit 3030, meaning traders have already gained 100 pips. - **Next Steps:** Secure partial profits and **hold the remaining position** for potential further downside. *Key Takeaway:*The breakdown of support at 3040 led to a quick drop, offering a great short opportunity. Now, traders should manage their positions—either taking profit or holding for more downside depending on risk appetite.
elitetrader9090
XAUUSD Technical insights and possible trading strategies

**1. Trend Analysis (Bullish setup)https://www.tradingview.com/x/a0jbEonX/- The price is currently in an **uptrend**, confirmed by the **higher highs and higher lows**.- The **ascending trendline** acts as a dynamic support level.- The **price is above the 50 EMA**, which usually signals a bullish trend.- However, it's currently testing support, and a break below could shift momentum.**2. Key Support & Resistance Levels**- **Support Zone ($3,042 - $3,046, marked in red)** - Price has previously bounced from this area. - The **50 EMA** is also near this support, adding strength. - If this level holds, it could act as a buying zone.- **Resistance Zone ($3,050 - $3,060, marked in green)** - Price faced rejection from this zone earlier. - A breakout above this resistance could signal further upside. - If the price fails to break, it may consolidate or retrace.**3. Moving Averages Analysis**- **7 EMA ($3,048.844) & 21 EMA ($3,047.889)** - Short-term EMAs are **very close to price action**, indicating consolidation. - If the **7 EMA crosses below the 21 EMA**, it could signal short-term weakness.- **50 EMA ($3,042.649)** - A **critical dynamic support** level. - If the price bounces from here, the bullish trend remains intact. - A breakdown could trigger a deeper pullback. **4. Possible Trading Strategies** **📈 Bullish Setup (Buy Scenario)**- **Entry:** Look for **bullish confirmation (green candle, higher low)** near the support zone ($3,042 - $3,046).- **Target:** Initial target near resistance at **$3,050 - $3,060**, then **$3,070+**.- **Stop-Loss:** Below **$3,040** (just under the trendline and 50 EMA). **📉 Bearish Setup (Sell Scenario)**- **Entry:** If price **closes below $3,042**, it could indicate a breakdown.- **Target:** Next support area around **$3,030** or lower.- **Stop-Loss:** Above **$3,050** (in case of a false breakdown).**5. Volume Confirmation**- **Low volume near support** → Risk of breakdown.- **High volume breakout above resistance** → Strong bullish move.- **Divergence (price rising but volume dropping)** → Weak trend, possible reversal. **Conclusion:**- **Watch price action near $3,046 support**—a bounce could lead to new highs.- **If support breaks, be ready for a pullback to $3,030 or lower.**- **Confirm moves with volume before entering trades.**🔥 XAU/USD Update – Trade Successfully Executed!✅ Sell Target Hit! Gold dropped from 3037 support to 3030, securing profits. 🎯💰📌 Next Steps:✔ Close the trade and lock in gains.✔ Watch price action for the next opportunity.✔ Key Levels to Monitor:If 3030 breaks, next downside targets: 3025 → 3020.If 3030 holds, expect a potential bounce back toward 3035-3040.
Disclaimer
Any content and materials included in Sahmeto's website and official communication channels are a compilation of personal opinions and analyses and are not binding. They do not constitute any recommendation for buying, selling, entering or exiting the stock market and cryptocurrency market. Also, all news and analyses included in the website and channels are merely republished information from official and unofficial domestic and foreign sources, and it is obvious that users of the said content are responsible for following up and ensuring the authenticity and accuracy of the materials. Therefore, while disclaiming responsibility, it is declared that the responsibility for any decision-making, action, and potential profit and loss in the capital market and cryptocurrency market lies with the trader.